|
- Interim Update 11th April 2007
Copyright
Reminder
The commentaries that appear at TSI
may not be distributed, in full or in part, without our written permission.
In particular, please note that the posting of extracts from TSI commentaries
at other web sites or providing links to TSI commentaries at other web
sites (for example, at discussion boards) without our written permission
is prohibited.
We reserve the right to immediately
terminate the subscription of any TSI subscriber who distributes the TSI
commentaries without our written permission.
Focus on the disease, not the symptom
It is not reasonable to conclude that a large deficit on the current
account is a problem, or is indicative of a problem, simply because it
happens to exist. ...we view the deficit on the current account as a
SYMPTOM of an inflation problem...
A writer desiring to paint a bearish picture of US economic prospects
and the US$ could choose to highlight the huge US current account
deficit, because the word "deficit" has negative connotations. However,
the huge current account deficit necessarily goes hand-in-hand with a
capital account surplus of equal size; and "surplus" is a word with
positive connotations. A writer desiring to paint a rosier picture
could therefore choose to highlight the huge US capital account surplus.
Both writers -- the one citing the current account deficit as a problem
and the one citing the capital account surplus as a benefit -- would,
however, be missing an important point. The point is that neither a
deficit nor a surplus on the current account (or the associated capital
account) is, in itself, a positive or a negative. It all depends on
what caused the deficit/surplus to arise.
To explain what we mean, we'll start with the popular argument that the
large US current account deficit is a problem because it involves the
US becoming increasingly indebted to the rest of the world. As Morgan
Stanley's Stephen Roach -- a high profile worrier about global
trade/investment imbalances -- is fond of saying: US$3.5B of foreign
capital is needed each and every business day to finance the US current
account deficit. According to Mr. Roach, the US will eventually run
into the problem of being unable to finance its current account
deficit, resulting in a collapse of the dollar's exchange value, a
sharp rise in US interest rates and a plunge in US economic growth.
From his perspective the trade/capital imbalance must be 'fixed' before
it's too late.
But any thesis that begins with the notion that the large US
trade/capital imbalance is a problem for which a solution must be found
will be hopelessly flawed because the aforementioned imbalance is NOT a
problem; rather, it is either the SYMPTOM of a problem or it is not
indicative of any problem whatsoever. And in the former case, an
economist who focused on reducing the imbalance would be akin to a
doctor with a feverish patient who directed his attention toward
cooling the patient down without taking into account WHY the patient
was unusually warm.
We suspect that a lot of the confusion surrounding this issue stems
from thinking about the US as an entity that runs a deficit on the
current account and an offsetting surplus on the capital account. In
practice, there is no such entity. Instead, what we have are billions
of people throughout the world who are trading and investing with each
other. When the effects of all these financial transactions are
netted-out we find that the subset of the world's population that
resides inside the US buys more 'stuff' from outsiders than it sells to
outsiders; while the subset of the world's population that resides
outside the US invests more money in US assets/debt than the US-based
subset invests in foreign assets/debt.
The point is that the so-called trade/capital imbalance is the net
effect of millions upon millions of individual decisions made
voluntarily by people who believe that they will be better off as a
result of their decisions. As such, an entity known as 'the US' does
not have to come up with $3.5B of new capital each business day in
order to 'finance' a deficit on its current account. Rather, this
out-flow on the current account is simply the net result of
transactions that could not have occurred in the first place unless
there were sufficient external demand for dollars. It is therefore not
reasonable to conclude that a large deficit on the current account is a
problem, or is indicative of a problem, simply because it happens to
exist.
To know if a current account deficit is indicative of a problem you
first need to know WHY the deficit exists. In the US case, for
instance, you need to know why people inside the US are generally
finding it advantageous to buy more stuff from foreigners than they
sell to foreigners, and why foreigners are generally finding it
advantageous to do the opposite.
As discussed in previous TSI commentaries, our view is that the US's
trade/capital imbalance has grown to such a tremendous size due to the
relatively rapid rate at which its currency supply has expanded over
the past ten years. In other words, we view the deficit on the current
account as a SYMPTOM of an inflation problem (inflation is the cause,
the huge current account deficit is one of the effects).
Inflation, we believe, has resulted in misdirected investment, reduced
productivity and higher production costs within the US. At the same
time, the normal effects on the prices of everyday items of a prolonged
period of inflation have been masked by the massive increase in labour
productivity within the emerging economies of the world (China and
India, in particular). And the upward pressures on interest rates that
would normally result from years of relatively high inflation have been
largely absent due to a) the aforementioned masking of price increases,
b) the large-scale purchasing of US debt securities by foreign central
banks, and c) arbitrage related to Japan's near-zero interest rates.
Lastly, high money supply growth combined with hardly any of the most
visible NEGATIVE effects of inflation has helped maintain the illusion
that the US economy is structurally sound, thus boosting foreign
private-sector demand for the US dollar.
Obviously, if the US current account deficit is the result of an
inflation problem then the only viable solution is to reduce the rate
of inflation. However, it seems that everyone wants to focus on the
symptom and no one wants to deal with the disease.
The Stock Market
The stock market and inflation
Growing the supply of money cannot create sustainable prosperity.
However, stock markets can be -- and often are -- given a boost by
money supply growth (inflation).
Using the performance of the Zimbabwe stock market as an example, an article at http://www.mises.org/story/2532 provides a succinct explanation of how inflation can simultaneously harm the economy and elevate equity prices.
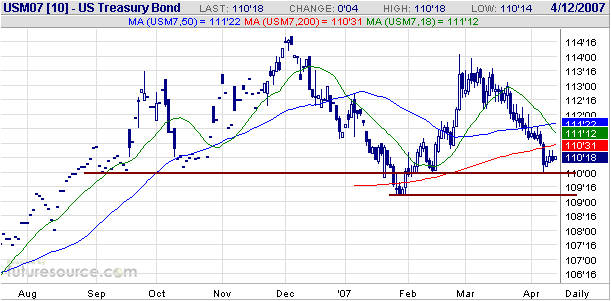
Stocks and Bonds
In the 2nd April Weekly Market Update we said that the two biggest
near-term threats to the stock market were the potential for the Iran
conflict to escalate and the risk of a sharp downturn in the bond
market. The first of these threats has dissipated, as was always likely
to be the case, but the other threat remains.
A quick look at the following chart will tell you that June T-Bond
futures are presently 'oversold' on a short-term basis. They have just
tested strong support at 110 and SHOULD begin to rally from here, even
if the rally is just a counter-trend rebound within an
intermediate-term decline. However, given that speculators, as a group,
are heavily net-long the bond market (via T-Bond and T-Note futures)
and that the sharpest declines often occur after a market has already
become oversold, the potential exists for bonds to drag stocks down.
Current Market Situation
The US stock market supposedly fell on Wednesday due to fears --
sparked by the release of the latest FOMC meeting minutes -- that
interest rates were going to remain at current 'elevated' levels for
longer than previously expected. We say "supposedly" because bond
futures and Fed Funds Rate futures barely moved at all in response to
the aforementioned meeting minutes. The lack of movement in the debt
market tells us that interest rate expectations didn't actually change
on Wednesday.
Wednesday's price action can probably be explained by the equity market
being 'overbought' and the bond market being 'oversold' prior to the
start of the session. As a result, equity traders were most likely
looking for an excuse to book some profits whereas bond traders were
prepared to 'dig in'.
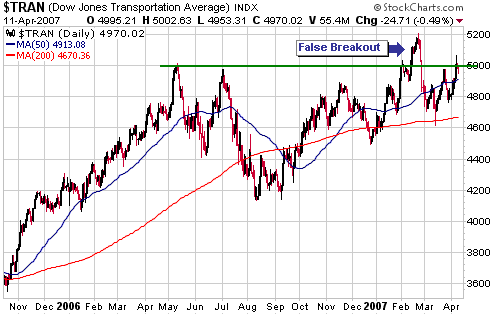
Over the next few weeks we will pay more than the usual amount of
attention to the Dow Transportation Average (see chart below). The
Transportation Average broke above resistance at 5000 in mid February
only to quickly reverse course and plunge below this level, thus
creating the appearance of a false breakout. It has since partially
recovered, but remains below 5000.
A sustained move above 5000, and especially above 5200, would be a
positive omen for the US stock market and the intermediate-term outlook
for global growth. On the other hand, a move below 4600 would have
decidedly bearish implications.
Gold and
the Dollar
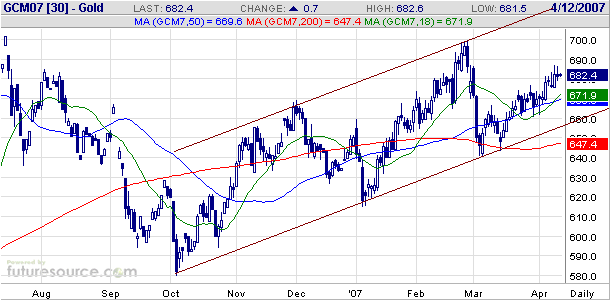
Gold
With reference to the following chart of June gold futures, gold is
slowly working its way higher within the confines of a well-defined
channel. If the gold price had broken below the bottom of this channel
during the February-March correction it wouldn't have caused us much
concern, but a break below the channel bottom at some point over the
next few weeks would force us to downgrade our short-term outlook.
As things currently stand, we remain short-term bullish in anticipation of further gains over the coming month or so.
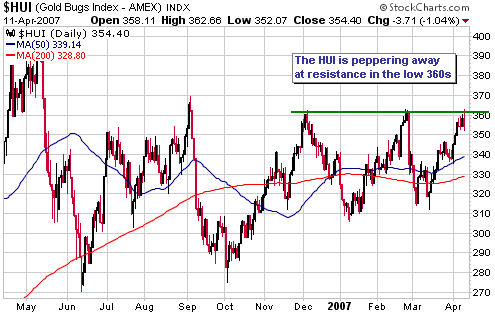
Gold Stocks
The more times a support or resistance level is tested the weaker it
becomes and, as a consequence, the higher the probability of a
breakout. As clearly evident on the following chart of the AMEX Gold
BUGS Index (HUI), resistance in the low-360s has now been tested three
times over the past four months. This resistance will have been
weakened by the multiple tests and is therefore likely to be breached
-- either immediately or following a short pullback.
Assuming that the HUI breaks above the aforementioned resistance at
some point over the next few weeks, the monetary backdrop will
determine what happens thereafter. An upside breakout could lead to a
multi-month advance to well above the May-2006 peak OR a successful
test of the May-2006 peak (a major 'double top').
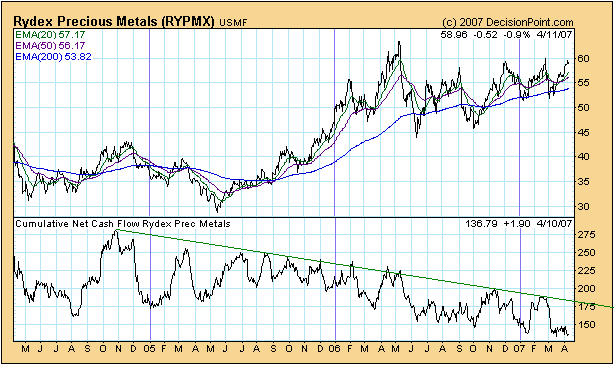
Although the gold
stock indices are near their highs of the past 10 months, the following
chart shows that the cumulative net cash flow into the Rydex Precious
Metals Fund (RydexPM) is still languishing near the multi-year low
reached in early March. The amount of money invested in RydexPM is in a
long-term decline, but even so we expect that this indicator will
experience a decent bounce -- perhaps to around $175M -- prior to the
start of the next significant correction in the gold sector.
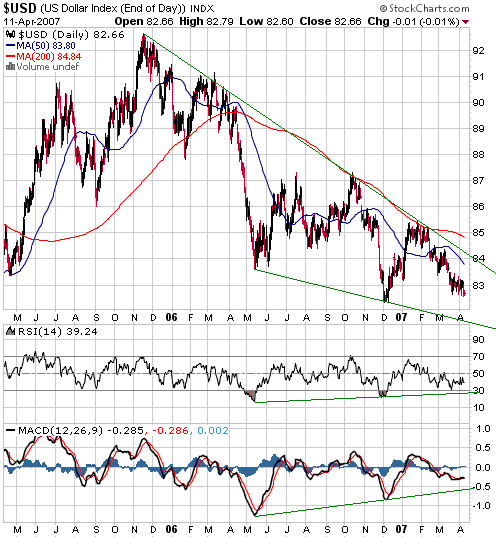
Currency Market Update
The following chart of the Dollar Index reveals a potential positive
divergence in the making in that lower lows in the dollar are being
accompanied by rising lows in two momentum indicators (the RSI and the
MACD). Ideally, as far as our short- and intermediate-term outlooks are
concerned, the Dollar Index will drop below its December-2006 low
within the next few weeks while the RSI and the MACD remain above their
respective December-2006 lows. This would set the stage for the
multi-month dollar advance we are anticipating.
Update
on Stock Selections
(Note: To review the complete list of current TSI stock selections, logon at http://www.speculative-investor.com/new/market_logon.asp
and then click on "Stock Selections" in the menu. When at the Stock
Selections page, click on a stock's symbol to bring-up an archive of our comments on the stock in question)
 Stockbrokers Stockbrokers
In the past we've suggested Boston-based StockCross Barry Murphy (SBM)
as a brokerage option for non-Canadians interested in trading the
Canadian resource stocks. During 2003-2006 SBM provided a good low-cost
service, but based on reports received from some of our subscribers as
well as our own recent experience it is clear that this broker's level
of service has deteriorated of late. We will continue to direct a small
portion of our personal business SBM's way, but will remove them from
the list of brokerage suggestions included in Note (10) at the bottom
of the TSI Stock Selections page.
We continue to like the service provided by interactivebrokers.com
(IB), a US-based on-line broker that provides direct access to the
Canadian stock exchanges and the stock exchanges of several other
countries. However, as far as we know it is not possible to trade
Canadian warrants via IB (it is possible to trade the Canadian warrants
via SBM and, of course, via any Canada-based brokerage).
If any subscriber knows of an on-line US broker that enables its
customers to trade Canadian warrants directly on the Canadian stock
exchanges -- as opposed to via the dreaded US OTC markets such as the
Pink Sheets -- then please drop us a line and we'll pass the info on to
the rest of the TSI readership.
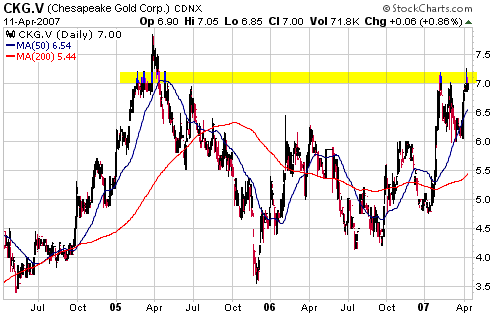
Chesapeake Gold (TSXV: CKG). Shares: 29M issued, 43M fully diluted. Recent price: C$7.00
CKG made its way into the TSI Stocks List through the backdoor in that
we received CKG shares, warrants and Class A shares when the merger
between AAU (American Gold Capital) and CKG was completed in February.
Prior to its merger with AAU, CKG had plenty of cash, good management,
an excellent exploration team, and several interesting early-stage
projects. It didn't offer much leverage to the gold price, though,
because the stock's upside potential was almost entirely associated
with the proven ability of its exploration team to discover valuable
mineral deposits. But with the acquisition of AAU's large low-grade
gold deposits -- the Metates property in Mexico with its non-compliant
low-grade resource containing 11.7M ounces of gold and 55M ounces of
silver, and the Talapoosa project in Nevada with its
measured-and-indicated resource containing 1M ounces of gold and 14.5M
ounces of silver -- CKG now has substantial gold-price leverage to go
with its other pluses.
In all likelihood CKG will become a core long-term holding for us.
From a technical perspective (see chart below), the stock is
challenging intermediate-term resistance in the low-C$7 area. Breaking
above this resistance would suggest that it was on its way to $10,
while the short-term downside risk is probably limited to a re-test of
support at C$6.00.
The ideal place to buy would be in the low-C$6 area, but there's
certainly no assurance that it will trade that low again. Anyone who
doesn't yet have any exposure to this stock might therefore consider
taking an initial position near the current price with the goal of
averaging-into a full position on pullbacks over the coming 12 months.
The CKG warrants
(CKG.WT) issued to the former owners of AAU shares began to trade on
the TSXV on Tuesday. The warrants have an exercise price of C$8.00 and
an expiry date of February-2012.
When warrants issued as part of a private placement or a takeover first
begin to trade they will often be priced at a significant discount to
fair value because supply will initially overwhelm demand, but if
anything the CKG warrants have commenced trading at a slight premium to
fair value (with the stock at C$7.00 we think the warrants are worth
around C$2.70, versus Wednesday's closing price of C$3.11). At current
prices we'd therefore prefer the stock to the warrants, although if we
already owned the warrants we would not contemplate selling them at
this time.
Now that the warrants received in exchange for our AAU shares have
begun to trade we will add them to the TSI Stocks List. We have
calculated our initial cost for these warrants to be C$1.54 by assuming
that the warrants have one-tenth the value of the Class A shares (each
Class A share can be converted into 10 common shares whereas each
warrant can be converted into a single share). Specifically, with
C$2.25 being our original cost for AAU and with C$5.45 being the price
assumed for our original cost of CKG shares (as explained in the 28th
February Interim Update), the formula for calculation of our original
purchase cost of the warrants and Class A shares is as follows:
0.29*5.45 + 0.029*A + 0.145*W = 2.25, where A is the value of a Class A share and W is the value of a warrant.
If we assume that A = 10W then the above equation can be solved to determine the value of W.
At this stage it looks like the Class A shares will not be listed on a
stock exchange. If this proves to be the case then the value of the
Class A shares will increase because they will become convertible into
a slightly higher number of CKG shares. In this situation, however,
holders will not have the convenience of being able to trade them and
it will not make sense for us to add them to the TSI Stocks List.
If the Class A shares are not listed then it will simply be a matter of
holding them until the gold price trades at an average of at least
US$850 for a 90-day period, after which they could be converted into
CKG shares at no cost.
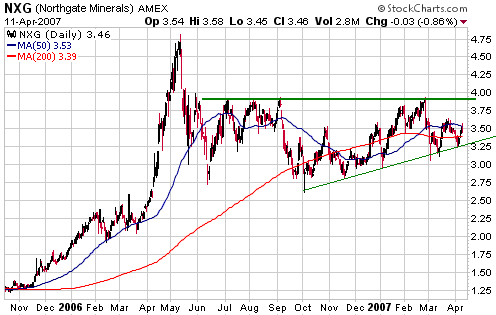
Northgate Minerals (AMEX: NXG). Shares: 254M issued, 259M fully diluted. Recent price: US$3.46
We are going to add gold/copper producer NXG to the TSI Stocks List as a trade with an anticipated hold period of 1-2 months.
NXG is expected to produce 285K ounces of gold and 75M pounds of copper
this year. It is currently trading at only 7.2-times last year's
earnings and has about US$260M (US$1/share) of cash in the bank. On the
negative side of the ledger, about 60,000 ounces of low-priced gold
forward sales contracts remain outstanding from an ill-conceived
hedging program undertaken in 2003. It has also forward-sold almost
half of this year's copper production, but we view this as neutral
because we don't expect copper's average price during 2007 to be
significantly more than the US$3.15/pound exercise price on these
hedges.
With reference to the following chart, the stock appears to be
completing a lengthy basing pattern. It is in anticipation of an upside
breakout from this base within the coming month or so that we are
adding NXG to the List. A break above the top of the base (US$3.90)
would project a move to around US$5.00.
We plan to keep this trade on a fairly short leash because both the
copper market and the stock market are presently 'overbought'. We have
therefore placed an initial protective stop at US$3.23 (we will exit
NXG if it CLOSES at 3.23 or lower).
Chesapeake Energy April-2007 $32.50 Call Options
The natural gas price appears to be headed higher in the short-term, so
Chesapeake Energy (NYSE: CHK) stands a good chance of continuing its
recent rally as long as the broad stock market doesn't tank. However,
we've run out of time as far as our CHK April call options are
concerned.
In the 28th March Interim Update we said "...an
opportunity to salvage something [from our CHK call option position]
could still arise prior to the 20th April expiry date. Any move into
the $33-$34 range would represent such an opportunity." The
stock has traded in this range over the past two days, giving us the
opportunity -- which we have taken -- to salvage about half of our
initial purchase cost.
Chart Sources
Charts appearing in today's commentary
are courtesy of:
http://stockcharts.com/index.html
http://www.futuresource.com/
http://www.decisionpoint.com/

|