|
- Interim Update 11th June 2003
Will higher
money supply growth help?
Gold market commentator and veteran
trader Jim Sinclair recently wrote some comments on inflation/deflation
that a few of our subscribers asked us to respond to since Mr Sinclair's
thoughts differ so markedly from our own. In a nutshell, Mr Sinclair believes
that the Fed needs to facilitate much faster money-supply growth in order
to prevent a deflationary outcome and 1930s-style depression. To support
his view he uses charts of money-supply growth and 'money velocity', where
the velocity of money is calculated by dividing the GDP growth rate by
the M2 growth rate. Here's our response.
Firstly, dividing the money-supply
growth rate into the GDP growth rate tells you nothing about the velocity
of money. All it tells you is how much effect money-supply growth is having
on GDP growth. For example, M2 money supply has expanded by 16.8% over
the past 2 years (an 8%/year compound growth rate), but this high rate
of money-supply growth has had only a modest impact on real GDP growth.
Hence, the sharp drop in the GDP/M2 ratio that Mr Sinclair is concerned
about (see chart below). This doesn't mean that the velocity of money has
been low over the past 2 years, but it does indicate that money is being
spent in a way that does not give a significant boost to GDP.
Further to the above, rather than interpreting
the fall in the GDP/M2 ratio as a signal that we need even higher money-supply
growth a more logical line of thinking would be as follows: The 16.8% increase
in M2 money-supply over the past 2 years has had only a minimal effect
on economic growth, so the problem clearly isn't a lack of money. Higher
money-supply growth is therefore not likely to make things better.
By the way, there is a positive correlation
between money-supply growth and economic growth, but the correlation is
based on real (inflation-adjusted) M2 growth. That is, an increase in the
money supply only boosts GDP growth to the extent that it does NOT boost
prices. Increases in the money supply that cause goods and services prices
to increase are NEGATIVELY correlated with real economic growth.
Secondly, sustainable economic expansions
are based on savings and production, not on debt and spending. One of the
biggest problems facing the US at this time is that the savings rate is
extremely low. Unfortunately, those who advocate monetary stimulation and
other measures designed to increase the velocity of money are, in effect,
advocating policies that will decrease the savings rate even further and
thus DELAY the time when a sustainable economic expansion can begin. The
thing that must happen now is that individual balance sheets get repaired.
This is always painful in the short-term, but is absolutely necessary.
As an aside, a high savings rate alone
is not enough to bring about an economic expansion. For example, the Japanese
have had a high savings rate for the past decade, but economic growth has
been slow. One of the problems in Japan is that a lot of the public's savings
have been loaned to the Government and used unproductively as part of the
Government's absurd Keynesian attempts to stimulate growth by spending
huge sums on public works projects.
Thirdly and most importantly, Mr Sinclair
is making the same mistake that many other commentators are making. Deflation
isn't the problem. It wasn't the problem in the 1930s and it is not the
problem now. The problem in the 1930s, and the problem now, is that there
was a massive asset price bubble fed by an even more massive credit bubble.
Once you have allowed a massive credit bubble to form there is no 'inflating
your way out of trouble'. The US money supply has expanded at a rapid rate
over the past 2 years and all that has been achieved is that an even bigger
problem has been pushed into the future. Read the interview with 89 year-old
investment legend Seth Glickenhaus in this week's Barrons magazine, because
he says it better than we do. To paraphrase Mr Glickenhaus, all the Fed
does when it tries to inflate its way out of the mess it helped create
is cannibalise the future. It seems as though Mr Sinclair and the others
who are clamouring for higher money-supply growth want the Fed to cannibalise
the future at an even faster rate.
Lastly, Mr Sinclair warns of the dangers
of 'allowing' the US stock market to drop below last October's lows. However,
all markets are mean reverting and over the long-term the stock market
oscillates between levels of over-valuation and under-valuation. Furthermore,
once it reaches one extreme and reverses course it continues in the new
direction until the opposite extreme is reached. The greater the level
of under- or over-valuation reached during any cycle, the further the market
must move in the opposite direction once the mean-reversion process gets
underway. There are no instances in history where a government, or anyone
else, has been able to prevent an over-valued stock market from following
this mean-reversion process through to its logical conclusion, although
governments often try. When they try, all that happens is that the bear
market turns out to be longer than it would otherwise have been and each
hope-rekindling bear-market rally sucks in more of the public's money.
As such, the public ultimately loses more money as a result of government
attempts to support an over-valued market, including the attempts to indirectly
support the market by increasing the supply of money.
The US
Stock Market
The VIX
The OEX Volatility Index (VIX), a measure
of the expected future volatility of the stock market, has been one of
the most reliable indicators of medium-term peaks and troughs in the stock
market over the past several years. This doesn't mean it will necessarily
stay reliable, but because it is calculated based on what traders are actually
doing with their money, rather than what they are saying, it probably will
continue to be a useful indicator.
The usefulness of the VIX as an indicator
of medium-term market extremes is illustrated in the below chart. The chart
compares the VIX with the S&P500 Index since the beginning of 1999,
with blue lines on the chart marking the times when the VIX dropped to
a cycle low. Note that whenever a downward-trending VIX moved to the low-20s
it turned out to be a good, and sometimes great, medium-term selling opportunity
in the stock market. In other words, if you had always sold after the VIX
fell to around the 21 level you would invariably have been able to buy
back at a significantly lower price within the ensuing few months.
Earlier in today's commentary we mentioned
that over the long-term the stock market cycles between levels of under-valuation
and over-valuation. The stock market also cycles in the intermediate- and
short-terms, but the shorter-term oscillations (weeks or months rather
than years or decades) are generally not determined by valuation. They
are, instead, determined by such things as market sentiment and how far
the market has already moved in one direction. For example, a market that
has been rising constantly for several weeks is likely to experience a
pullback simply because prices have become high enough to invite profit-taking
and discourage new buying. Furthermore, when a market continues in one
direction for an extended period it reaches a point where buying or selling
becomes exhausted.
The propensity of the market to oscillate
in the medium-term is shown quite neatly in the above chart of the VIX.
Regardless of whether the major trend in the market is up or down, the
VIX will oscillate between extremes as traders first become overly complacent
and subsequently become very fearful. When they are overly complacent they
will tend to expect relatively low volatility in the future and when they
are fearful they will tend to anticipate relatively high volatility in
the future. Since the majority is always wrong once it becomes totally
convinced of something, a very low value for the VIX usually means that
volatility is actually going to be HIGHER in the future.
Right now, the VIX is in the low-20s
and it has been in the low-20s for the past few weeks. In fact, when the
VIX first fell to 21 a few weeks ago the S&P500 Index was about 60
points lower than where it is today. However, based on the VIX's record
over many years it is very likely that someone who sold when the VIX first
fell to 21 is going to be able to buy back at a significantly lower level
within the next few months.
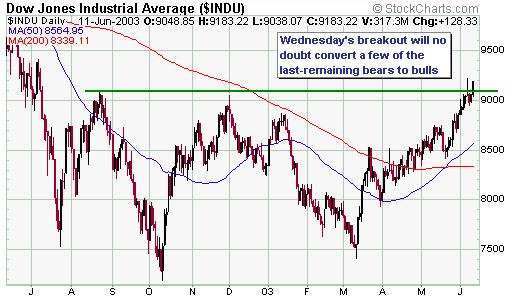
Current Market Situation
On Wednesday the Dow Industrials became
the last of the major stock indices to close above its August-2002 peak
(see chart below). This event is certainly going to add to the rampantly
bullish sentiment that already exists.
When a market moves in one direction
for an extended period sentiment always becomes lopsided, and the current
situation is no exception. For instance, the results of the latest Investors'
Intelligence sentiment survey show that the percentage of newsletter writers
who are currently bearish has just reached its lowest level since 10th
April 1987. In 1987 the market continued higher for more than 4 months
after the number of bears had shrunk to such a low level, so this extreme
reading alone certainly doesn't mean that we are now at a major peak. However,
when considered alongside the VIX, put/call ratios and other indicators
it strongly suggests that the downside risk in the market is very high.
Given that the NDX/Dow ratio has only
just peaked (see discussion in the latest Weekly Update) we think the Dow
and the S&P500 probably will move to new recovery highs following a
pullback over the next few weeks, but the upside potential from current
levels looks minimal.
Gold and
the Dollar
Gold
From Market Alert #120, e-mailed to
subscribers after the close of trading on Monday: "Monday's market action
was slightly bearish for gold and slightly bullish for the US$. In recent
commentaries we've mentioned that we would consider a daily close in the
gold price below its 18-day moving average to be a preliminary warning
sign that gold had reached a short-term peak and that the Dollar Index
had reached a short-term bottom. August gold closed below its 18-day moving
average on Monday."
Gold followed up Monday's mini breakdown
by dropping sharply on Tuesday and then bouncing modestly on Wednesday.
If the gold price didn't reach a short-term bottom when it traded down
to the low-350s on Tuesday then the most likely place for a bottom to occur
would be in the $340-$345 range.
The euro gold price has dropped back
to near the bottom of its long-term channel, so strength in gold relative
to the euro is likely in the short-term.
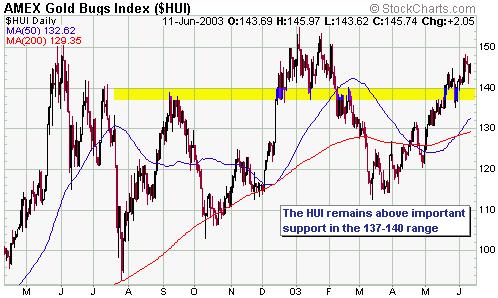
Gold Stocks
There is currently no sign that this
week's break below short-term support by the gold price has resulted in
anything more significant than a pullback within a continuing uptrend.
In particular, gold stocks, as represented by the Amex Gold BUGS Index
(HUI), remain comfortably above important support in the 137-140 range
(see chart below). As long as the HUI doesn't close below 137 it is reasonable
to assume that the rallies in gold and gold stocks that began in March
and April, respectively, are intact. A move below 137 would, however, suggest
to us that the rallies had ended and that what we've described as "scenario
b" (gold stocks dropping below their March lows before embarking on a multi-year
advance) had become the most likely outcome.
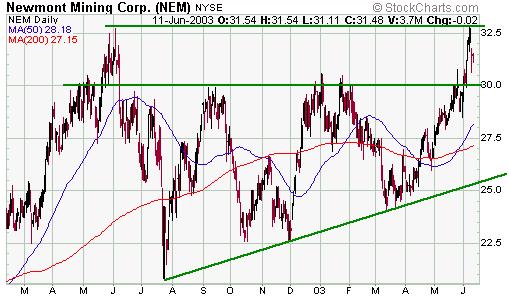
NEM recently bounced off resistance
defined by its May-2002 peak and is probably headed back to support (formerly
resistance) at around $30. Given NEM's top-class management, recent good
results, reasonable valuation and the excellent progress it has made over
the past 6 months with regard to eliminating its forward-sales book, we
think NEM is an attractive long-term investment at around $30. This is
particularly the case for those who are looking for relatively low-risk
exposure to the gold sector. However, we probably won't add a position
in NEM or in long-dated NEM call options to the Stocks List unless the
stock trades down to near the uptrend-line shown on the below chart.
We are currently working on a valuation
comparison of 16 major and mid-sized gold producers that will, if all goes
according to plan, be included in the next Weekly Market Update.
The Dollar
Freddie Mac (NYSE: FRE), the second
largest of the Government Sponsored Enterprises (GSEs) operating in the
mortgage market (click HERE for a profile of Freddie Mac http://biz.yahoo.com/p/f/fre.html),
has been the centre of attention so far this week. For those who haven't
seen or heard any financial market news over the past few days, the three
most senior executives of FRE were sacked on Monday due to concerns over
the company's accounting. Subsequent to the sackings the Securities and
Exchange Commission, the Office of Federal Housing Enterprise Oversight
and Federal prosecutors have all opened investigations into possible misconduct
at Freddie Mac. As a minimum, it seems likely that Freddie's revenue recognition
practices were flawed in that revenue was being recognised each quarter
in a way that would smooth results rather than in a way that would accurately
reflect what was actually happening with the business.
At this stage Freddie's recent tribulations
have only caused a problem for its own shareholders and, to a much lesser
extent, the shareholders of other GSEs. The overall stock market and the
currency market have not yet been affected to any significant degree. However,
this is potentially a much more important issue than the latest market
action suggests, partly because the GSEs continue to play a crucial role
in perpetuating the US credit bubble. In fact, over the past few years
the great US credit expansion has hinged on the ability of the GSEs to
borrow money at relatively low rates and to grow their balance sheets ad
infinitum. Another reason that this week's news might evolve into a market-moving
issue is the large volume of agency securities (the debt issued by Freddie
Mac and the other GSEs) owned by foreign investors (foreign investors apparently
own about one-third of all US agency debt).
Note that when we discuss the GSEs
we are talking about companies that are bigger, in terms of assets and
liabilities, than the average country. For example, during the first quarter
of this year alone the GSEs issued about $345B of debt, about $70B of which
was issued by Freddie Mac. Furthermore, as at the end of April Freddie
Mac's total mortgage portfolio (its investment portfolio plus the mortgage-backed
securities it guarantees) was valued at 1.3 TRILLION dollars.
This brings us to our point. One of
the big risks for the US is that this week's Freddie Mac troubles will
cause foreign investors to lose confidence in agency debt and to therefore
reduce the rate at which they purchase this debt. The Federal Reserve could
certainly pick up the slack resulting from a reduction in foreign buying,
thus preventing mortgage interest rates from rising, but any significant
reduction in foreign investment demand for US agency debt would hit the
US$. No wonder both President Bush and Treasury Secretary Snow have, over
the past 3 days, publicly expressed their support for a strong dollar.
The latest news might also be viewed
by foreign investors as a case of "here we go again", with yet another
large-cap high-profile US corporation having been found to be 'cooking
the books'. If nothing else, Freddie Mac's situation suggests that there
are more skeletons to be found in the US corporate closet.
Current Market Situation
As noted above, the Freddie Mac news
hasn't yet had a noticeable effect on the currency market. As the following
chart shows, the Swiss Franc was in a short-term downtrend before the 'news'
and is still in a short-term downtrend.
Below is a weekly chart of the silver
price. Silver has near-term downside risk to around $4.35, but given the
monetary backdrop we expect that this support will hold.
Update
on Stock Selections
 Gold
Fields (NYSE: GFI) is not one of our current selections, but we thought
we'd mention this week's news that GFI and Mvela Resources have done an
empowerment deal. Mvela is buying a 15% stake in GFI's South African operations
for around US$500M (cash). The price looks a little low, but we think this
deal is positive for GFI because it allows the company to comply with black
empowerment regulations and removes the need for them to do any other financing
(speculation that GFI was going to raise money via an equity issue has
been weighing on the stock price for a long time). Gold
Fields (NYSE: GFI) is not one of our current selections, but we thought
we'd mention this week's news that GFI and Mvela Resources have done an
empowerment deal. Mvela is buying a 15% stake in GFI's South African operations
for around US$500M (cash). The price looks a little low, but we think this
deal is positive for GFI because it allows the company to comply with black
empowerment regulations and removes the need for them to do any other financing
(speculation that GFI was going to raise money via an equity issue has
been weighing on the stock price for a long time).
Our
Desert Sun Mining (TSXV: DSM) has begun trading on the Berlin Stock Exchange
under the symbol DRT. DSM has once again dropped back to C$0.82, a good
entry level for this stock.
Chart Sources
Charts appearing in today's commentary
are courtesy of:
http://stockcharts.com/index.html
http://www.futuresource.com/
http://www.economagic.com/

|
