![]()
![]()
![]()
![]()
- Interim Update 11th July 2018
Copyright
Reminder
The commentaries that appear at TSI
may not be distributed, in full or in part, without our written permission.
In particular, please note that the posting of extracts from TSI commentaries
at other web sites or providing links to TSI commentaries at other web
sites (for example, at discussion boards) without our written permission
is prohibited.
We reserve the right to immediately
terminate the subscription of any TSI subscriber who distributes the TSI
commentaries without our written permission.
The copper unwinding
Four weeks ago, speculators in
Comex copper futures collectively held their largest net-long position in
history. When the copper price began to decline this massive speculative
bet started being unwound, which exacerbated the price weakness and
prompted more speculative selling. In other words, due to the immense size
of the speculative net-long position the price decline temporarily became
self-reinforcing. By last Tuesday (the date of the latest COT data) the
speculative net-long position on the Comex had dropped to near an 11-month
low, meaning that bullish speculators in Comex futures no longer posed a
substantial threat. However, the Financial Times article posted
HERE points out that another threat was lurking in the background.
The other threat was a large speculative net-long position in copper
futures on the Shanghai Exchange. It seems that about three-quarters of
this Chinese position was rapidly sold after the copper price had been
driven down to the mid-$2.90s by the liquidation of speculative long
positions on the Comex. This explains the 3-day plunge from seemingly
strong support at around $2.95 to last Friday's low of $2.78.
Here's an excerpt from the above-linked article:
"The
liquidation of a $1bn bet placed by a Chinese investor has roiled the
copper market, triggering a violent sell-off that has seen the metal
plunge to a 12-month low.
Data released by the Shanghai Futures
Exchange showed the huge futures position held at Gelin Dahua, a
Beijing-based brokerage, had fallen from a net long of 36,050 lots last
Wednesday to only about 10,000 lots yesterday.
That is the
equivalent of 130,000 tonnes of copper, worth roughly $800m, being
liquidated over the past four trading sessions.
Since last August,
Gelin has been the dominant buyer of copper, stepping into the market to
buy metal whenever the price weakened, according to Nicholas Snowdon,
analyst at Deutsche Bank. "There was in other words a perceived Gelin put
in the copper market in the first half of 2018," said Mr Snowdon. "This
now appears to be dissipating fast.""
Given copper's
performance after the close of this Tuesday's Comex trading session, with
the price plunging from a Tuesday close of $2.84 to as low as $2.72 during
Asian trading on Wednesday, it's likely that the balance of the
speculative Chinese position discussed in the above-linked article has
been liquidated. This could mean that the path is now clear for the
rebound to the mid-$2.90s mentioned in the latest Weekly Update, although
an important support level was breached during the
late-Tuesday/early-Wednesday sell-off and there was no recovery later on
Wednesday.
The copper market is now extremely 'oversold' on a short-term basis,
but it is in the midst of a self-reinforcing decline driven by emotion and
could fall further over the days ahead. Support near $2.50 remains the
most likely place for a sustainable low, with or without an intervening
rebound.
No currency
manipulation by China's government, yet
In the 2nd July Weekly Update we
discussed the risk posed by the recent weakening of China's currency (the
Yuan), and commented: "We won't know for sure until China's central
bank publishes its international currency reserve figure for June, but the
recent weakening of the Yuan does not appear to be the result of a
deliberate move by China's government." We now know for sure -- the
Yuan's pronounced weakness during the month of June was NOT the result of
government manipulation. In fact, it can be more aptly described as the
result of an absence of manipulation.
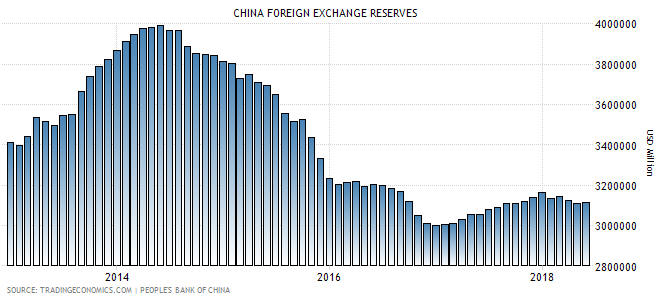
We know that this is so
because of what happened to China's currency reserves in June. As
indicated by the final column on the following chart, almost nothing
happened (there was no significant change). This means that China's
government made no attempt to either strengthen or weaken its currency
last month.
To further explain, for China's government to engineer weakness in the
Yuan's foreign exchange value it must add to its international currency
reserves by exchanging its own currency (that it creates 'out of thin
air') for foreign currency. By the same token, for China's government to
increase the Yuan's relative value it must use its international currency
reserves to purchase Yuan. Consequently, periods when China's currency
reserve is increasing are periods when China's government is attempting to
weaken the Yuan and periods when China's currency reserve is decreasing
are periods when China's government is attempting to strengthen the Yuan.
The above chart therefore tells us that China's government was
trying to weaken the Yuan up to mid-2014 and strengthen the Yuan from
mid-2014 until the end of 2016. The chart also seems to indicate that
there was a tentative attempt to weaken the Yuan during 2017, but 2017's
gradual increase in China's foreign currency stash was most likely driven
by changing market valuation. We are referring to the fact that because
reserves are reported in US dollars and held as debt securities, the
reported value of the reserves can be altered by a change in exchange
rates or bond prices. In particular, the reported reserve figure will have
an upward bias during periods when the US$ is weak relative to other major
currencies, as it was throughout 2017.
The bottom line is that
China's government has not yet weaponised the Yuan's FX value in its
economic war with the US government, but it is also not standing in the
way when the Yuan weakens in response to market forces.
The Stock Market
Further escalation in
the "trade war"
It was announced after the close of US
trading on Tuesday 10th July that the US government is ploughing ahead
with tariffs on an additional $200B of Chinese goods. This latest batch of
US tariffs is in retaliation to tariffs on US goods imposed by the Chinese
government in retaliation to the $34B of US tariffs that came into effect
at the end of last week. This would be funny if the economic consequences
weren't so seriously negative.
Chinese exports to the US amount to
about $500B per year whereas US exports to China amount to only about
$130B per year. Therefore, China's government cannot keep retaliating in
kind against US tariffs on a dollar for dollar basis. However, the sum of
US exports to China and local sales in China by US companies happens to be
about $500B per year, so China's government potentially could retaliate
dollar for dollar by making life more difficult and costly for US-owned
companies operating in China.
Strangely, the stock market doesn't
seem to care. Some industrial and agricultural commodity markets have
reacted in dramatically-negative fashion to the escalating economic war
between governments, but the US stock market has been acting as if it were
a safe haven. This can't last, especially in light of the relatively tight
monetary backdrop.
Current Market Situation
With regard to the long-term price prospects for equities and
commodities, the "trade war" is not close to being the biggest issue. Even
if it continues to escalate it will not be the biggest issue, despite the
fact that it will materially reduce economic progress and living
standards. The biggest issue is the damage that has been inflicted over
the past several years by central bank manipulation of interest rates and
money. Mal-investment stemming from monetary manipulation will be the root
cause of the next recession and/or financial-market crisis, but the "trade
war" could be the catalyst for a stock market reversal of at least
intermediate-term importance.
Up until now, investor/speculator
fear related to the "trade war" has been confined to a few commodity
markets and some peripheral stock markets. Prior to Wednesday of this week
the oil market was unscathed (the oil price dropped 5% on Wednesday) and
so were some of the most important US stock indices.
Among the
high-profile US stock indices, the Russell2000 SmallCap Index (RUT) and
the NASDAQ100 Index (NDX) have been the strongest. Investors (using the
term as loosely as possible) have been buying the stocks and ETFs
associated with these indices as if they were immune to the economic
weakness that would stem from the continuation of the international trade
conflict, seemingly oblivious to the reality that these stocks are, on
average, priced for perfection.
The aforementioned indices were
expected to make marginal new highs before reversing course. As
illustrated below, the RUT made a marginal new high and the NDX tested its
high on Tuesday before pulling back.
It is yet to be seen whether the pullbacks of the past two trading
days were meaningful reversals. However, the fact that pullbacks have
occurred following tests of the highs means that the risk associated with
new bearish speculations can be managed by placing stops slightly above
Tuesday's highs. For example, Tuesday's high for the NDX was 7298 and the
June high (the all-time high) was 7310, so it would be reasonable to buy
QID (UltraShort QQQ) now and risk a daily NDX close above, say, 7320. For
another example, Tuesday's all-time high for the RUT was 1709, so it would
be reasonable to buy TWM (UltraShort Russell2000) now and risk a daily RUT
close above, say, 1720.
Alternatively, speculators who are willing
to accept the risk of a larger loss in exchange for reducing the
probability of being 'whipsawed' could take a position in a leveraged
inverse ETF now and initially risk a WEEKLY close above this week's
intra-day high.
Protective stops can't be used effectively with
out-of-the-money options, though. With such options the risk management
must happen at the time of purchase, in that the amount of money put at
risk should be small enough that a total write-off would be easy to
handle.
Today we are adding a bearish option speculation to the TSI
List. The option is associated with IWM, an ETF that tracks the RUT.
Specifically, we are adding the IWM September-2018 $150 put option at
US$0.76, which is near the mid-point of Wednesday's closing bid-ask spread
(US$0.74-$0.77). This option is about 10% out of the money.
Gold and the Dollar
Gold and Silver
In the latest Weekly Update, we wrote:
"...last week the
US$ gold price spiked down to its December-2017 bottom and then rebounded
to end the week with a net gain of about one dollar. It's possible that
last week's downward spike to the December-2017 bottom will be the low for
the year, but that possibility is a long way from being confirmed. At this
stage all we have is a test of support followed by a minor rebound.
A typical counter-trend rebound would end below $1280, so to indicate
that a multi-month bottom is in place the price must achieve a solid break
above $1280. Failing to do so would keep alive the possibility that the
decline from the April high ($1370) is not complete."
This
week the US$ gold price didn't come close to breaking above $1280.
Instead, it spiked up to the high-$1260s on Monday and then reversed
course. It is now re-testing the December-2017 bottom.
If the
December-2017 bottom ($1238.30) is breached on a daily-closing basis then
a decline to the next area of strong support, which means a decline to the
$1200-$1215 range, will become likely. A decline of that magnitude within
the coming week or two potentially would turn the sentiment situation from
moderately supportive to very supportive and -- as long as the fundamental
backdrop remained gold-bullish -- set the stage for an intermediate-term
advance.
Regarding silver, in the latest Weekly Update we wrote:
"A
daily close above $16.30 would be a preliminary sign that the price has
turned upward on a sustainable basis, but to signal conclusively that a
meaningful rally is underway the market will have to end the pattern of
declining tops that is now almost 2 years old. To do so the silver price
will have to close above $17.30."
Over the first three days of
this week the silver market didn't even come close to generating a
preliminary sign that the price has turned upward on a sustainable basis.
Instead, the highest daily close was $16.14 on Monday 9th July, after
which there was a quick return to the early-July low. At the moment the
path of least resistance appears to be down.
If the early-July low
is breached then a test of the December-2017 low near $15.60 likely will
follow in short order. A decline to the December-2017 low or lower may be
required to finally establish a bullish sentiment backdrop in this market.
Gold Stocks
The Gold Miners ETF (GDX) ended
last week above its 50-day and 200-day MAs and near the top of its narrow
3-month price channel. As illustrated by the following daily chart it
spiked above its channel top on Monday of this week, but failed to close
above it. On Wednesday it plunged below its 50-day and 200-day MAs while
remaining within its narrow channel.
Wednesday's decline in the GDX price looks impressive on the above
chart, but that's only because the chart zooms in on a period of
unusually-low volatility. It takes a move of only 4% to get the price from
channel top to channel bottom or vice versa. Consequently, we are yet to
see the anticipated increase in volatility in the gold-mining sector.
As mentioned in a recent TSI commentary, we have a nagging concern
that there hasn't been a sharp decline or capitulation in the gold-mining
sector that 'clears the deck'. A capitulation is not a prerequisite for a
multi-month rally, but the fact that it hasn't happened creates the risk
that it is yet to come.
The Currency Market
The Dollar Index (DX) bounced off its 50-day MA early this week, but
this hasn't changed our expectation that it will drop to around 92 within
the next 2 months.
Updates on Stock Selections
Notes: 1) To review the complete list of current TSI stock selections, logon at
http://www.speculative-investor.com/new/market_logon.asp
and then click on "Stock Selections" in the menu. When at the Stock
Selections page, click on a stock's symbol to bring-up an archive of
our comments on the stock in question. 2) The Small Stock Watch List is
located at http://www.speculative-investor.com/new/smallstockwatch.html
Chart Sources
Charts appearing in today's commentary
are courtesy of:
http://stockcharts.com/index.html
https://tradingeconomics.com/
![]()