|
- 11 September, 2002
More thoughts
on the bond 'blow-off'
There is a tendency for people inside
the US and even for many people outside the US (including your editor)
to attribute the movements in the US financial markets to purely US-related
factors. However, in this inter-connected world where investment capital-flows
between countries dwarf trade-flows, external factors always have a significant
effect and sometimes these external factors can be the dominant influence.
In the Weekly Update we suggested that
the huge rally in the US bond market over the past few months may have
more to do with what is happening in Japan than in what is happening in
the US. Specifically, we said that bonds appeared to be experiencing the
type of speculative blow-off that often occurs during the final stage of
a secular bull market. In this case, Japan seems to be leading and other
markets are being taken along for the ride.
Below is a long-term (monthly) chart
showing Japanese Government Bond (JGB) futures. For those who like to count
waves, the JGBs appear to be in the 5th (final) wave of the bull market
that began in 1990. Speculative bubbles tend to get bigger and go on for
longer than most rational people expect, so there is no telling how high
this final wave will go. It will, however, be worth keeping a close eye
on the Japanese bond market since a major downturn in the US bond market
is probably not going to occur until after the JGBs have peaked.

The strange
world we live in
Compared to how inter-market relationships
'normally' work a lot of strange things have been happening over the past
6 months. As noted in prior commentaries it is extremely unusual, perhaps
even unprecedented, for a huge rally to happen in the bond market at the
same time that a huge rally is happening in the oil market. Oil prices
have certainly been given an artificial boost from Washington's warmongering,
but there is more to it than that. We expect the oil price to drop back
to the low-20s over the next few months, but the rally in oil that began
last November looks like the first leg in a new cyclical bull market, not
a correction within an on-going bear market. As such, we expect that any
pullback in the oil price over the coming months will be followed by another
rally that will take the price well beyond whatever peak is reached during
the current rally.
Driven largely by the 'energies' and
the 'grains', the CRB Index has moved up to near its Year 2000 peak. Interestingly,
this
rally has generated almost no enthusiasm. The stock market plummets for
several months and then bounces by a few percent and suddenly it seems
as though everyone is chattering about the start of a new bull market.
However, the CRB Index surges for several months to within 3% of a 4-year
high and hardly a word is said about it. Makes us think the commodity rally
is real and that when oil and the grains cool off other commodities (eg,
the base metals) might perk up. Once again, bond market strength is inconsistent
with the type of commodity market strength we've seen this year.
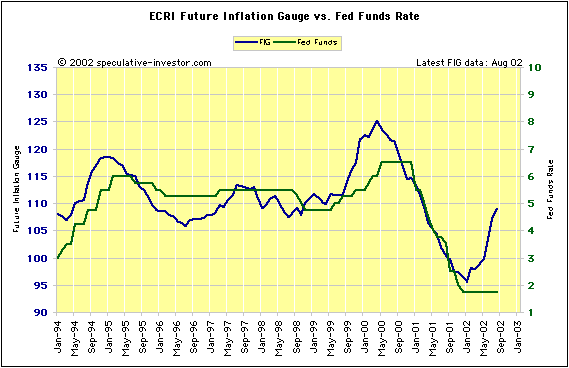
Below is a chart showing the ECRI's
Future Inflation Gauge (in blue) and the Fed Funds Rate target set by the
Fed (in green). The Future Inflation Gauge (FIG), which should actually
be called the Future CPI Gauge since it is designed to predict changes
in the CPI not changes in the inflation rate, has been an exceptionally
good leading indicator of the Fed Funds Rate since 1987 (the year that
Greenspan became Fed chairman). There has been a very sharp upturn in the
FIG since early this year. In fact, the FIG is now quite close to the levels
reached just prior to the start of the Fed's rate-hiking programs in 1994
and 1999. And yet, the main topic of debate amongst 'Fed watchers' is whether
or not the Fed will cut interest rates at the next FOMC meeting.
A strange world indeed!

The US
Stock Market
They're at it again!
Last week Japan's Nikkei225 Index dropped
below a triple bottom formed by the lows reached in September-2001, February-2002
and August-2002, thus confirming that the long-term bear market in Japanese
stocks is still alive and well. The break of the triple bottom not only
took the Nikkei to its lowest level in 19 years, it also suggested that
much lower levels will be plumbed before the bear market finally ends.
Politicians and central bankers look
at charts just like everyone else, so the significance of last week's breakdown
in the Nikkei would not have escaped the Japanese monetary authorities.
Predictably, their response to this latest breakdown has been the same
as it was on every other occasion over the past 10 years when something
similar happened - do something to artificially and temporarily prop-up
prices, thus prolonging the agony by pushing the ultimate bottom further
into the future.
At this stage the idea of pumping another
3 trillion Yen of taxpayers' money into the stock market has been floated,
but nothing has actually happened yet. It no doubt will happen, though,
and it will probably give the stock market a boost in the short-term. It
can't possibly have any beneficial effects in the long-term because all
that would be happening is that the ownership of some shares would be transferred
from private hands to the government.
One thing that has become readily apparent
over the past 12 months is that the efforts of the world's central banks
to boost stock prices and revive economic growth are having their greatest
effect on commodity prices. If the stock purchases currently being considered
by the Japanese Government are paid for by inflation (newly-printed Yen)
as opposed to higher taxation, then this latest 'stock market support scheme'
will probably have a similar effect. That is, it is more likely to add
some fuel to the incipient bull market in commodities than stem the bearish
tide in the stock market.
Current Market Situation
There is no change to our view that
the stock indices will move above their August highs before beginning their
next major decline. We recommended buying Dow put options in late August
and expect another opportunity to buy put options to present itself during
the next few weeks.
Gold and
the Dollar
Risky Business (some thoughts on
Barrick's hedge programme)
Dr Martin Murenbeeld recently published
a study in which he discusses the practice of hedging future gold production
in general and Barrick Gold's hedge programme in particular. The study
is titled "In Defense of Gold Hedging - The Case of Barrick" and anyone
interested in reading it can do so by going to http://www.mips1.net/MGGold.nsf/UNID/TWOD-5DV2QD
and downloading the document in pdf format.
As the title of the study suggests,
Dr Murenbeeld's conclusion is that the benefits of the gold hedging undertaken
by Barrick outweigh the costs. We would argue, however, that the jury is
still out on whether Barrick's hedging will benefit its shareholders in
the long-term. It certainly benefited them while gold was in a bear market,
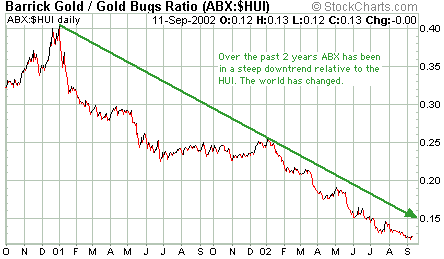
but the following chart showing the ratio of the Barrick Gold (ABX) stock
price and the Amex Gold BUGS Index (HUI) shows that they certainly haven't
benefited since gold began its bull market (we date the start of the gold
bull market at October/November 2000 when the US$ reached a long-term peak
against both the Swiss Franc and the euro and when most gold stocks made
long-term bottoms). The line on the chart rises when ABX is out-performing
the HUI.

Drawing conclusions about the merits
of an aggressive gold-hedging programme by looking at Barrick's performance
over the past 15 years, which is what Dr Murenbeeld does, makes as much
sense as drawing conclusions on the benefits of owning tech stocks by looking
at the NASDAQ's performance between 1995 and the first quarter of 2000.
The total picture can only be seen after the cycle is complete. Hedging
became extremely popular during the 1980s and 1990s because the gold price
was in a long-term downtrend. So far we've only seen the first stage of
the ensuing up-trend and the evidence to date indicates that the shareholders
of gold mining companies with large hedge books are going to fare quite
poorly, at least on a relative basis.
Although Dr Murenbeeld has attempted
to show Barrick's hedge programme in a positive light, he briefly touches
on two risks associated with the programme that, we think, are substantial.
In fact, having read Dr Murenbeeld's study we would now be even less
inclined to buy ABX than we already were (and that is really saying something).
Before we discuss these risks, it is important to understand that almost
all of Barrick's forward sales fall into the "spot deferred" category,
which means that Barrick has the option of rolling forward the contracts
rather than delivering into them. If, for example, Barrick's hedge programme
calls for 3M ounces of gold to be delivered at a price of $340 in 2003
and the spot gold price at the time of delivery is $400, Barrick can choose
to roll those contracts forward and sell the gold into the spot market.
In this way they supposedly have the best of both worlds - they have the
downside protection of a hedge book but have not limited their upside in
the short-term. These "spot deferred" contracts can be rolled forward for
up to 15 years.
One of the risks mentioned by Dr Murenbeeld
- one that he quickly dismisses as not being important - is included at
the bottom of page 16 of the study. Apparently, Barrick will not be able
to defer delivery into its forward-sales contracts if "the counterparties
are unable to acquire bullion in the open market or any organised exchange
or to fund any such acquisition". In other words, if Barrick's counterparties
(the bullion banks) are unable, for any reason, to borrow the gold needed
to facilitate the forward sales contracts, the contracts cannot be rolled
forward. So, if central banks decide to stop or cut back on their gold
lending, Barrick will probably not have the option of rolling forward its
contracts. This (central banks stopping or substantially curtailing their
gold lending), in our opinion, is something that has a very high probability
of happening within the next two years. In particular, as the US Dollar's
bear market becomes more widely recognised the central banks or Europe
will become less inclined to part with their gold.
The other risk worth noting is discussed
on page 19 of Dr Murenbeeld's study. If Barrick decides to defer delivery
on a particular contract, and assuming that Barrick's counterparties are
able to borrow enough gold to enable the deferral to proceed in the first
place (a big assumption), then the contract is re-priced based on the interest
rates at the time of deferral. The risk is, if the gold interest rate (lease
rate) happens to be higher than the US$ interest rate at that time then
the re-priced forward-sales contract will have an exercise price that is
less than both the previous contract price and the current spot price.
Forward prices for gold have, over
the past 9 years, always been higher than the spot price because gold interest
rates have always been lower than US$ interest rates. On this basis Dr
Murenbeeld concludes "it is therefore safe to assume that the contango
[the US$ interest rate minus the gold interest rate] will be positive on
re-pricing dates". This, in our view, is a very dangerous assumption.
If this gold bull market picks up steam and the major central banks figure
out that lending their gold for a piddling 1-2% per year return is what
we Australians would call a 'mugs game', then even if gold is available
to borrow it might only be available at a much higher interest rate.
The real problem for ABX shareholders
is that an accelerating up-trend in the gold price - something that should
be welcomed by a company in the business of mining gold - will probably
create the conditions under which Barrick's hedges cannot be rolled forward.
As such, the 'spot deferred' concept is likely to break down just when
it is most needed, that is, when the spot gold price has risen well above
the exercise price on the forward sales contracts.
Current Market Situation
At the present time the stock, gold
and currency markets are positioned in such a way that we should see at
least one of these markets breakout to the upside during the next few trading
sessions.
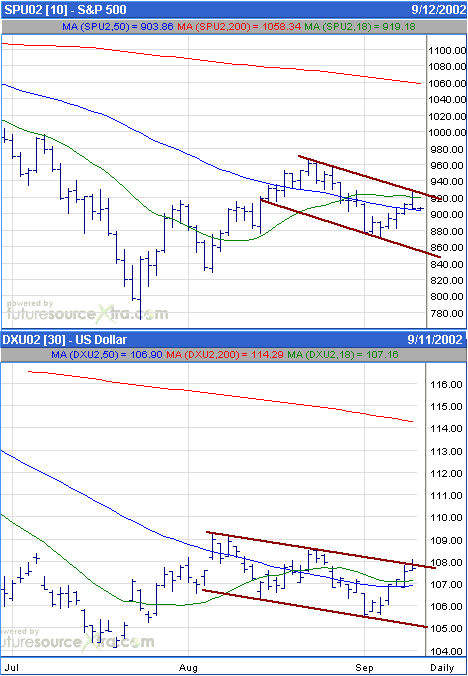
Below are short-term daily charts showing
the September S&P500 Index futures and the September Dollar Index futures.
Both the S&P500 and the Dollar have moved up to the top of their consolidation
ranges and are poised to breakout to the upside. During Wednesday's trading
session the Dollar looked like it was going to breakout, but if fell back
to close below the top of its short-term channel.

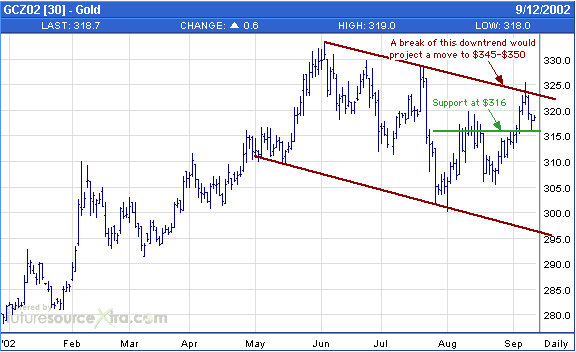
Below is a daily chart showing December
gold futures. The gold price pulled back after hitting the top of the downward-sloping
channel that began in May, but has thus far held above support at around
$316.

Our view is that the S&P500 Index
and the Dollar will move higher over the coming weeks as the gold price
pulls back. However, it would be a bearish development, at least as far
as the short-term is concerned, if the S&P500 and the Dollar are unable
to complete upside breakouts within the next few sessions. It would be
a correspondingly bullish development for gold if December gold futures
could achieve a daily close above the medium-term downtrend shown on the
above chart (a daily close above $324 would do it).
We hate to buy following upside breakouts,
but in gold's case we will make an exception. This is because an upside
breakout would project a move to around $345 before the next substantial
pullback would be likely to occur. A move of this magnitude would, in turn,
provide definitive technical evidence of something we already strongly
suspect - that a major bull market in gold is underway. If gold does breakout
then we would react by adding a few more junior gold/silver stocks to the
TSI Portfolio. The stocks we are considering are Golden Star Resources
(AMEX: GSS), Western Copper (TSX: WTC), Silverado Gold (OTCBB: SLGLF),
and Cumberland Resources (TSX: CBD). Note that we do not expect an upside
breakout in the gold price to occur at this stage, we are simply pointing
out how we would react if it did happen.
Chart Sources
Charts used in today's commentary were
taken from the following web sites:
http://stockcharts.com/index.html
http://www.futuresource.com/

|

