|
- Interim Update 11th October 2006
Copyright
Reminder
The commentaries that appear at TSI
may not be distributed, in full or in part, without our written permission.
In particular, please note that the posting of extracts from TSI commentaries
at other web sites or providing links to TSI commentaries at other web
sites (for example, at discussion boards) without our written permission
is prohibited.
We reserve the right to immediately
terminate the subscription of any TSI subscriber who distributes the TSI
commentaries without our written permission.
The Stock Market
The Principle of Ever-Changing Cycles
This
year's performance by the US stock market has provided us with another
good example of the principle of ever-changing cycles at work.
Below is an excerpt from Chapter 5 of Robert Bacon's book* "Secrets of
Professional Turf Betting". This excerpt from the book and, in fact,
almost the entire book, applies just as well to financial market
speculation as it does to betting on horse racing.
"The collective 'mind' of
the public imagines that if it could only once find the 'combination'
for beating the races, it would be all set for life. The public wants
to hit on some simple key, shown by numbers in the past performances,
and use this key to get richer and richer as racing goes on. The public
believes that if it could only once find that past performance key, its
troubles would be over.
But that is not the way
racing is at all. There is no danger of the public ever finding any key
to the secret of winning. The crazy gambling urge and speculative
hysteria that overcomes most players at the track makes that fact a
certainty. But, if the public play ever did get wise to the facts of
life, the principle of ever-changing cycles of results would move the
form away from the public immediately."
The reason the public can't win over the long-term has nothing to do
with intelligence or knowledge. It is, instead, due to the principle of
ever-changing cycles, which can be summed up as follows:
A speculative idea or strategy can only work until it is 'discovered'
by the public. After that, the weight of the public's betting will
change the odds such that the idea or strategy has little chance of
providing good returns in the future.
For example, if the public comes to strongly believe that the stock
market will provide excellent long-term returns and bids up prices to
the point where the average P/E ratio is well above 20, then its own
buying will have created the situation where long-term returns are
almost guaranteed to be poor.
This year's performance by the US stock market has provided us with
another good example of the principle of ever-changing cycles at work.
Coming into this year it is likely that most people involved in the
stock market knew that a) the second year of the US Presidential term
tends to be bad for stocks, and b) the 4-year stock market cycle -- a
cycle that had worked so reliably for so many decades -- was due to
bottom during the second half of this year. But what actually
transpired was that the stock market rallied during the period when it
was 'supposed' to be plunging.
The reason the stock market rallied when it was 'supposed' to be
falling was that the public latched-onto the idea that there was going
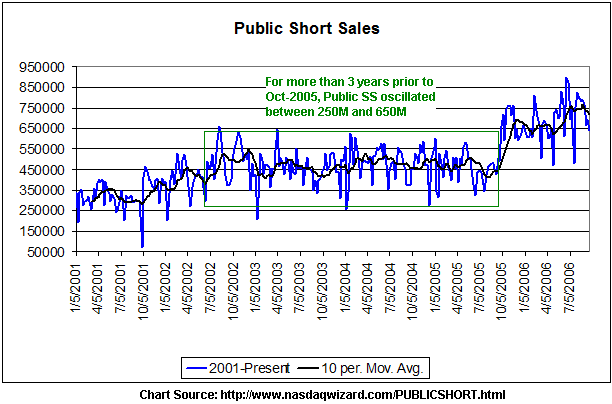
to be a traditional October low and bet accordingly. As evidenced by
the following chart, the amount of public short-selling began to
increase during the final quarter of last year and hit an extreme high
when the stock market was bottoming in June of this year. Furthermore,
it subsequently remained at a relatively high level despite the strong
rally in the stock market. Clearly, the public retained a lot of its
bearish bets in the face of a strengthening stock market in
anticipation of a plunge to a traditional Q4 low.
We under-estimated
the bullish consequences of the extremely pessimistic sentiment that
prevailed during June-July. We knew enough to suggest exiting bearish
positions when the market was bottoming in June and, apart from a very
brief lapse during September, to subsequently stay away from such
positions, but we really should have turned outright bullish in the
face of the public's extreme bearishness rather than just shift to the
sidelines.
For those of us who are very confident that the US stock market is
over-valued and in the throes of a secular bear trend there is an
inclination to look for opportunities to bet against the market.
However, it will make sense to resist these inclinations until the
public is, once again, enthusiastically embracing the bullish case.
*Bacon's book on
turf betting was the basis for some pieces we wrote in 2002. In May of
2005 we consolidated these pieces into an article at http://www.speculative-investor.com/new/article170505.html
Gold and
the Dollar
Gold versus the Dollar
The relationship between the gold price and currency exchange rates
...it
is well known that gold tends to move in the opposite direction to the
US dollar... ...if the US$ continues to strengthen over the coming
weeks/months then it will create a headwind for gold, but a COMBINATION
of factors will determine whether or not this headwind will be
sufficient to bring about additional significant weakness in the gold
price.
In our opinion, the notion that geopolitical nervousness/crisis is bullish for gold is the financial market equivalent of an old wives' tale.
Whenever the risk of international conflict appears to increase there
will almost always be an upward blip in the gold price due to the
reactive buying of traders who believe the old wives' tale, but
sustained advances in the gold price are never based on international
confrontation or fears of it. At least, they haven't been over the past
40 years. It was therefore not surprising that there was only a minor
bounce in the gold price in response to North Korea's recent nuclear
test.
The investment demand for gold, and therefore the price of gold, is
almost totally determined by factors such as real returns on financial
assets (stocks and bonds), yield spreads, credit spreads, and currency
exchange rates; and these, in turn, are strongly influenced by
inflation expectations and confidence.
As far as the relationship between the gold price and currency exchange
rates is concerned, it is well known that gold tends to move in the
opposite direction to the US dollar; or, to put it another way, in the
same direction as the Swiss Franc. This relationship might break down
at some point over the next few years due to confidence in European
currencies falling at a faster rate than confidence in the US dollar,
leading to gold rising against the US$ at the same time as the US$ is
rising against the Swiss Franc. However, with the notable exception of
the period between early-2005 and early-2006 the relationship has, over
the past few years, continued to operate in much the same way as it has
over the past three decades.
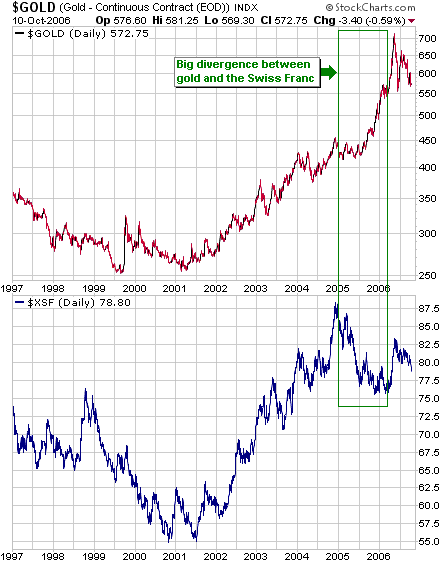
It's the exception mentioned above that we want to delve into today.
Referring to the following chart comparison of the US$ gold price and
the Swiss Franc (the Franc/US$ exchange rate), after moving in lockstep
for many years gold and the SF began to diverge in a big way during
2005. This divergence initially took the form of gold moving sideways
while the SF moved substantially lower and later entailed gold
rocketing upward while the SF consolidated near its lows. The
divergence ended in March of this year.
The divergence
between gold and the SF that began to develop during the second quarter
of 2005 and became very pronounced during the final 4 months of 2005
took us by surprise. We had correctly anticipated the 2005 rally in the
US$, but had expected the dollar's upward trend to keep a lid on the
gold price. Additionally, the monetary backdrop at the time did not
appear to be conducive to strength in gold because the US yield-spread
was contracting and real short-term interest rates in the US were
rising.
What we missed was the spectacular surge in GLOBAL liquidity that was
occurring alongside the Fed's modest efforts to tighten US monetary
conditions. The virtually unlimited supply of almost zero-cost money
being provided to Yen carry-traders by the Bank of Japan was the main
source of this liquidity, but there were other sources including the US
Government's borrowing binge in the wake of the New Orleans disaster.
Now, gold doesn't usually benefit from rising liquidity and its
performance during the 2005-2006 rally was certainly poor relative to
the performances of most industrial metals (copper, zinc, silver,
etc.), but even a relatively poor performance was extremely good when
measured in nominal currency terms. There was, quite simply, such a
deluge of liquidity that almost all other considerations were swamped.
Anyhow, in dredging-up the past the point we are trying to make is that
our market analyses shouldn't be based too much on fixed beliefs. In
the above-described example a strengthening US$ and a deteriorating
monetary environment within the US were headwinds facing gold during
the second half of 2005, but these headwinds were overcome by other
forces. By the same token, if the US$ continues to strengthen over the
coming weeks/months then it will create a headwind for gold, but a
COMBINATION of factors will determine whether or not this headwind will
be sufficient to bring about additional significant weakness in the
gold price.
Current Market Situation
As things currently stand, the Swiss Franc and the euro have broken
decisively below their June lows while gold is still holding above its
June low. For details, refer to the following daily charts of December
euro futures and December gold futures.
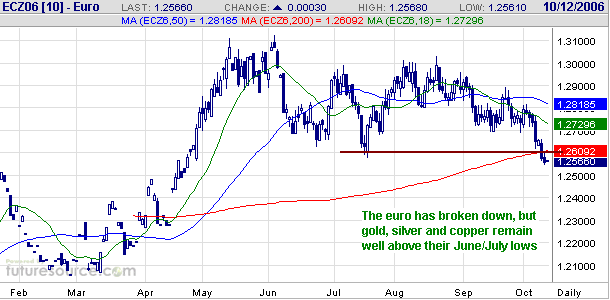
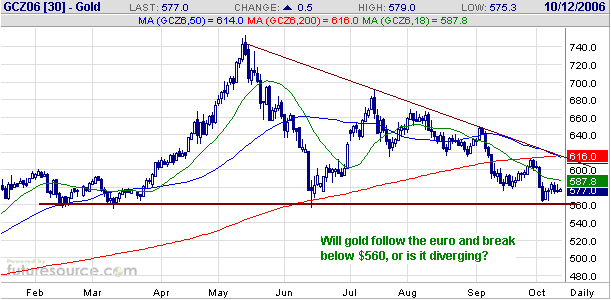
The higher the US$
goes against other fiat currencies WITHOUT a breakdown in the gold
price the more likely it is that gold will burst upward once the dollar
commences its next consolidation. The question is: will gold continue
to hold above its June low if the US$ continues to strengthen over the
coming weeks?
We do not have a strong opinion on whether it will or won't. What we do
have a strong opinion on is that the downside potential following a
break below $560 (basis the December contract) would be limited to a
test of long-term support at $510. What this means is that we perceive
short-term downside risk of about 10%. On the other side of the ledger,
December gold has significant resistance at $615-$620 and a daily close
above this resistance would suggest that gold was going to test its May
peak at some point over the ensuing 3 months. What this means is that
we perceive short-term upside potential of around 25% from the current
level, although December gold would need to close above $620 to
indicate that this short-term upside potential was probably going to be
realised.
Now, downside risk of 10% should be trivial for any long-term investor
in the gold market who shares our view that the US$ gold price is
likely to trade well into 4 digits at some point over the next 3 years.
However, a 10% decline would be huge for anyone with a large and
leveraged long position in gold futures.
Anyone with a large and leveraged position in gold futures (a long
position or a short position) is, in our opinion, trading in a reckless
manner. Reckless, that is, unless they have a very good reason to
believe that they will be able to exit their position with minimal
damage should the market move suddenly and substantially in the 'wrong'
direction.
Gold's Counter-Cyclical Nature
When we write that gold is counter-cyclical we mean that gold tends to
perform best when the real economic growth rate is slow and financial
market liquidity is contracting.
We can illustrate gold's counter-cyclical nature by looking at how it
performs relative to a cyclical metal such as copper under different
scenarios. In this vein we've included, below, two charts that show how
gold and copper perform relative to each other under different
interest-rate conditions.
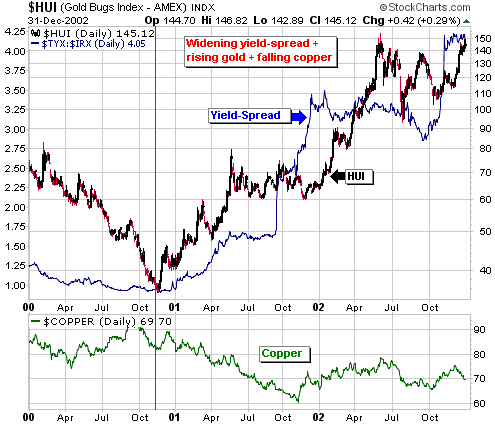
The first chart shows how the AMEX Gold BUGS Index (HUI), the US
yield-spread (the 30-year T-Bond yield divided by the 13-week T-Bill
yield) and the copper price performed during 2000-2002. Notice that the
HUI's bottom during the final quarter of 2000 roughly coincided with a
PEAK in the copper price, and that a downward trend in copper during
much of 2001-2002 was accompanied by an upward trend in the gold
sector.
The key to both the upward trend in the gold sector and the downward
trend in the copper price during 2001-2002 was the performance of the
yield-spread. In response to economic weakness during 2001-2002 the
market and the Fed pushed short-term interest rates lower relative to
long-term interest rates, causing the yield-spread to move sharply
higher.
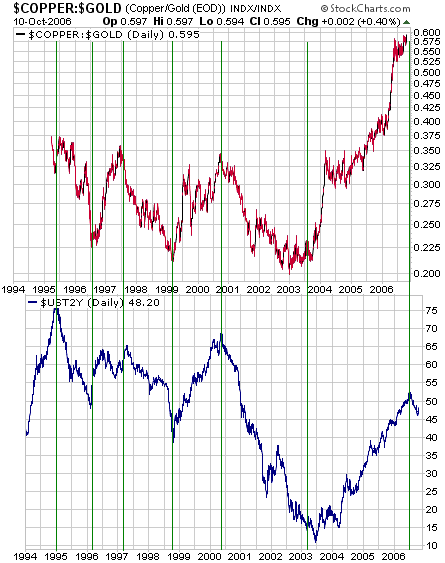
The second chart compares the copper/gold ratio with the yield on
2-year Treasury Notes and was inspired by something we saw in a recent
issue of Kevin Klombies' daily report (http://www.krk-imra.com/).
The message is that over the past 12 years the copper/gold ratio has
followed the 2-year interest rate with monotonous regularity (the
charts have been offset by 6 months to account for the fact that
turning points in the 2-year interest rate have generally led turning
points in the copper/gold ratio by this amount of time).
That copper has demonstrated such a strong tendency to outperform gold
when short-term interest rates are rising and under-perform gold when
short-term interest rates are falling is testament to the view that
copper is cyclical and gold is counter-cyclical (copper does better
than gold when the economy is strong and worse than gold when the
economy is weak).
The problem we have
right now is that we are heavily skewed towards gold-related
investments in anticipation of an economic downturn, but some leading
indicators -- most notably the stock market -- are saying that the
beginning of an economic downturn is still at least 1-2 quarters into
the future. However, even if the economic and interest rate backdrops
don't soon begin to move in favour of gold we expect that there will be
a multi-month rally in gold-related investments from whatever low is
made this month. It's just that in the absence of an upward reversal in
the yield-spread the rally would likely be of the counter-trend variety.
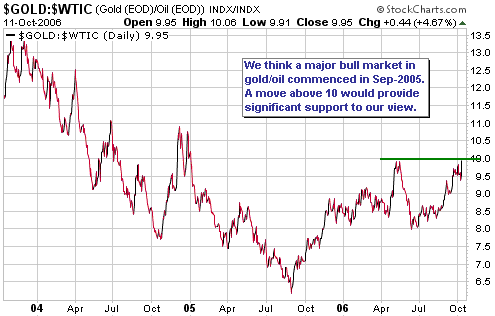
Gold versus Oil
...we would be buyers of gold-related investments on weakness and would be sellers of oil-related investments on strength.
Below is a chart of the gold/oil ratio.
In our opinion, the unbridled bullishness towards oil in the immediate
aftermath of Hurricane Katrina (late-August and early-September of
2005) create a MAJOR peak in oil relative to gold (a major bottom in
the gold/oil ratio). At that point in time it would have been very
difficult to find anyone with the ability to sit-up unaided who didn't
understand the bullish case for oil. At the same time there probably
wasn't even one person in one hundred who understood the bullish case
for gold. Furthermore, the situation is not much different today. The
majority has at least superficial knowledge of the "Peak Oil" theory
and believes that the oil price is ultimately headed much higher. At
the same time, even many avid gold bulls justify their outlooks using
spurious reasons such as the supposed deficit between new mine supply
and fabrication demand (this so-called deficit has never been and never
will be a significant driver of the gold price). What this means is
that the pool of potential converts to the 'bullish gold camp' is still
much bigger than the pool of potential converts to the 'bullish oil
camp'.
In the short-term both oil and gold are very oversold and should
rebound strongly from whatever lows they make this month, but due to
our longer-term views we would approach the two markets quite
differently. Specifically, we would be buyers of gold-related
investments on weakness and would be sellers of oil-related investments
on strength.
Gold Stocks
We think the gold sector is close to a bottom and, therefore, that it
makes sense to be building-up exposure to this sector of the market
right now. There isn't yet any evidence, though, that the bottoming
process is complete, so while we don't expect gold stock indices such
as the HUI and the XAU to move substantially below their current levels
it wouldn't surprise us to see some additional weakness prior to the
start of a multi-month advance.
One thing currently missing from the bottoming process is a sequence of
5-7 down-days in the HUI. In order to get a sustainable bottom there
doesn't have to be a lengthy sequence of down-days, but
intermediate-term bottoms in the gold sector USUALLY follow such
sequences. For example: the June-2006 bottom followed 7 consecutive
down-days; the May-2005 bottom followed 5 consecutive down-days; the
March-2003 bottom followed 6 consecutive down-days; the October-2002
bottom followed 7 consecutive down-days; the November-2001 bottom
followed 6 consecutive down-days; and the November-2000 bottom followed
7 consecutive down-days.
Ideally, at some point over the next three weeks there will be a
sequence of 5-7 down-days in the HUI to set the scene for a large
advance.
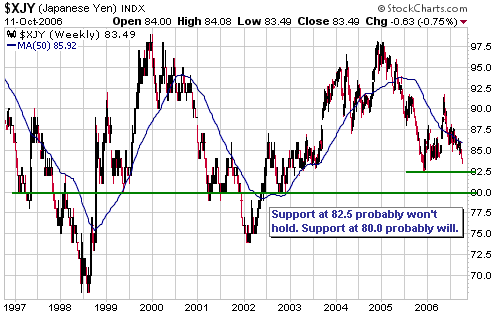
The Yen
Of the major fiat currencies, the one we expect to perform the best
over the next 3 years is the Yen. However, it will be very difficult
for the Yen to commence a bull market worthy of the name as long as the
consensus view is that the Bank of Japan will hold short-term Japanese
interest rates near zero for the foreseeable future. As long as this
view prevails and short-term US interest rates remain above 4% then
there will be an almost irresistible incentive for banks and hedge
funds to sell borrowed Yen and use the proceeds to buy
dollar-denominated investments.
In the mean time the relentless short-selling of the Yen will
periodically lead to opportunities to buy the currency at attractive
levels. We highlighted the Yen as a buy when Yen futures dropped to the
low-80s late last year, and we are highlighting it again now. With
reference to the following weekly chart, we suspect that the
December-2005 low will soon be breached but that longer-term support
near 80 will hold.
Update
on Stock Selections
(Note: To review the complete list of current TSI stock selections, logon at http://www.speculative-investor.com/new/market_logon.asp
and then click on "Stock Selections" in the menu. When at the Stock
Selections page, click on a stock's symbol to bring-up an archive of our comments on the stock in question)
 According
to Tuesday's press release, development-stage nickel miner Crowflight
Minerals (TSXV: CML) plans to raise C$16M via the issue of new shares
at C$0.35 per share for non-flow-through shares and C$0.40/share for
flow-through shares. This equity issue will increase CML's total share
count by 43M shares, or around 30%. According
to Tuesday's press release, development-stage nickel miner Crowflight
Minerals (TSXV: CML) plans to raise C$16M via the issue of new shares
at C$0.35 per share for non-flow-through shares and C$0.40/share for
flow-through shares. This equity issue will increase CML's total share
count by 43M shares, or around 30%.
The timing of the equity issue is unfortunate because the stock was
consolidating just below major resistance at C$0.40 (see chart below)
and in the absence of the new equity would probably have broken-out to
the upside over the coming month or so. But an upside breakout in the
near future is now less likely.
We do, however, understand why CML's management did what they just did.
In order to stay on track to put the Bucko nickel mine into production
during the second half of next year there is a lot of work that must be
done at the site right now. Furthermore, in order to finalise the debt
component of the project financing the company needed a certain amount
of equity in place. Management was therefore faced with the decision as
to whether it would be better to do a large equity issue now at a
depressed share price and keep the Bucko mine development on schedule,
or delay the equity issue and quite likely the mine development in the
hope of issuing the new shares at a much higher price in a few months
time.
Our valuation analysis is not greatly affected by this week's news
because we've been assuming that 60M new shares would be issued over
the coming 12 months to finance mine construction, although we had been
hoping that the new shares would be issued at a higher price.
As outlined in the 17th July Weekly Update, our valuation for CML
assuming a nickel price of $7.70/pound is C$1.30/share (note that the
current nickel price is above $13/pound).
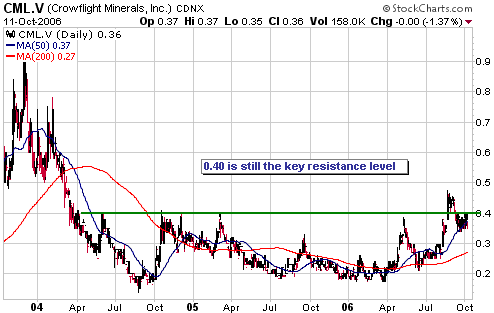
Chart Sources
Charts appearing in today's commentary
are courtesy of:
http://stockcharts.com/index.html
http://www.futuresource.com/

|
