![]()
![]()
![]()
![]()
- Interim Update 11th October 2017
Copyright
Reminder
The commentaries that appear at TSI
may not be distributed, in full or in part, without our written permission.
In particular, please note that the posting of extracts from TSI commentaries
at other web sites or providing links to TSI commentaries at other web
sites (for example, at discussion boards) without our written permission
is prohibited.
We reserve the right to immediately
terminate the subscription of any TSI subscriber who distributes the TSI
commentaries without our written permission.
Why a euro collapse
will precede a US$ collapse
There are three critical
differences between the monetary systems of the US and the euro-zone and
these differences make it inevitable that the euro will collapse (cease
being a useful medium of exchange) before the US$ collapses.
The
first difference is to do with the euro-zone system being an attempt to
impose common monetary policy across economically and politically
disparate countries. This is a problem. A central planning agency imposing
monetary policy within a single country is bad enough because it generates
false price signals and in so doing reduces the rate of economic progress.
However, when monetary policy (the combination of interest-rate and
money-supply manipulations) is implemented across several
economically-diverse countries the resulting imbalances grow and become
troublesome more quickly.
As an aside, money is supposed to be
neutral -- a medium of exchange and a yardstick, not a tool for economic
manipulation. Therefore, it is inherently no more problematic for
different countries to use a common currency than it is for different
countries to use common measures of length or weight. On the contrary, a
common currency makes international trading and investing more efficient.
For example, there were long periods in the past when gold was used
simultaneously and successfully as money by many different countries.
However, if a currency can be created out of nothing then there is no
getting around the requirement to have an institution that
oversees/manages it. The euro could therefore not be 'fixed' by simply
eliminating the ECB. The ECB and the one-size-fits-all monetary policy it
imposes are indispensable parts of the euro-zone system.
The second
difference is linked to the concept that a government with a captive
central bank cannot become insolvent with respect to obligations in its
own currency. For example, due to the existence of the Fed the US
government will always have access to as much money as it needs to meet
its obligations, regardless of how much debt it racks up. Putting it
another way, should all other demand for Treasury debt disappear the Fed
will still be there to monetise whatever amount of debt the US government
issues. Consequently, the US government will never be forced to directly
default on its debt.
It's a different story in the euro-zone,
however, because the ECB is not beholden to any one government. The
provision of ECB financial support to one euro-zone government therefore
requires the acquiescence of other governments. This hasn't been a
stumbling block to date and the ECB has provided whatever support was
needed to prevent financially-stressed euro-zone governments from directly
defaulting on their debts, but eventually a point will be reached when the
governments of some countries balk at their interest rates and money being
distorted as part of an effort to prop-up the finances of another
government. At that point there will either be direct default on euro-zone
government debt or the disintegration of the monetary union.
Once
it becomes clear that direct default on government debt is a risk to be
reckoned with, 'capital' will flee the euro-zone at a rapid rate. This is
because the main (only?) reason to own government bonds is that they are
supposedly risk free.
The third critical difference between the US
and euro-zone monetary systems is similar to the second difference. In the
US there is a symbiotic relationship between the Fed and the government,
with one institution always being prepared to support the other in a time
of crisis. One consequence of this relationship is the virtual
impossibility -- as discussed above -- of the US government ever being
forced to directly default on its debt. Another consequence is the virtual
impossibility of the Fed ever becoming bankrupt.
Several years ago
there was much speculation that the Fed would go broke due to large losses
on the bonds it was buying in its QE operations, but this speculation was
never well-informed. Up until now the Fed has made out like the bandit it
is on its 'investments' in Treasury and mortgage-backed securities, but
even if these securities had collapsed in value it would not have resulted
in the Fed going bust. It would simply have led to a line being added to
the Fed's balance sheet to keep the books in balance.
Again,
though, it's a different story in the euro-zone. Should the ECB begin to
incur large losses on its bond portfolio there is no certainty that it
would be able to keep going about its business as usual. To do so would
require the support of governments/countries that never benefited from and
never whole-heartedly agreed with the programs that led to the pile-up of
low-quality bonds on the ECB's balance sheet.
Summing up, the US
monetary system is problematic in that it gets in the way of economic
progress, but it is much less fragile than the euro-zone monetary system.
That's why the euro-zone system will be the first to collapse.
The Stock Market
The US
Does valuation matter anymore?
Valuation has only ever mattered to the extent that it created long-term
downside risk or upside potential. It has never been a market timing
indicator.
When the valuation of the average stock is near the top
of its historic range we can be confident that the stock market will
generate a poor real return over the coming 10 years, but high valuation
(on its own) will never be a good reason to enter a short-term or
intermediate-term bearish speculation. And when the valuation of the
average stock is near the bottom of its historic range we can be confident
that the stock market will generate a good real return over the coming 10
years, but a low valuation (on its own) will never be a good reason to
enter a short-term or intermediate-term bullish speculation.
Currently, by all measures we know of the US stock market's valuation is
near the top of its historic range. The measure we'll focus on today is
market capitalisation relative to GDP.
The following chart shows
that the capitalisation of the US stock market, as indicated by the
Wishire5000 Index, is now within 3% its Q1-2000 peak relative to GDP (note
that the last part of the line on the chart was added manually based on
where we estimate the ratio will be when the Q3 GDP number is reported
late this month). The Q1-2000 peak in the Wilshire/GDP ratio was the
all-time high, meaning that the Wilshire5000 will have to rise by only an
additional 3% from here relative to GDP to establish the highest valuation
in history.
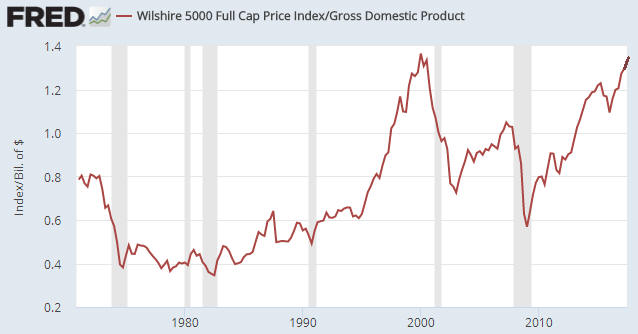
The implication of the above chart is that someone who now buys a fund
that mimics the performance of a broad-based US stock index will end up
with a negative return if they hold for 10 years. However, the chart says
nothing about the likely return that this person will achieve over the
coming 12 months. Furthermore, the probably-negative 10-year return will
not be generated by a downward trend lasting many years. Instead, it's
very likely that the declines that lead to the overall 10-year return
being negative will occur during periods with a combined length of less
than 3 years.
Current Market Situation
Over the first three days of this week the S&P500 Index tacked on
another 6 points and ended the 11th October session at an all-time high.
It therefore maintained its upward trend into the 10th anniversary of its
2007 peak.
Volatility remains low, complacency remains high and
there is no sign of weakness yet.
Japan
Mainly for the sake of interest we point
out that Japan's Nikkei225 Index is testing its 2015 peak. Refer to the
following weekly chart for details.
For what it's worth, our guess
is that the Nikkei won't make a sustained breakout in the near future but
will do so early next year. This guess is based on what we expect to
happen in other markets.
Gold and the Dollar
Gold
In
the latest Weekly Update we wrote that although the upward reversal in the
gold price on Friday 6th October wasn't impressive, the preceding strength
in the gold-mining sector relative to gold suggested that it had marked a
multi-week low. We concluded that a rebound to at least $1300 and possibly
as high as the $1350s was on the cards.
Over the first three days
of this week the gold price almost made it back to $1300, where there is
both lateral and moving-average resistance (the 50-day MA is now very
close to $1300). Getting through this resistance may require a larger
rebound in the T-Bond than has happened to date, which, in turn, may
require a significant pullback in the stock market.
If the gold price is capped over the days ahead by resistance near
$1300 then a decline to test the 6th October low ($1262) may follow. We
aren't inclined to establish a new hedge position at this time, though,
because we think that near-term downside risk is limited by support at
$1250-$1262.
Silver
The silver price
rebounded with the gold price over the first three days of this week. On a
daily closing basis this rebound has been capped to date by the 50-day and
200-day MAs.
With the exception of the downward spike in early
July, the silver price has spent the entire year in the $16.00-$18.50
range. We expect it to stay in this range for at least another month.
Gold Stocks
Current
Market Situation
Very little information about what the
future holds in store can be gleaned from the HUI's recent price action.
We think there's a slight short-term bias to the upside, but we aren't
interested in placing a bet. Instead, as mentioned in the Weekly Update we
are continuing to do what we do most of the time, which is scale into our
favourite stocks following sell-offs and take some money off the table
following price run-ups.
Something worth considering is that Q4 weakness in gold bullion and
gold-mining stocks may have become too predictable. In particular, in each
of the past four years the gold-mining indices were weak from
early-October through to at least mid-December and rebounded strongly from
a low in December or January. We don't know how widespread this view is,
but we have seen signs that some market participants are anticipating a
repeat performance over the next few months.
At this stage we are
not betting either way, but the fact that the HUI held its 200-day MA
during the recent sell-off could be an early warning that 2017 is not
going to follow the Q4 pattern established over the past four years.
We are very much open to the possibility that the gold-mining sector
will be 'surprisingly' strong during November-December. This could happen
in response to the broad stock market becoming 'surprisingly' weak over
the same period.
The proposed West
Australian gold royalty increase gets canned
The West
Australian Labour government had planned to increase the royalty paid by
gold producers from 2.5% to 3.75%, but the plan has been killed by the
opposition parties in the state parliament. The plan's death was confirmed
when the
Liberal Party voted against it on 10th October.
The 1.25%
additional royalty would not have significantly worsened the economics of
most gold-mining companies operating in the state, but because such
royalties are applied to the top line rather than the bottom line it may
have had a significant adverse effect on marginal producers. Thankfully,
it won't be happening.
The Currency Market
The Dollar Index (DX) has pulled back following last Friday's test of
lateral resistance at 94. Also, the downward reversal of the past few days
has helped to define channel resistance. Refer to the following daily
chart for details.
There is support at 92.5 and then at the 2017
low of 91.0. A breach of the higher support probably would be followed by
a test of the lower support.
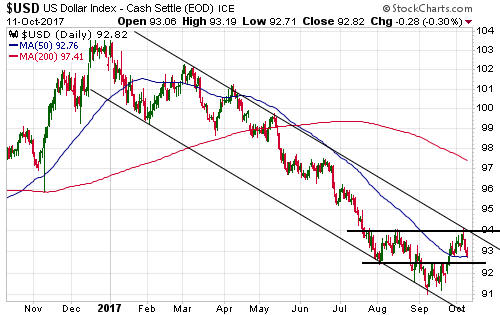
Based on both sentiment and fundamental considerations, the worst the
DX should do over the weeks ahead is test support at 91 before resuming
its recovery.
Updates on Stock Selections
Notes: 1) To review the complete list of current TSI stock selections, logon at
http://www.speculative-investor.com/new/market_logon.asp
and then click on "Stock Selections" in the menu. When at the Stock
Selections page, click on a stock's symbol to bring-up an archive of
our comments on the stock in question. 2) The Small Stock Watch List is
located at http://www.speculative-investor.com/new/smallstockwatch.html
Chart Sources
Charts appearing in today's commentary
are courtesy of:
http://stockcharts.com/index.html
http://research.stlouisfed.org/
![]()