|
- Interim Update 11th November 2009
Copyright
Reminder
The commentaries that appear at TSI
may not be distributed, in full or in part, without our written permission.
In particular, please note that the posting of extracts from TSI commentaries
at other web sites or providing links to TSI commentaries at other web
sites (for example, at discussion boards) without our written permission
is prohibited.
We reserve the right to immediately
terminate the subscription of any TSI subscriber who distributes the TSI
commentaries without our written permission.
Next decade's major trends
Speculators
such as us can make educated guesses as to what the next decade's major
trends are likely to be, but it is important that our expectations are
not 'set in stone'. Some long-term outcomes look far more likely than
others, but we take it as read that the future holds big surprises in
store. Moreover, it is worth reiterating that to generate good returns
there is no need to 'see' the future, because successful speculation
has very little to do with forecasting and a lot to do with risk
management and real-time analysis. In fact, if your
speculating/investing strategy relies on being able to accurately
forecast then you are, in our opinion, a financial accident looking for
a place to happen.
Over the next 18 months, real-time analysis is likely to provide us
with some useful clues as to what the new decade's major trends are
likely to be. For example, the historical record suggests that the
first markets to make new 52-week highs after October of 2010 will be
the most likely candidates for 5-10 year bullish trends, whereas the
first markets to make new 52-week lows after October of 2010 will be
good candidates for 5-10 year bearish trends.
That being said, we can't avoid having opinions on what will likely
happen in the future. Based on what we know right now, here are three
of the major trends that we expect to see during the 2010s:
1. A continuation of gold's bull market
It is likely that gold's long-term bull market will continue until the
broad US stock market has become under-valued based on traditional
metrics such as price/earnings and price/dividend ratios. Also, major
trends in the gold market tend to follow major trends in money-supply
growth with a lag of 2-4 years. These considerations suggest that
gold's bull market has at least a few years to run.
Something that would prompt us to re-think our long-term bullish
outlook for gold would be a spectacular upside blow-off in the gold
market over the coming few months. A short-term outcome such as this
could create a premature long-term peak.
2. A bear market in government debt securities
Policies based on horribly-flawed Keynesian economic theory and the
reality that problems resulting from government expansion generally
provide the excuse for additional government expansion have caused the
rate of increase in government debt to go parabolic. Consequently,
within the next three years there is a good chance that some of the
world's most influential governments, including that of the US, will be
faced with the choice of either ramping up the pace at which their debt
is monetised by the central bank or directly defaulting on their debt.
We suspect that bond markets will begin to discount these bond-bearish
outcomes in 2010.
3. A bull market in "green" investments
Regardless of the economic logic (or lack thereof), it is clear that
governments around the world are setting a course that involves the
large-scale transfer of wealth towards activities that are perceived to
be environmentally friendly. We can rail against the stupidity of what
they are doing, but at the same time we can also attempt to profit from
it.
Weimar-style hyperinflation: Is it possible today?
Our view for many years has been that focusing on the ability, or
inability, of the banking industry to lend new money into existence
misses the critical point that it is ultimately the government, not the
private banks or even the central bank, that determines the amount of
monetary inflation. The fact is that under the current monetary system
there is no limit to the amount by which the government can increase
its obligations in terms of its own currency. That, in a nutshell, is
why we have such a terrible monetary system. It certainly didn't come
into being as a way of promoting a stronger economy.
The bond market could, of course, impose a practical limitation on
government debt expansion at some point in the future, although there
is no guarantee that even a plummeting bond market would curtail the
expansion. A plummeting bond market certainly didn't stop the frenzied
increase in government debt -- and the associated hyperinflation -- in
"Weimar" Germany during the early 1920s. The question is: could
something along the lines of the Weimar Republic's hyperinflation
happen in the US within the next several years?
We think it is very unlikely, for two main reasons. First, the US
Government will probably default DIRECTLY on its debt before it risks
hyperinflation. This is because hyperinflation would destroy the
economy, whereas the costs of a direct debt default would largely be
borne by foreign governments and institutional investors. Second, we
think the most likely next stage in the monetary system's evolution
will be a global currency 'managed' by a World Central Bank.
However, hyperinflation is certainly possible under the current system.
Today's monetary system is actually not as different as most people
believe to the one that was inflated into oblivion during the days of
Germany's Weimar Republic. Like today's minor (by comparison) increase
in the money supply, the spectacular surge in the money supply that led
to Germany's hyperinflation was driven by the monetisation of
government debt.
The Stock Market
The Dow Industrials Index has risen to a new post-crash high, but at
this stage the S&P500 and the NASDAQ100 indices have done no more
than test their October highs. This is a potentially significant
divergence, although it's a divergence that could be eliminated by only
a minor amount of additional strength.
Regardless of whether or not the SPX and the NDX 'confirm' the Dow over
the days ahead, the stock market's upside potential continues to look
small relative to its downside risk.
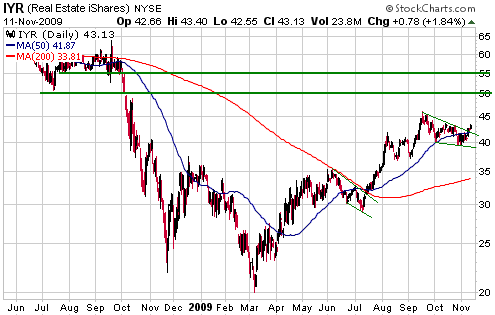
Almost everyone appears to be aware of the US commercial real estate
debacle brewing just beneath the surface. According to what we've read,
it is likely that the resumption of the banking crisis will be prompted
by a wave of loan defaults and bankruptcies within the commercial real
estate sector. Strangely, though, the DJ US Real Estate Index Fund
(IYR), a proxy for the commercial real estate sector, remains in a
strong upward trend (see chart below).
We think you would have to be living in a "fool's paradise" to be
investing in IYR at this time, but the current chart pattern doesn't
point to IYR being a good candidate for a speculative bearish bet. To
become such a candidate it would, we think, have to either rise to
around $50 or break below the late-October low.
Gold and
the Dollar
Gold and Silver
Gold Sentiment
Is the gold market too 'frothy', with speculative enthusiasm at a dangerously high level?
Not as far as we can tell. Actually, we were more concerned about
sentiment in the gold market three months ago than we are today. The
reason is that during the first half of August gold was trading in the
$950s and its price action was indifferent (it had spent several months
chopping back and forth below its February peak), but the 'so-so' price
action was associated with a high level of bullish enthusiasm. By our
reckoning, this meant that sentiment was excessively optimistic.
Gold has since broken upward from a large base, and yet sentiment does
not appear to be any more bullish now than it was in early August. The
total speculative net-long position in COMEX gold futures has risen by
about 25% since then, but Market Vane's bullish percentage and the
premiums to net asset value of closed-end bullion funds (CEF and GTU)
are roughly the same now as they were back then (84%-85% for Market
Vane's bullish percentage, 4%-8% for the NAV premiums).
While it is true that a lot of traders are bullish on gold right now,
this is 'par for the course' for a market in a strong upward trend and
at a new all-time high. It would be strange, indeed, if there weren't
plenty of gold bulls considering that, with the exception of short-term
interest-bearing securities with no additional upside potential
(because their yields are already near zero), gold is the only
high-profile investment in new-high territory.
In summary, gold market sentiment appears to be realistic rather than
irrationally exuberant. At this stage it is not, in our opinion, a good
reason for 'contrarian' investors to be rushing for the exit.
Current Market Situation
Gold has spent the past few days climbing up the top of the price
channel that began to form in July. It is 'overbought', but we see no
reason to expect that the next correction will be anything more than a
routine 3-5 week pullback.
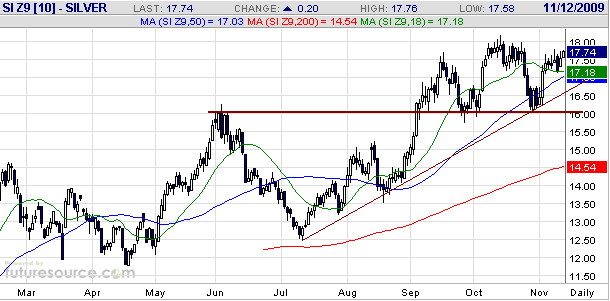
Our main focus, today, is on the silver market. As evidenced by the
following daily chart, December silver has not yet exceeded its October
high and is now potentially forming the 'right shoulder' of a "head and
shoulders" topping pattern. On a longer-term basis, silver is yet to
break above its March-2008 and July-2008 highs.
Silver appears to
have substantially more downside risk than gold over every timeframe,
which makes silver (or SLV) put options a reasonable choice for those
looking for ways to hedge long positions in the precious metals. We
hasten to add, though, that silver also has more upside potential than
gold over every timeframe. Therefore, while we think that silver put
options are presently a reasonable hedge, we would not seriously
consider a speculative short position in silver.
Gold Stocks
Current Market Situation
By moving above its October high the HUI has negated the first (the
most bearish) of the three short-term scenarios mentioned in the latest
Weekly Update. We now know that an intermediate-term peak was not put
in place in October.
The second and third scenarios remain in play, with the second being
the more likely. Just to recap, the second scenario entails the HUI
rising to a marginal new high for the year this month and then
embarking on an intermediate-term correction, while the third scenario
entails the HUI moving substantially higher over the coming months in
response to an upside blow-off in the bullion market.
The third scenario will shift to centre-stage if the HUI makes a new
52-week high after the first week of December. The reason is that the
HUI has reached a turning point of intermediate-term significance
during the October-November time window (a time window that encompasses
the first two trading days of December) in 10 of the past 11 years.
Clearly, if October-November of 2009 is going to provide us with
another important turning point then it will have to be a turn from up
to down.
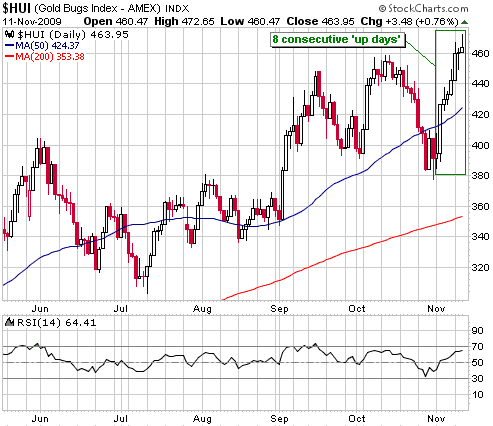
A daily chart of the HUI is displayed below.
The HUI's recent price action has been remarkable in that it has just
risen for 8 trading days in succession. Such runs usually don't exceed
5 days and almost never exceed 7 days, which is why we say that the
price action has been remarkable.
The sequence of 'up days' will almost certainly end on Thursday 12th
November or Friday 13th November, but the end of the sequence probably
won't mark the intermediate-term peak. This is because run-up began at
an 'oversold' extreme.
The Juniors
Some junior gold/silver stocks have made spectacular advances, but
there hasn't yet been a general surge at the junior end of the gold
sector. For some reason -- perhaps because they are not confident that
gold's breakout is sustainable -- professional speculators seem to be
restricting themselves to stocks that offer enough liquidity to permit
a quick exit. For its part, the mass of non-professional speculators
(the public) appears to still be shell-shocked from last year's drama.
Regardless of which of our short-term HUI scenarios plays out, we
continue to expect that many juniors will make new highs, or at least
new 52-week highs, during the first few months of next year.
The Market Vectors Junior Gold Miners ETF started trading in the US
under the symbol GDXJ on Wednesday 11th November. This ETF is a long
way from being the "Holy Grail" for investors looking for diversified
exposure to the junior sector of the gold market, primarily because the
list of 38 stocks currently held by the fund is not, in our opinion,
close to being optimal (the list includes some companies that are way
too big to be classed as "juniors" and others that are relatively
expensive). However, it is probably OK for investors who are unable or
unwilling to analyse/track individual companies, as well as for
short-term traders at the appropriate times.
It would be reasonable for investors to take an initial position now
with the aim of adding to this position during periods of weakness.
Currency Market Update
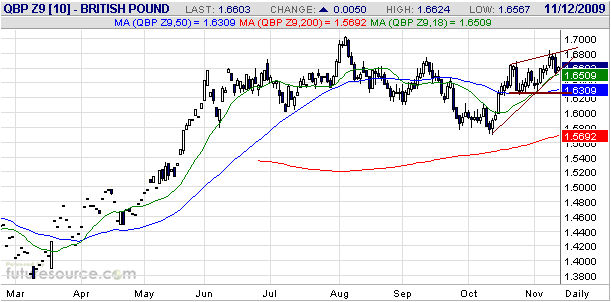
The British Pound is now at a critical level. As illustrated by the
following daily chart, the December pound futures contract trended
lower from early August through to early October, and has since
rebounded to within 2 points of its August high. It has now reached the
point where it will have to either reverse lower and confirm our view
that the August peak was the intermediate-term variety, or prove us
wrong by moving to a new high for the year.
The Pound is fundamentally weaker than most other major currencies, so
it makes sense that it would be the first major currency to peak
against the US$. Therefore, if the Pound manages to make a new 52-week
high it will indicate that the US dollar's bottoming process has not
yet begun.
Update
on Stock Selections
(Note: To review the complete list of current TSI stock selections, logon at http://www.speculative-investor.com/new/market_logon.asp
and then click on "Stock Selections" in the menu. When at the Stock
Selections page, click on a stock's symbol to bring-up an archive of our comments on the stock in question)
 Endeavour Financial (TSX: EDV). Shares: 96M issued, 131M fully diluted. Recent price: C$2.10 Endeavour Financial (TSX: EDV). Shares: 96M issued, 131M fully diluted. Recent price: C$2.10
EDV announced its latest quarterly financial results on Tuesday 10th
November. A substantial profit was achieved during the quarter ended
30th September, but note that the reported quarterly earnings number is
not a good indicator of EDV's performance because it tends to fluctuate
wildly from one quarter to the next in response to changes in the
market values of the company's investments in junior resource stocks.
Of particular interest to us was the reported net asset value (NAV) of
C$3.17/share. Furthermore, the gain in the market value of EDV's stake
in Etruscan Resources subsequent to the quarter's end will have boosted
the NAV to around C$3.50/share. In other words, EDV ended Wednesday's
session at a discount of around 40% to its NAV.
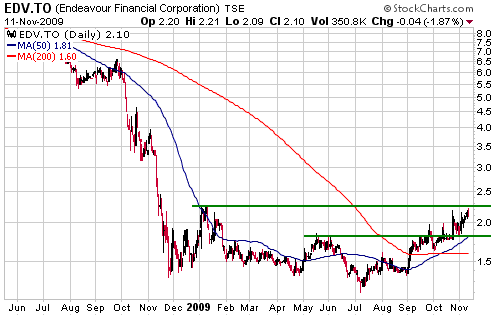
The following chart shows that EDV is still attempting to complete its
basing pattern. There is resistance in the low-C$2.20s and support at
around C$1.80. It is presently not 'overbought', and is, in our
opinion, a buy near its current price of C$2.10 based on its large
discount to NAV and the likelihood that another gold-related deal --
similar to the recent Etruscan deal -- is in the works. It would be a
very strong buy at C$1.80 or thereabouts.
 Resolute Mining (ASX: RSG). Shares: 534M issued (incl 151.7M A$0.50 conv notes), 630M fully diluted. Recent price: A$0.99 Resolute Mining (ASX: RSG). Shares: 534M issued (incl 151.7M A$0.50 conv notes), 630M fully diluted. Recent price: A$0.99
In September we wrote:
"If the final ramp-up of
the Mali-based Syama gold project goes roughly according to the latest
schedule then RSG's stock price will have the potential to rise to at
least A$1.50 over the coming year. However, due to various
uncertainties we would be inclined to make a partial exit from this
stock if its price rose to around A$1.00 within the next two months."
RSG has just risen to around A$1.00, creating an opportunity to make a partial exit.
 Lion Selection (ASX: LST). Shares: 82M. Recent price: A$1.84 Lion Selection (ASX: LST). Shares: 82M. Recent price: A$1.84
A note for current holders of LST shares:
The de-merger will be completed within the next few weeks, with LST
shareholders receiving one post-consolidation share of Catalpa (ASX:
CAH), A$0.10 cash and one share of LSG (a new company) for each of
their LST shares. The new LSG shares will subsequently be listed on a
secondary market known as the NSX, but prior to that happening it will
be possible to sell or buy LSG shares via a "matching facility" set up
by the company. The LSG shares are likely to have a net asset value of
around A$0.75, but under the "matching facility" all shares will be
exchanged at a currently unknown price in the A$0.40-A$0.55 range.
We don't want to include LSG in the TSI Stocks List, so for record
purposes we will assume that LSG is exited via the "matching facility".
Please note, though, that in our own account we will NOT be selling our
new LSG shares at this time because the highest price available via the
matching facility is too far below the net asset value.
We suggest that LST shareholders hold onto the LSG shares they receive
in the de-merger, provided that they a) don't need the cash, b) can
tolerate the likely 'illiquidity' of the NSX-traded shares, and c) are
capable of following the stock's progress without any input from us.
Chart Sources
Charts appearing in today's commentary
are courtesy of:
http://stockcharts.com/index.html
http://www.futuresource.com/

|

