|
- 11 December, 2002
The Information
Age versus the Principle of Ever-Changing Cycles
A question that we've received several
times over the past year from readers of our 'stuff' goes something like
this: "With the general public now having ready access to far more information
than in the past, won't the so-called 'dumb money' make better investment
decisions and be less likely to behave in a herd-like manner?"
We've always been somewhat amused by
the above question because the recent stock market mania was clearly one
of the greatest examples ever of the investing public losing its senses
and accepting fantasy as fact. Even the most cursory observation of the
goings-on of the past 5 years tells us that the Information Age has not
brought about an improvement in the ability of the public to make the right
investment decisions. After all, there were record flows of money into
equity funds at the bubble peak during the first quarter of 2000 and there
were significant flows of money out of equity funds when the market was
bottoming during July-October of this year. And based on past experience
much greater out-flows will occur when prices drop below this year's low.
For all the information that people had access to they managed to embrace
ideas that they really should have perceived as absurd. As has always been
the case throughout history and always will be the case, they simply got
carried away with rising prices and visions of great wealth.
Although the experiences of the past
few years provide some empirical evidence that the availability of more
information has not increased the investment acumen of the public, it is
worth exploring why this is so.
One reason, of course, is that a high
percentage of the information to which the public is exposed is wrong,
either by accident or by design. So while most people have a lot more
information than they had in the past their decisions might, if anything,
tend to be even less correct because much of that information is inaccurate.
In other words, bad information is potentially more damaging than the absence
of information. It is quality of information, not quantity
of information, which is important. Thanks to the Internet, high-quality
information is now more readily available to the average investor than
it has been in the past. But unfortunately, most people have no way of
differentiating the good information from the bad or of filtering out the
small amount of useful information from the daily information deluge.
Another reason is that the people who
are responsible for providing information to the investing public, even
if they happen to have the best of intentions, are subject to the same
herd-like behaviour as everyone else. This can be clearly seen in the weekly
survey of investment newsletter writers conducted by Investors' Intelligence.
Most newsletter writers are independent and don't have a vested interest
in getting their readers to buy when they should be selling or to sell
when they should be buying, yet these investment advisors are invariably
wrong at major turning points. As a group they tend to become progressively
more bullish as prices rise and progressively more bearish as prices fall.
As such they are always extremely bullish at major peaks (great selling
opportunities) and extremely bearish at major bottoms (great buying opportunities).
The performance of investment advisors,
as a group, highlights a third reason why having more information won't
prevent the public from making the investment mistakes it has always made
in the past. The people who write investment newsletters generally spend
a lot more time gathering and analysing information on the financial markets
than the average investor, yet as mentioned above the newsletter writers
are invariably wrong at important turning points (some will be right, but
more than half will usually be wrong). For example, at the beginning of
the great 1995-2000 stock bull-market more than 50% of the investment advisors
surveyed by Investors' Intelligence were bearish. The advisors only started
to become bullish when the market started to rally, and the higher the
prices moved the more bullish they became. As such, it isn't really the
quantity or the quality of information that matters when looking at the
investment performance of any large group. Some people are able to separate
themselves from the investment herd and make decisions based on an objective
assessment of the available evidence, but most, including the majority
of supposedly well-informed advisors, will simply react to changes in
prices.
There is, however, a fourth and even
more fundamental reason why more information will never stop the public
from ending up on the wrong side of the market, irrespective of how accurate
the information was when it was first digested by the public or the public's
ability to interpret information. This reason is covered in the following
extract from Robert Bacon's "Secrets of Professional Turf Betting" (just
substitute the phrase "stock market" for the words "races" and "racing"
in this extract):
"The collective "mind" of the public
imagines that if it could only once find the "combination" for beating
the races, it would be all set for life. The public wants to hit on some
simple key, shown by numbers in the past performances, and use this key
to get richer and richer as racing goes on. The public believes that if
it could only once find that past performance key, its troubles would be
over.
But that is not the way racing is
at all. There is no danger of the public ever finding any key to the secret
of winning. The crazy gambling urge and the speculative hysteria that overcomes
most players at the track makes that fact a certainty. But, if the public
play ever did get wise to the facts of life, the principle of ever-changing
cycles of results would move the form away from the public immediately."
[Emphasis added]
The reason "the form", as Robert Bacon
puts it, will always move away from the public is that when the public
becomes convinced of something and bets accordingly it worsens the odds
(it lessens the probability of success).
Trends in the stock market continue
until the public becomes a 'true believer' in the trend. In the real world,
where most of the information accessed by the public is unhelpful, it often
takes the public a long time to become a true believer. Then, by the time
it becomes committed to the trend its own buying has pushed prices to such
extremes that the probability of further gains is low and the risk of large
losses is high. However, even in an idealised world in which the bulk of
the information absorbed by the public was accurate and in which the public
had a greater ability to correctly interpret information, the weight of
the public's buying would still turn what might initially have been favourable
odds into unfavourable odds. The public would still find itself on the
wrong side of the market at major turning points, it's just that those
turning points would occur with greater frequency.
In a world where most of the information
thrust at the public was helpful and where the public's ability to objectively
analyse information had been magically enhanced, no investment would stay
popular for long. However, we don't think there is any danger of reaching
the point where even 50% of the information used by the public to make
investment decisions is genuinely helpful. And there is certainly no danger
that objective analysis will ever replace emotion as the main driver of
the public's investment decisions. As such, it will continue to take the
public many years to recognise major trend changes and there will continue
to be plenty of opportunities for 'contrarians' to buy well in advance
of the public and to sell once the public eventually, and inevitably, becomes
a believer.
The US
Stock Market
Current Market Situation
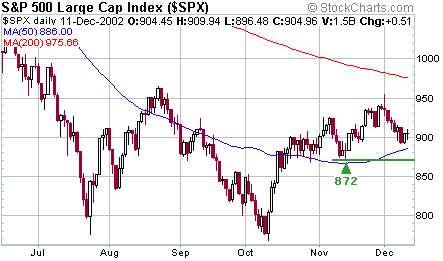
The S&P500 Index bottomed on 9th
October and then moved sharply higher over the ensuing 4 trading days.
Following that initial 4-day burst the S&P500 has essentially gone
nowhere (it closed at 881 on 15th October and closed at 905 yesterday,
so it has gained a whopping 2.7% over the past 8 weeks). And yet, Investors'
Intelligence reports that only 24.2% of investment newsletter writers are
now bearish. This is one of the lowest bearish percentages of the past
5 years, which, given the historical record of investment advisors reaching
their maximum level of optimism near peaks and their maximum level of pessimism
near bottoms, suggests that the market is close to an important peak.
Investment advisors are bullish because
they believe that the market is now in a seasonally-strong period that
will extend into May of next year and that the 4-year cycle bottomed at
the October low. The incredible strength in some tech stocks would also
have contributed to the advisors' bullishness, although in reality the
relative strength of the tech sector during the course of the rally is
more of a negative than a positive. New bull markets are never led by the
leaders of the previous bull market, so the relative strength that has
been demonstrated over the past 2 months by the speculative favourites
of the late-1990s is a sign that we are simply seeing another bounce, albeit
a lengthy one, within an on-going downtrend.
In previous commentaries we mentioned
that the ability, or otherwise, of the NASDAQ Composite to hold above 1420
and the Cisco stock price to hold above its 200-day MA would provide some
preliminary evidence as to whether any decline in the market was a normal
pullback or the start of something more serious. The NASDAQ closed below
1420 and CSCO closed below its 200-day MA on each of the past 3 trading
days, so we have some preliminary bearish confirmation. However, to be
confident that the post-October-09 rally has ended we will need to see
the senior stock indices close below the lows achieved during their previous
pullbacks.
For the S&P500, the important level
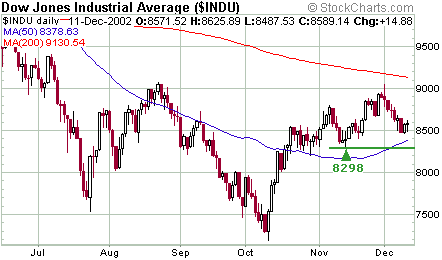
is 872.
For the Dow Industrials, the important
level is 8298.
For the NASDAQ Composite the level
to watch is 1319. Note that Monday's decline in the NASDAQ resulted in
a decisive break of the short-term trend-line and the rebound over the
past 2 days has, to date, failed to recapture this uptrend.
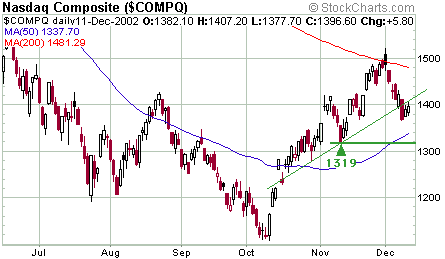
If the indices drop below the levels
highlighted on the above charts then the short-term sequence of ascending
lows will have been broken and we will have good reason to be confident
that the major downtrend has resumed.
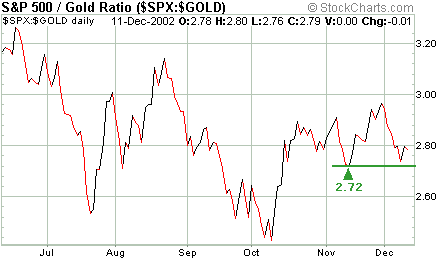
Below is a 6-month chart of the S&P500/gold
ratio. Since peaking in July of 1999 the S&P500/gold ratio has tended
to move slightly in advance of the S&P500 Index (the S&P500 in
terms of gold has typically provided bearish confirmation prior to similar
confirmation being provided by the S&P500 in terms of dollars). If
this pattern continues (it will as long as gold continues to out-perform
the US$) then another early warning sign that the stock market rally has
ended will be a drop below 2.72 by the S&P500/gold ratio.
Gold and
the Dollar
Gold Stocks
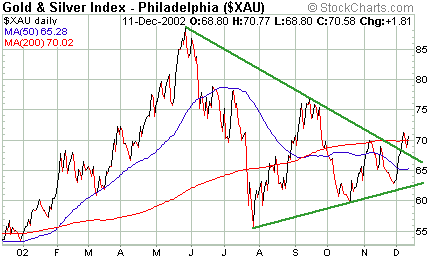
The price action of gold and gold stocks
over the first 3 days of this week hasn't been exciting, but it has been
constructive. The XAU broke out to the upside at the end of last week and,
as mentioned in the Weekly Update, a near-term drop to as low as 67 at
some stage during this week would have been in the realm of a normal breakout
pullback. The XAU dropped to around 68 on Tuesday before rebounding on
Wednesday, so the breakout is intact.
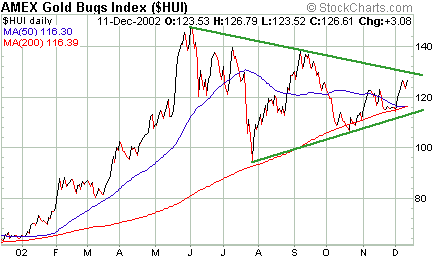
Depending on whether we take into account
intra-day moves or just daily-closing prices the HUI has either already
broken out to the upside or not yet broken out. The below chart uses closing
prices only and indicates that the HUI needs to close at 130 or higher
to effect a break of the medium-term downtrend-line.
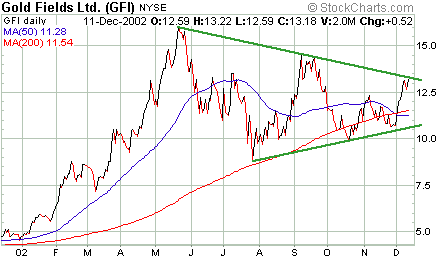
GFI has been one of the strongest of
the major gold stocks over the past few weeks and, as is the case with
the HUI, may or may not have already broken out to the upside. Most charts
indicate that GFI has already broken out, but the below chart shows that
Wednesday's close was right at the downtrend-line. Regardless of whether
or not an upside breakout has already occurred, it looks like GFI is headed
much higher.
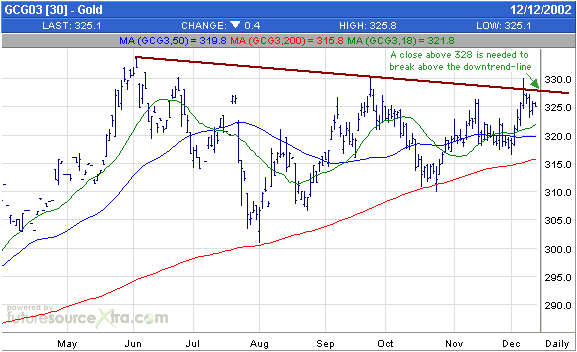
Irrespective of whether we use intra-day
prices or closing prices in our chart, the gold price itself hasn't yet
broken its medium-term downtrend. A daily close above $328, basis the February
gold futures contract, would do it, although once gold gets to $328 it
will still have substantial resistance at $330 to deal with. In the mean
time, fluctuations within the $321-$328 range are just 'noise'.
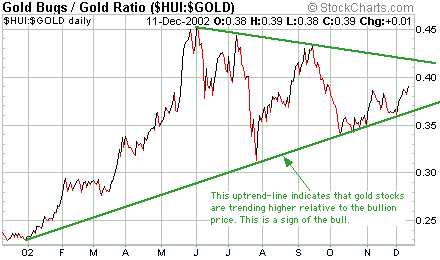
Below is a chart showing the ratio
of the HUI and the gold price. The HUI/gold ratio is a long way from achieving
an upside breakout, but the most important message from this chart is that
gold stocks are continuing to trend higher relative to the gold price.
This is typical bull market behaviour.
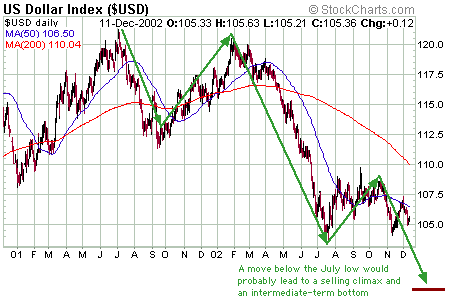
The dollar's fundamentals (e.g., the
current account balance) are lousy and suggest that we are still in the
early stages of a dollar bear market that will extend for years. However,
no market ever moves from a major peak to a major bottom in a straight
line. It is quite possible that the initial phase of the dollar's bear
market is about to end and that the dollar will soon embark on an extended
(3-6 month) bear market rally that most people will mistake for a new bull
market. If this is the case, though, there should first be a selling climax.
The currency market is presently set-up
for a US$ selling climax to occur over the next 1-2 months. The dollar
plunged during the first 7 months of this year and then spent about 3 months
consolidating its loses before breaking lower again towards the end of
October. It made another weak rebound during November before turning lower
again and is now poised about 2% above its July low. We expect that a drop
below the July low would be the catalyst for the above-mentioned selling
climax and would, in turn, result in an intermediate-term bottom for the
dollar. Furthermore, it is likely that a selling climax in the US$ would
be accompanied by a buying climax in gold.
We will review the US$ from a longer-term
fundamental perspective in the next Weekly Update.
Update
on Stock Selections
In the latest Weekly Update we mentioned
junior gold mining company Canyon Resources (AMEX: CAU), a stock that is
more of a play on the outcome of a court-case than a play the gold price.
On Wednesday the Montana First Judicial District Court granted the State
of Montana summary judgment on all of the remaining legal claims of the
lawsuit filed by Canyon Resources. CAU has therefore lost the first battle
in a legal war that appears likely to drag on for a very long time (probably
years). In response to the court's ruling CAU's president said "we are
disappointed with the decision by the Montana District Court in this case,
but are not dismayed. We have recognized from the start that this type
of lawsuit usually requires resort to higher levels of review. We are prepared
to proceed with our litigation on all of the above issues to the next level
of review, either to the Montana Supreme Court or in further pursuit of
the action in the federal court system, in the United States District Court
for the District of Montana."
The CAU stock price naturally dropped
sharply on the news. Had this ruling been a victory for CAU the stock price
would certainly have rocketed upward, but the case would still be headed
to a higher court for the final decision.
At this stage we are going to leave
CAU in the Stocks List since its other assets (assets outside Montana)
are probably worth at least US$1/share versus yesterday's closing price
of US$1.35. However, we wouldn't consider any new buying until the stock
price shows signs of basing.
We currently have the Apex Silver January-2003
$17.50 call options (SILAW) in the Stocks List. From a technical perspective
SIL looks strong, but even a sharp up-move of, say, $2.50 in the SIL stock
price over the next few weeks is not going to breathe any life into these
January options. However, such a move in the stock price would certainly
cause the April $17.50 calls to jump much higher. We are therefore going
to add the April $17.50 calls (SILDW) to the List using a price of $0.95
for record purposes (they closed on Wednesday at $0.85-$1.00).
Charts
and Indicators
This is just a reminder that the "Charts
and Indicators" section at TSI is updated every Monday (prior to the start
of trading in the US) based on data as at the end of the previous week.
In this section we include, amongst other things, charts of the equity
put/call ratio, the TSI Index of Bullish Sentiment, money supply growth,
the TSI Gold Stock Index (TGSI), the gold/TGSI ratio, the yield spread,
and the S&P500/gold ratio.
Chart Sources
Charts used in today's commentary were
taken from the following web sites:
http://stockcharts.com/index.html
http://www.futuresource.com/

|
