![]()
![]()
![]()
![]()
- Interim Update 12th July 2017
Copyright
Reminder
The commentaries that appear at TSI
may not be distributed, in full or in part, without our written permission.
In particular, please note that the posting of extracts from TSI commentaries
at other web sites or providing links to TSI commentaries at other web
sites (for example, at discussion boards) without our written permission
is prohibited.
We reserve the right to immediately
terminate the subscription of any TSI subscriber who distributes the TSI
commentaries without our written permission.
Interest rates will
rise until stock prices tank
The stock market will usually
view a new downward trend in bond prices and the associated upward trend
in interest rates as a minor issue until a point is reached when falling
bond prices (rising interest rates) are the only issue that matters. After
this 'point of recognition' is reached, the downward trend in the bond
market begins to have a very negative effect on the stock market.
A
good example of the bond-stock relationship outlined above is illustrated
by the following chart. The chart shows the performances of the S&P500
Index (SPX) and the 30-year T-Bond price during 1986-1987.
With
reference to this chart we note that the stock market had a scare in
April-1987 when the T-Bond broke below support to a new 9-month low. In
fact, during the first half of April the stock market began to form a
crash pattern and it possibly would have crashed in late-May or early-June
if the T-bond hadn't rebounded sharply after making a short-term bottom in
the second half of May. As it was, the T-Bond's rebound from its May low
and its ability to remain above this low until late-August temporarily
removed a potentially-serious threat and enabled another upward leg in the
SPX bull market.
Near the end of August, however, the T-Bond broke
below its May low and in doing so signaled the resumption of its downward
trend. This was the 'point of recognition' for the stock market -- the
point when a critical mass of market participants realised that the rise
in interest rates was inexorable and totally incompatible with current
equity valuations.
Another crash pattern immediately began to form
(the T-Bond's August-1987 break to a new low for the year coincided almost
to the day with the SPX's final top) and this time there was no T-Bond
rebound to prevent the pattern from completing. The T-Bond did rebound
very strongly in October-1987, but this was a reaction to the stock
market's crash.
A similar chart comparison covering the past two years is shown below,
except that in this case we have used the 10-year T-Note price as our
bond-market proxy.
The chart identifies support defined by the
December-2016 and March-2017 T-Note lows as the critical level -- the
level beyond which falling bond prices (rising interest rates) would
dominate all other considerations and put irresistible downward pressure
on the stock market. However, the 'point of recognition' could occur at a
higher level for the T-Note price. For example, if the T-Note were to
rebound strongly over the next few weeks then the early-July low would
possibly become the critical level.
More importantly, regardless of
the amount of additional bond-market weakness it takes to bring about
major weakness in the stock market, now that a certain relationship has
been established it's a good bet that the bond market's downward trend
will continue until there is major weakness in the stock market. In other
words, to get more than a short-lived respite from rising interest rates
the stock market will have to plunge.
Zinc Update
Early this year the per-pound
zinc price made a 9-year high in the US$1.30s. It then dropped back to a
low of around US$1.10 in May before reversing course and quickly returning
to the vicinity of its early-2017 high. In other words, the zinc price is
currently close to a 9-year high.
The reason for zinc's price strength is a bullish supply-demand
situation. This is evidenced by the following chart showing the amount of
zinc stored in LME warehouses. The chart shows that the LME zinc inventory
has fallen from around 1.2M tonnes during the first half of 2013 to only
280K tonnes.
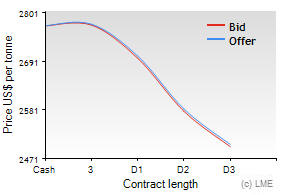
The bullish supply-demand situation is also evidenced by the following
chart from the LME
web site showing the term structure in the zinc futures market. The
downward-sloping curve, which indicates that the later-dated contracts are
cheaper than the earlier-dated contracts (D1, D2 and D3 on the chart's
horizontal axis mean December-2017, December-2018 and December-2019,
resp.), indicates a tightness of supply.
Interestingly, although the zinc price has moved back to near its
high, the prices of most zinc-related stocks are a long way below their
12-month highs. This creates an opportunity.
The zinc price is a
little stretched to the upside on a short-term basis and will possibly
consolidate over the next few weeks, but if the fundamentals remain
bullish then a sustained break above the early-2017 high is likely within
the next three months. If/when that happens it should cause the
speculative demand for zinc-related equities to ramp up, leading to large
rises in the prices of many junior zinc-mining stocks.
There are
numerous junior zinc explorers and developers that would benefit from
increasing zinc-related speculation, but at this time Solitario Zinc (XPL)
is our sole stock pick in this area. XPL has a good mixture of
exploration-stage zinc assets and balance-sheet strength.
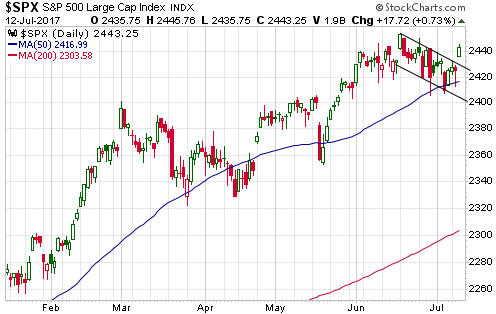
The Stock Market
The US
On Wednesday 12th July the SPX broke out to the upside from what now
appears to be a routine 3-week consolidation pattern.
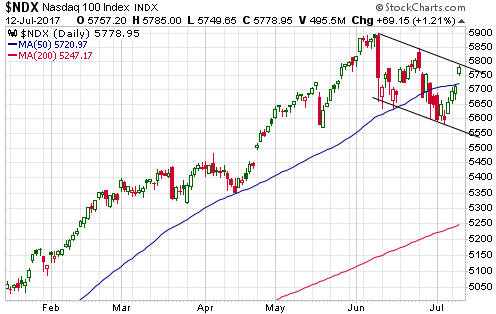
The NDX didn't break out to the upside on Wednesday, but it is close
to doing so and it has been strong enough to negate last week's break
below lateral support at 5650.
Both the SPX and the NDX remain below their June highs, so it's
possible that this week's strength will prove to be part of a
counter-trend rebound. It's also possible that one or both of these
indices will make new highs within the coming week and then reverse
downward almost immediately.
The latter of the aforementioned
possibilities (a false/misleading upside breakout) would be similar to
what happened at this time two years ago, when the NDX clearly broke above
a well-defined resistance level to a new high for the year three days
prior to the start of a 5-week plunge. Here's the relevant chart:
Regardless of these realistic bearish possibilities, short-term
traders should keep bearish speculations on a tight leash. The reason is
that even if the stock market is destined to be much lower 6 months from
now, it could move sharply higher over the coming 1-2 months as part of a
final speculative fling.
As previously advised, the QID (2X inverse
QQQ) trade in the TSI Stocks List will be exited if the NDX closes at or
above 5910.
Commodity-related equities
Although there have recently been signs of a speculative shift toward
"inflation" plays, many commodity-related equities remain in consolidation
mode. As mentioned above with regard to zinc stocks, this creates an
opportunity. Specifically, if metals such as zinc and copper break above
their early-2017 price highs then the associated equities should
experience strong rallies.
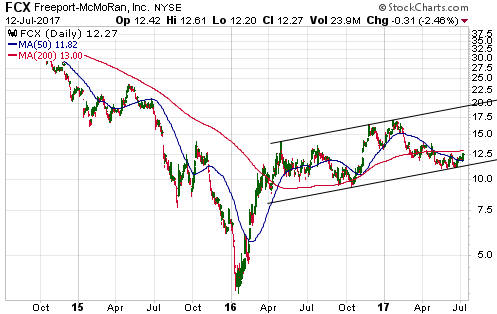
We usually concentrate on the small-cap
stocks, because this is where the greatest mispricing tends to occur. That
being said, Freeport McMoran (FCX), the world's largest publicly-traded
copper producer, could be a reasonable short-term or intermediate-term
speculation at this time. This is due to its chart pattern and the strong
potential for the copper price to make a new multi-year high within the
next few months.
The following chart shows that FCX has essentially
been consolidating with a slight upward bias for more than a year. The
pattern suggests the potential for a rise to at least $20 within 6 months,
but to maintain this potential the price must not close below $11.00.
Gold and the Dollar
Gold
In
the TSI commentary posted on Sunday 9th July we guessed that at least a
1-2 week rebound would get underway early this week. Such a rebound
appears to have begun following a spike to a marginal new low for the move
on Monday.
At this stage there's no reason to anticipate anything more than a
2-week (or thereabouts) rebound prior to the start of a decline to new
multi-month lows, but, as always, we'll try to take the evidence as it
comes. The evidence will include the evolving fundamental and sentiment
backdrops.
With regard to sentiment, the COT numbers scheduled to
be reported this Friday will be very interesting for both gold and silver.
This is because they will show how the speculating community reacted to
the breaches of important support levels that occurred late last week.
Evidence of speculator capitulation would be helpful to the bullish
case.
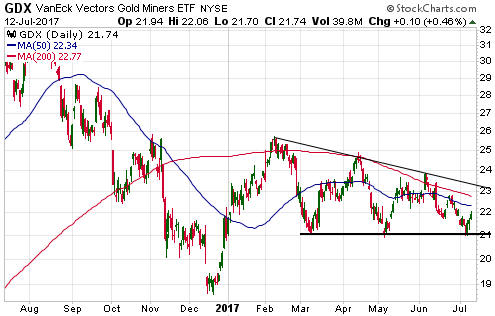
Gold Stocks
The gold-mining sector
has started to rebound as expected. In the case of GDX (the Gold Miners
ETF), the rebound has begun from support defined by the March and May
lows.
We are probably dealing with a counter-trend rebound prior to
a decline to new multi-month lows. If so, the most likely places for the
rebound to end are the 200-day MA and the downward-sloping trend-line
linking the February, April and June peaks. By the same token, a solid
daily close above the aforementioned trend-line would suggest that our
short-term outlook is too pessimistic.
The Currency Market
On Wednesday 12th July the
Bank of Canada (BOC) made its first interest-rate hike in 7 years. It
boosted its targeted overnight rate by 0.25% -- from 0.50% to 0.75%. The
rate hike was clearly telegraphed by the BOC over the preceding few weeks
and should have been expected by everyone, but the Canadian dollar (C$)
still moved sharply higher in reaction to the news.
The C$'s
performance over the past two months is a good example of what can happen
after speculators pile onto one side of a trade. In this case, leveraged
speculators built up a record-high collective net-short position in C$
futures, most likely in response to the belief that Canada's property
bubble was in trouble. Canada's property bubble might be in trouble, but
this was not a good reason to make a huge bet against a currency that
reliably moves with global commodity trends.
Perhaps the C$ will
reach intermediate-term lateral support at 80 before embarking on a
sizable 'corrective' move to the downside, but with the daily RSI now at
its highest level in 3 years it probably makes sense for anyone trading
the C$ from the long side to make at least a partial exit.
In the wake of the UK general-election on 8th June the British Pound
dropped back to its 200-day MA near 126. It could have been worse, as this
constituted only a minor and short-lived breach of support in reaction to
evidence that the UK's political situation is much riskier than previously
believed.
Assuming (as we do) that an 8-year cycle low was put in
place by the Pound during the first quarter of this year, plausible
targets for an intermediate-term peak lie at 134 and 140.
Updates on Stock Selections
Notes: 1) To review the complete list of current TSI stock selections, logon at
http://www.speculative-investor.com/new/market_logon.asp
and then click on "Stock Selections" in the menu. When at the Stock
Selections page, click on a stock's symbol to bring-up an archive of
our comments on the stock in question. 2) The Small Stock Watch List is
located at http://www.speculative-investor.com/new/smallstockwatch.html
Chart Sources
Charts appearing in today's commentary
are courtesy of:
http://stockcharts.com/index.html
http://www.kitco.com/
![]()