![]()
![]()
![]()
![]()
- Interim Update 12th August 2020
Copyright
Reminder
The commentaries that appear at TSI
may not be distributed, in full or in part, without our written permission.
In particular, please note that the posting of extracts from TSI commentaries
at other web sites or providing links to TSI commentaries at other web
sites (for example, at discussion boards) without our written permission
is prohibited.
We reserve the right to immediately
terminate the subscription of any TSI subscriber who distributes the TSI
commentaries without our written permission.
Commodities
Lithium to be boosted by
European EV demand
When forecasting the growth rates of
Electric Vehicle (EV) sales and the associated rate of growth in the
demand for battery metals, the focus tends to be on China and the US.
However, the article posted
HERE makes the point that Europe is now leading the way in EV sales
growth and the demand for EV-related materials. Here is an excerpt from
the article:
"S&P Global Market Intelligence expects global
lithium demand to increase by 91 per cent from 2019 to 2024, reaching
536,000 metric tonnes of lithium carbonate equivalent.
Electric
vehicles are expected to account for nearly three-quarters of that demand
increase. Global passenger electric vehicle sales are expected to rise to
6.2 million units in 2024, about three times higher than in 2019.
Market watchers have focused on this year's sales slump in China and North
America, but the EU has quietly gone the other way: there was a 69 per
cent year-on-year surge in European passenger electric vehicle
registrations in the first five months.
With France and Germany
trowelling on the subsidies for electric vehicle producers and buyers, S&P
reckons sales growth could hit 45 per cent during 2020, even in the midst
of the massive pandemic-led economic contraction."
The
following chart shows that the multi-year bearish trend in the lithium
price has not ended, but even based on what we think are conservative
estimates of future EV sales it could end this year and should end by the
first half of next year at the latest. When it does it is reasonable to
expect that the upward trends in the stock prices of lithium
producers/developers that got underway over the past several months will
accelerate.
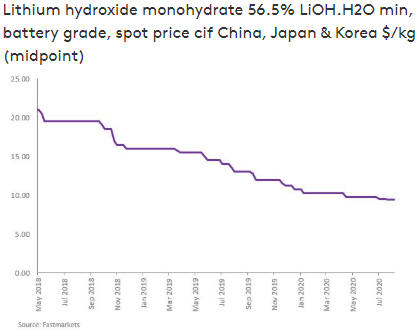
Source:
https://www.fastmarkets.com/
Our favourite lithium stock at
this time is Galaxy Resources (GXY.AX). GXY has current production at a
hard rock lithium mine in Western Australia, which means it will gain an
immediate financial benefit when the lithium market turns the corner, and
has huge organic growth potential due to its ownership of a
development-stage lithium-brine project in Argentina.
We also like
European Metals Holdings, which was mentioned in the above-linked article
and trades on both the ASX and the AIM (London market) under the symbol
EMH.
EMH owns 49% of the Cinovec project in the Czech Republic
(CR). This project has the largest hard rock lithium deposit in Europe and
the fourth-largest hard rock lithium deposit in the world. According to a
PFS completed in June-2019, at a cost of US$483M the Cinovec deposit could
be developed into a mine that produces 25,300 tonnes/year of lithium
hydroxide or 22,500 tonnes /year of lithium carbonate. Assuming a lithium
hydroxide price of US$12.00/kg, the post-tax NPV(8%) and IRR were
estimated in the PFS to be US$1.1B and 29%, respectively. The current
lithium hydroxide price is only US$9.40/kg, but we wouldn't have any
interest in lithium mining stocks if we didn't expect that the lithium
hydroxide price will be above US$12.00/kg within two years.
Based
on the PFS figures, EMH's 49% stake in the Cinovec project is worth about
US$550M (A$760M at the current exchange rate). Applying a risk discount of
50% and dividing by the current EMH share count (156M) gives us a
potential value of A$2.40/share for EMH at a lithium price of US$12/kg.
EMH currently is trading at A$0.30/share, so there is massive
valuation-related upside.
Adding to EMH's speculative appeal is the
fact that the other 51% of the project is owned by CEZ, a large industrial
corporation (2019 EBITDA of 2.4B euros) headquartered in Prague (the
capital of the CR). CEZ is 70% owned by the Czech State, so in effect
EMH's partner is the Czech government. This should make permitting fairly
straightforward. Also, CEZ purchased its stake earlier this year via an
investment in the project of 29M euros. This investment should mean that
the project is fully funded through to a construction decision sometime
next year.
GXY is a current TSI stock. EMH may be added to the TSI Stocks List in
the future, but for now we will put it in the
TSI Small Stocks Watch List.
Platinum price to be
supported by declining SA production
Platinum demand is
immersed in a long-term decline, but that didn't stop the platinum price
from rebounding to US$1,000/oz from a March-2020 low in the US$500s and in
our opinion won't stop the price from continuing to trend upward over the
coming 12 months. The drivers of the upward trend have been, and should
continue to be, a flood of new money courtesy of central banks (mainly the
Fed) and declining production in South Africa (SA).
The Bloomberg
article posted
HERE addresses the latter of the above-mentioned price drivers. The
article points out:
"Beset by power and water shortages,
alongside whipsawing government policies, South African producers have cut
spending over the past decade on mines responsible for 75% of global
platinum supply."
And:
"Platinum output peaked in
2006, and the lack of investment in deep-level western limb shafts will
result in a further sharp contraction in production over the next 10
years."
There is also the fact that the labour-intensive
mining that happens in South Africa has been made less efficient by the
COVID-related requirement to have greater distances between workers.
The following chart shows that the platinum price has pulled back
after testing resistance defined by its highs of the past 3 years. The
short-term risk/reward is neutral, but the intermediate-term risk/reward
remains bullish.
Oil is close to an upside breakout
The oil
price has moved slightly above long-term support/resistance at US$42.00,
but it hasn't managed to get above its 200-day MA yet. On Wednesday 12th
August it closed exactly at its 200-day MA.
We remain
intermediate-term bullish on oil, but the next $5-$8 move could go either
way. A daily close above the 200-day MA would suggest that it will be to
upside.
Industrial commodities such as oil and copper have been outperforming
gold since April. After the T-Bond yield embarks on a rising trend, which
may have just happened, the outperformance should become more pronounced.
The Stock Market
The S&P500 Index crashed during
the first quarter of this year without going through a "crash pattern"
involving a major high, an initial decline, a rebound that retraces
50%-100% of the initial decline, and a second decline that turns into a
crash after the low of the initial decline is breached. However, the
broader NYSE Composite Average (NYA) did follow the typical crash pattern,
with a major high in mid-January, a secondary (slightly lower) high in
mid-February and then a crash in March, with the whole process taking
about two months. Note that two months is the same amount of time that it
took for crash patterns to complete in 1929 and 1987.
Following
the 1929 crash there was a rebound lasting almost exactly 6 months and
then a downward trend lasting more than two years that didn't bottom until
the Dow Industrials Index (Dow) was trading at only 10% of its 1929 peak.
Here's a daily chart that shows the Dow's peak-to-trough performance
during 1929-1932.
Source:
https://www.macrotrends.net/2484/dow-jones-crash-1929-bear-market
Due to the fact that we now have massive monetary inflation as opposed
to the monetary deflation that characterised the 1930-1932 period, a
repeat of 1930-1932 will NOT happen over the next couple of years.
However, it's more than a little interesting that the NYA has followed the
Dow's 1929-1930 path quite closely up until now. This is illustrated by
the following chart. The chart compares the NYA from its 17th January 2020
peak with the Dow from its 3rd September 1929 peak.
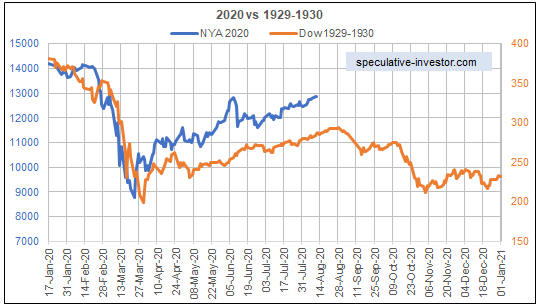
If the similarities between the present and 1929-1930 persist in the
short-term, then the rebound from the March-2020 low will end within the
next two weeks and the next tradable low will coincide roughly with the US
Presidential election in early-November.
We wouldn't bet heavily on
the similarities being maintained, but the above chart comparison adds to
the existing reasons to view the short-term risk/reward as decidedly
skewed towards risk.
Due to the high short-term risk, we are adding
a new bearish speculation to the TSI List. There already is an IWM
(Russell2000 ETF) October-2020 put option in the List, but on a short-term
basis we think that QQQ (the NASDAQ100 ETF) has greater downside
potential. Therefore, we are adding QID, a leveraged ETF that moves
inversely to QQQ, at Wednesday's closing price of US$10.28 (see chart
below). In an effort to get more bang for the buck, we also are adding the
QID October-2020 US$11.00 call option at Wednesday's closing price
(US$0.80). The plan at this time is to:
1) Average into the bearish
positions over the next two weeks.
2) Take a profit on the QID call
option during September.
3) Hold the ETF itself until around the
time of the US election.
Note that due to the strong positive
correlation between the NDX and the HUI, in addition to being bearish
speculations the QID positions mentioned above could be used to hedge a
gold stock portfolio.
Gold and the Dollar
Gold
In
the 3rd August Weekly Update, we wrote:
"...we will be
surprised if the gold price does not trade $100-$300 below its current
price within the next three months."
When we made the above
comment the price was US$1986. Despite subsequently trading about $100
higher, the gold price already has traded $110 below the aforementioned
level. This represents a huge increase in volatility, with the steady
advance of mid-July through to early-August replaced by dramatic intra-day
swings.
The following daily chart shows that by early-August the
gold price had moved well above long-term resistance defined by its 2011
high and that over the past four trading days it returned to this former
resistance (now support) in spectacular fashion. The chart also shows that
this new lateral support level survived a test over the past two days, as
did the 20-day MA.
It's unlikely that the downward spike and upward reversal on Wednesday
12th August marked the end of a correction, but it probably marked the end
of the first part of a correction. Our guess is that there now will be a
rebound lasting anywhere from one to three weeks followed by a decline
that takes out this week's low. The rebound, assuming it happens, should
be viewed as a short-term selling opportunity.
Silver
We rarely use the "crash" word when discussing what's likely to happen
in a market. We used it multiple times in January-February of this year
when discussing the gold mining sector's short-term prospects and we used
it in the latest Weekly Update when discussing silver's short-term
prospects. Specifically, in the latest Weekly Update we wrote: "It
looks like the silver market is setting up for a crash...".
It's debatable whether silver's price plunge from last Friday's high near
$30 to Wednesday's low of $23.58 qualifies as a crash. A price decline of
more than 20% within the space of four trading days certainly would be a
crash in some markets, but within the context of the current manic silver
market it possibly could be viewed as nothing more than a pullback. After
all, it didn't even result in a daily close below the 20-day MA.
Although it hasn't yet registered a daily close below the 20-day MA,
the ferocity of silver's reversal from last Friday's high is evidence that
a multi-month price top is in place. It would be normal for the initial
decline from the high to be followed by a rebound that retraced 50%-100%
of the initial decline, after which a larger decline would begin. As is
the case with gold, this rebound, assuming it happens, should be viewed as
a short-term selling opportunity.
As stated in the latest Weekly
Update, we suspect that the correction in the silver market will take the
price down to the vicinity of the 200-day MA. The 200-day MA presently is
at $17.71, but it is rising and probably will reach lateral support at $19
by October. There is also support at around $21 that could come into play
within the next few weeks.
Gold Stocks
Current Market Situation
In the
latest Weekly Update, we wrote:
"...we are into the one-month
time window that has provided either the annual high or the annual low for
the HUI in each of the past five years. Clearly, if this cyclical tendency
remains in force then the early-August through to early-September period
of 2020 will contain an important high. The high could have been set by
the HUI's spike to 374 last Wednesday or it could be set within the next
four weeks.
In any case and as mentioned in previous commentaries,
it will be reasonable to assume that the short-term upward trend is intact
until the HUI ends a day below its 20-day MA. This moving average
currently is at 338."
The first of the following daily charts
shows that the HUI closed below its 20-day MA on each of the past two
trading days. Furthermore, the second of the following charts shows that
the HUI/gold ratio has broken below its 40-day MA. This is clear-cut
evidence that a multi-month price top was set by the HUI's spike to 374
last Wednesday (5th August).
The HUI has support at 300-310, 286 and 260. Our guess at this time is
that the lowest of these support levels will come into play before the
correction ends.
There could be a rebound over the coming 1-3 weeks
that retraces 50%-100% of the decline from last week's high, but we don't
think it makes sense to buy in anticipation of such a rebound. The reason
is that despite the significant pullback of the past few days, the
short-term risk/reward is neutral at best.
What to do?
Over the past few
weeks, managing our holdings of gold stocks and other commodity-related
equities has been more of a balancing act than usual. We have been trying
to make hay while the sun shines, but at the same time we have been
preparing for the dismal weather to come.
We have been preparing
for the coming 'bad weather' by taking money off the table as short-term
selling opportunities presented themselves. In addition, we have a plan to
purchase some insurance in the form of put options later this month if
there's a decent rebound from this week's lows in the gold mining ETFs.
As per our money management practice, we also have maintained
significant (core) exposure to "inflation" plays. This is because much
higher prices are likely during the first half of next year and there's
always the risk that things will happen faster than we expect. Note that
gold mining stocks can benefit from rising "inflation" expectations, but
industrial-metals mining stocks are better suited to such conditions
until/unless there is a major decline in monetary confidence.
The Currency Market
The Dollar Index (DX) appears
to be basing, but it must close above 94.0 to signal an upward reversal.
Updates on Stock Selections
Notes: 1) To review the complete list of current TSI stock selections, logon at
http://www.speculative-investor.com/new/market_logon.asp
and then click on "Stock Selections" in the menu. When at the Stock
Selections page, click on a stock's symbol to bring-up an archive of
our comments on the stock in question. 2) The Small Stock Watch List is
located at http://www.speculative-investor.com/new/smallstockwatch.html
![]() Input
Capital (INP.V) to be acquired
Input
Capital (INP.V) to be acquired
In the latest Weekly Update
we suggested buying the shares of Input Capital (INP.V), an agriculture
streaming company, due to the large discount to book value at which the
shares were trading (the stock was trading at C$0.80 and the per-share
book value was estimated to be about C$1.33). Congratulations to those who
followed our suggestion, because thanks to a C$1.75/share all-cash
takeover bid announced after the close of trading on Wednesday 12th August
you have just doubled your money in three days on a relatively low-risk
speculation.
Chart Sources
Charts appearing in today's commentary
are courtesy of:
https://stockcharts.com/
http://bigcharts.marketwatch.com/
![]()