|
- Interim Update 12th September 2012
Copyright
Reminder
The commentaries that appear at TSI
may not be distributed, in full or in part, without our written permission.
In particular, please note that the posting of extracts from TSI commentaries
at other web sites or providing links to TSI commentaries at other web
sites (for example, at discussion boards) without our written permission
is prohibited.
We reserve the right to immediately
terminate the subscription of any TSI subscriber who distributes the TSI
commentaries without our written permission.
Demographics, Debt and Deflation
The 11th September edition of John Mauldin's Outside the Box
letter contains the transcript of a speech by Harry Dent titled "Demographics,
Debt and Deflation". Dent's conclusion is that deflation lies
ahead; no doubt about it. Our view is that unequivocal conclusions
about what the future holds in store may well be good for selling
books and newsletters, but are generally imprudent when it comes to
practical investing/speculating. That's particularly so in this
case, because there are good reasons to expect that more inflation
lies ahead.
One of Dent's arguments goes like this: We got deflation following
the bursting of a debt bubble in the early-1870s and we got
deflation following the bursting of a debt bubble in the late-1920s.
We will therefore get deflation in the aftermath of the debt bubble
that burst in 2007-2008.
In general terms, the logic of the above argument is similar to the
logic of: the last two times I fired the gun at my head there wasn't
a problem because the gun wasn't loaded, so the next time I won't
even bother checking for a bullet before pulling the trigger. It is
always important to check the facts before assuming that history
will repeat. That's especially so in this case, because there are
huge differences between the present situation and the situations
during the 1870s and the 1930s. Moreover, the differences between
the 1870s and the 1930s were so great that lumping these two
historical periods together makes no sense. Massive monetary
deflation in the early 1930s caused producer and consumer prices to
plummet, but the deflationary phase of the depression was over by
1933. After that, prices began to trend upward in response to the
combination of increasing money supply and weak real economic
progress. The "deflation" that began in the early 1870s, however,
was driven by strong real progress in the economy combined with
modest expansion of the money supply. More specifically, the
financial crisis and severe recession of 1873-1875 was followed by
the strongest 20-year period of real economic growth in US history.
The pace of real economic growth was consistently higher than the
pace of money-supply growth throughout this period, leading to
downward trends in producer and consumer prices.
It seems to us that the current situation doesn't compare well with
either the 1870s or the 1930s. Due to the aggressive economic
interventionism of the federal government the current situation is
more like the 1930s than the 1870s, but the monetary backdrop could
hardly be more different now than it was in the 1930s. In
particular, we cite the fact that during the three-year period
following the stock market crash of 1929 the US money supply shrank
by about 30%, whereas during the three-year period following the
crash of 2008 the US money supply expanded by about 45%. This huge
difference in the monetary backdrop guaranteed a huge difference in
the outcome for prices. This time around, equity and commodity
prices have been a lot stronger and the US$ has continued to lose
purchasing power despite the "great de-leveraging".
We put "great de-leveraging" in quotation marks because a lot of
people have applied this label to what happened over the past
several years, but the facts don't support the notion that the
de-leveraging of the past several years has been great. As evidence
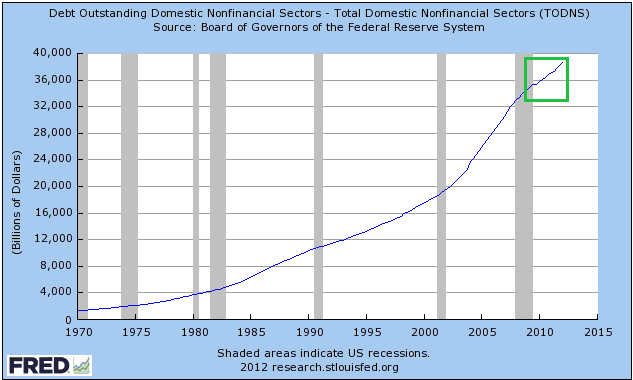
we present, below, a chart from the St Louis Fed showing total
non-financial debt in the US (the total non-financial debt is the
combined debt of households, non-financial businesses and the
government). The "great de-leveraging" is the period inside the
green box. If you look very closely you might be able to see a small
stutter and a slight fall in the rate of debt growth during this
period, but total debt has clearly continued to rise.
In his "Demographics, Debt and Deflation" speech, Harry Dent says:
"Think of it this way: the government is hellbent on inflating.
It's doing so by creating debt through its quantitative easing
programs (just for starters). But what's the private sector doing?
It's deflating.
And the private sector is definitely the elephant in the room. How
much private debt did we have at the top of the bubble? $42
trillion. How much public debt did we have back then? $14 trillion.
That looks like a no-brainer to me. Private outweighs public three
to one. And the private sector is deleveraging as fast as it can,
just like what happened in the 1870s and 1930s. History shows us
that the private sector always ends up winning the
inflation-deflation fight."
The private sector is definitely de-leveraging, but at this stage it
is obviously not winning. The reality is that total debt is still
trending upward. Furthermore, history doesn't show us that the
private sector always ends up winning the inflation-deflation fight.
To determine the likely winner of this fight you must take the
monetary system into account. History actually shows us that when
the government is hell-bent on inflating and is unhampered by a link
to gold, more inflation is the likely outcome.
Dent puts a lot of emphasis on demographics, but in our opinion this
puts the cart before the horse. Our view is that demographics are
driven by economics, not the other way around (there are always
economic reasons for major changes in demographics). In any case,
all else being equal the "general price level" should rise by more
in response to growth in the money supply if demographic changes
lead to the population becoming less productive.
Based on what has transpired over the past few years there is no
longer any doubt that the central monetary and fiscal planners are
capable of keeping the inflation going in the face of private-sector
de-leveraging. They've done exactly that! Therefore, the relevant
question is: Since there is no doubt that they can keep the
inflation going, why won't they?.
Germany's Constitutional Court stays out of the way
Prior to this week there was a small risk that
Germany's Constitutional Court would rule against Germany's participation in the
European Stability Mechanism (ESM), a supranational fund set up to ensure
never-ending instability in Europe (actually, the fund was established to ensure
that there will be 100s of billions of additional euros available to support
government bonds and bail out bondholders). This risk was removed on Wednesday
12th September when the Court ruled that the German President could sign off on
the ESM. The only condition imposed by the Court is that Germany's financial
commitment to the ESM cannot exceed 190 billion euros unless a more costly
commitment is first approved by the German parliament.
The elimination of the risk that Germany's Constitutional Court would 'throw a
spanner into the works' helped buy a little more time for the equity, commodity
and high-yield bond bulls.
Oil Update
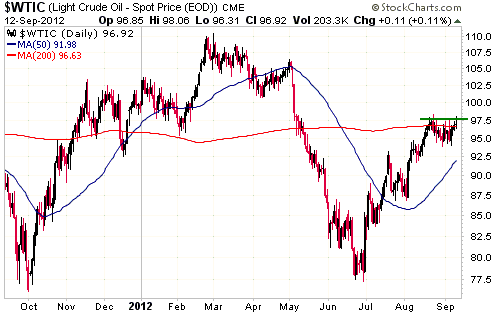
The oil price has rebounded strongly from its
June low. There is no evidence in the price action (see chart below) that the
rebound has peaked, but in the absence of a Middle-East-related supply shock
there doesn't appear to be much additional upside potential on either a
short-term or an intermediate-term basis. If the Fed announces a stupid new
inflation program at the conclusion of this week's FOMC meeting then the oil
price could quickly move up to $100-$103 as speculators pile into inflation
hedges, but we doubt that it would do significantly better than that.
The only thing that prevents us from being short-term bearish on oil right now
is the risk of a Middle-East-related supply shock.
 The Stock Market
Miraculous Recovery
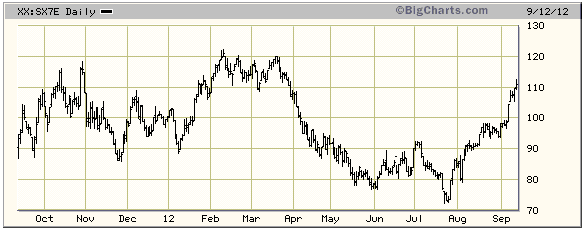
The SX7E is a proxy for European bank stocks. In our 24th July commentary, with
the SX7E trading at its lowest level in more than 13 years, we wrote:
"The past performances of the SX5E [the EURO STOXX 50 Index] and SX7E are so
bad that future performance will almost have to be better. To put things into
perspective, the Banks Index is down by about 85% in nominal terms and by more
than 90% in real terms since its 2007 peak, which compares to a peak-to-trough
real loss of about 70% for the Dow Industrials Index during the 1929-1932
collapse.
The stocks of many European banks will end up going to zero, but the index won't
go to zero. The risk for the eurozone's economy is that the ECB will destroy
plenty of good non-bank businesses in its efforts to keep insolvent banks
afloat."
We thought that future performance would be an improvement over past
performance, but we didn't anticipate the miraculous recovery that began almost
immediately. In the 7 weeks since we wrote the above the SX7E has gained more
than 50%. As illustrated by the first of the following daily charts, it is now
back to where it was in late March of this year and is within 10% of a 12-month
high.
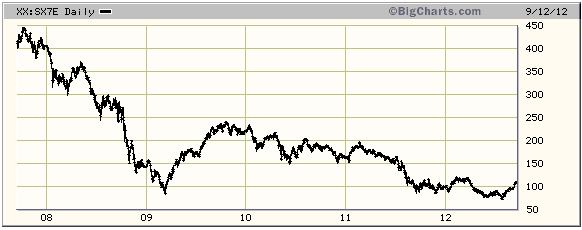
Although the rebound has been immensely profitable for anyone who was smart
enough or lucky enough to have bought European bank stocks in late July, it
looks much less impressive on the second of the following daily charts. The
second chart shows the SX7E's performance over the past 5 years.
The only lesson here is that it's dangerous to bet against markets that are
dramatically 'oversold', especially in cases where the market is a likely
recipient of central bank support.
Current Market Situation
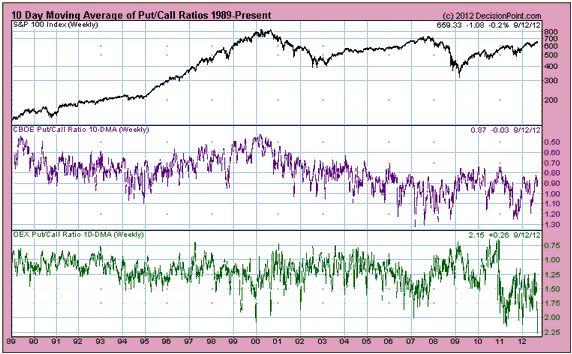
The equity put/call ratio and the OEX (S&P100 Index) put/call ratio are very
different indicators of sentiment. The trading of equity options is dominated by
the public (the "dumb money"), so a high equity put/call ratio should be viewed
as bullish. It should be viewed as bullish because it means that the "dumb
money" is very worried about downside risk and the "dumb money" is always wrong
at extremes. The trading of OEX options, however, is dominated by professional
hedgers (the "smart money"), which means that a high OEX put/call ratio should
be viewed as bearish.
The bottom section of the following chart shows that the 10-day moving average
of the OEX put/call ratio just hit its highest level in more than 20 years. This
doesn't mean that the market is about to collapse, it simply means that the
concern about downside risk on the part of the "smart money" is uncommonly high
right now.
Every trader and his dog are now waiting with bated breath for the 13th
September FOMC announcement and ensuing Bernanke press conference. Will "QE3" be
introduced? Probably not, but maybe the decision not to do anything immediately
will be phrased in such a way that speculators continue to buy in anticipation
of another monetary flood. Regardless of what comes out of the Fed, if it
prompts a reactionary price surge then short-term traders should view it as a
selling opportunity.
Gold and the Dollar
Gold
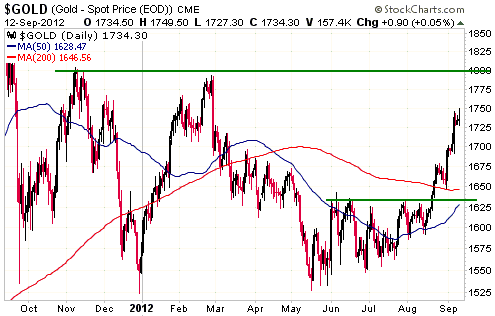
Gold and silver drifted in narrow ranges over the first three days of this week.
It seems that most bulls and bears are holding their positions ahead of the Fed
statement.
If the Fed introduces a new inflation program or sustains the belief that a new
inflation program is coming without announcing anything specific, then gold
could quickly rise to around $1800. If this happens it should be viewed as
either a short-term selling opportunity or an opportunity to sit back and watch
with detached amusement. It definitely shouldn't be viewed as a buying
opportunity.
If the Fed disappoints then gold could drop back to the mid-$1600s over the
coming 1-2 weeks. We don't think gold will do any worse than that because even
if the Fed doesn't signal the immediate re-start of the printing presses its
language will be conciliatory and monetary conditions are already ultra-easy.
Platinum Update
In the 20th August Weekly Update we wrote that the Physical Platinum ETF (PPLT)
was worth considering for a multi-week long-side trade due to the potential for
a strong rebound from an 'oversold' extreme driven by news out of South Africa.
PPLT has since gained about 12% and is now ripe for some profit-taking.

Gold Stocks
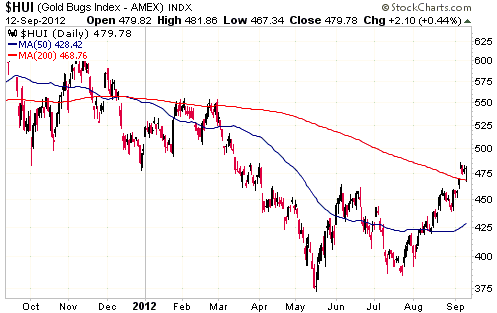
The HUI consolidated just above its 200-day moving average over the first three
days of this week. Depending on what the Fed says, the HUI could have a '5'
handle before the end of this week. It could also drop back to 430s, although
former resistance at 460 should now offer good support.
Currency Market Update
The Dollar Index is 'oversold' on a short-term basis, but is stretching its
decline in reaction to increasing optimism about Europe's government debt
situation and in anticipation of the Fed ushering in a new inflation program. We
expect that any additional downside from here in reaction to the 13th September
Fed news will prove to be an overshoot that will quickly be retraced next week.
Update
on Stock Selections
Notes: 1) To review the complete list of current TSI stock selections, logon at
http://www.speculative-investor.com/new/market_logon.asp
and then click on "Stock Selections" in the menu. When at the Stock
Selections page, click on a stock's symbol to bring-up an archive of
our comments on the stock in question. 2) The Small Stock Watch List is
located at http://www.speculative-investor.com/new/smallstockwatch.html
 A
small gold stock worth following (and buying): Golden Predator (TSX: GPD).
Shares: 144M issued, 170M fully diluted. Recent price: C$0.31 A
small gold stock worth following (and buying): Golden Predator (TSX: GPD).
Shares: 144M issued, 170M fully diluted. Recent price: C$0.31
GPD is a small gold miner that we've been tracking for a while. Up until now we
have considered it to be too small and illiquid to be added to the TSI Stocks
List, but with the continuing downward drift in its stock price having created
unusually good value and with the stock's daily trading volume having risen of
late we have decided to 'pull the trigger'. GPD has been added to the TSI List
at Wednesday's closing price of C$0.31.
GPD has multiple strings to its bow. The
company presentation is up to date and contains all the important details,
but three simple aspects of the GPD story have prompted us to add it to the TSI
List and highlight it as a speculative opportunity at this time.
First, the company has a reasonable shot at moving its Brewery Creek project in
Canada's Yukon into production over the next two years. This fully-permitted
project has a total gold resource of around 900K ounces, which should increase
to more than 1M ounces when the next estimation is completed during the final
quarter of this year. The economics of the project are being established via a
Pre-Feasibility Study (PFS) that is also scheduled to be completed during the
final quarter of this year. There's a good chance that the PFS will show that
the Brewery Creek project is worth considerably more than GPD's current market
capitalisation.
Second, the company has a reasonable balance sheet (no debt, about $10M of
working capital).
Third, the company has something that very few small exploration-stage gold
miners have. Many exploration-stage gold miners are under-valued and some of
these under-valued miners have strong balance sheets, but they generally don't
have gold/silver royalty portfolios. GPD has such a portfolio. Moreover, one of
the royalties in this portfolio (the 4% gross production royalty on Midway
Gold's Pan project in Nevada) will have a net present value of at least $30M
(assuming a gold price of $1600/oz) when the underlying project goes into
production. The current plan is for the project to be brought into production in
mid-2014.
At its current market capitalisation of around $46M we wouldn't be interested in
GPD if all it had were its exploration-stage Yukon-based gold projects. The
stock looks cheap based only on these assets, but there are other stocks with
better projects that look just as cheap. It's the combination of the Yukon
projects and the royalty portfolio that appeals to us.
We can envisage GPD's gold royalty portfolio achieving a market value of at
least $50M by this time next year. Brewery Creek's valuation will be difficult
to estimate until the results of the PFS are published later this year, but at
this stage we are using a ballpark valuation range of $50M-$100M assuming the
development over the next 2 years of a 50K-100K-oz/year gold mine. We also need
to add something for GPD's huge land position in the Yukon. GPD controls about
1M acres of Yukon mining claims, which, as far as we can tell, makes it the
Yukon's largest claim-holder. It is extremely difficult to put a $ figure on the
value of this claim package, but it is probably worth $10-$20M now and could be
worth a lot more in the future.
Further to the above, our back-of-the-envelope valuation for GPD (the only type
of valuation that is possible at this early stage of the company's development)
is $150M. This gives us a rough 12-month valuation-based target of C$1.00/share,
about 200% above the current stock price.
The other consideration is the downside risk, which we think has become small
thanks to the fact that GPD's stock price has continued to slide while the
prices of many other gold stocks have rallied over the past few weeks. As a
result of its recent poor stock-market performance, which, by the way, appears
to be unrelated to on-the-ground progress, more than 100% of the company's
market capitalisation is now covered by cash in the bank and the likely value of
the royalty portfolio.

 International Tower Hill Mines (AMEX: THM, TSX: ITH). Shares: 97M
issued, 103M fully diluted. Recent price: US$2.85
THM's rebound from its early-August low has been relatively weak. We
suspect that this relative weakness has a lot to do with the second
tranche of an equity financing. The price of this $5M tranche wasn't
agreed up front. Instead, it was to be based on the average price of
the stock over the five trading days ended 10th September. This
financing should now have been 'put to bed', which should remove
some weight from the stock and hopefully allow it to trade in a more
positive way.
THM is a reasonable candidate for new buying, especially if it drops
back to the US$2.70s.

 We added Ryan Gold (TSX: RYG) to the TSI Small Stocks Watch List (SSWL)
in mid-May. At that time its market capitalisation was slightly less
than the amount of cash it had in the bank, meaning that its mining
claims were being assigned zero value by the stock market. The
company's large cash reserve meant that there was very little
downside risk, but the drilling program still had to deliver some
good results to generate meaningful upside.
About half the results from this season's drilling program were
reported early this week. While they weren't bad, they also weren't
very interesting. There's always a possibility that the next set of
drill holes will contain a great discovery that excites the market,
but we usually steer clear of pure drill plays.
We have removed RYG from the SSWL.
Chart Sources
Charts appearing in today's commentary
are courtesy of:
http://stockcharts.com/index.html
http://www.decisionpoint.com/
http://bigcharts.marketwatch.com/

|

