![]()
![]()
![]()
![]()
- Interim Update 12th September 2018
Copyright
Reminder
The commentaries that appear at TSI
may not be distributed, in full or in part, without our written permission.
In particular, please note that the posting of extracts from TSI commentaries
at other web sites or providing links to TSI commentaries at other web
sites (for example, at discussion boards) without our written permission
is prohibited.
We reserve the right to immediately
terminate the subscription of any TSI subscriber who distributes the TSI
commentaries without our written permission.
Getting exposure to
food
We are long-term bullish on the
prices of food commodities, especially the grains. However, it is not easy
to obtain long-term exposure to food commodities via the major financial
markets, at least not in a cost-effective way.
Getting short-term
exposure to grain prices is straightforward. It can be done by purchasing
futures or by purchasing ETNs/ETFs such as JJGTF (iPath Grains Total
Return ETN) and DBA (Invesco DB Agriculture Fund). The problem with trying
to invest for the long-term via commodity futures or funds that hold
commodity futures contracts is that under normal market conditions there
will be regular value leakage due to the "futures roll*". This leads to
the investment performing much worse than suggested by the performance of
the spot commodity price.
For example, JJGTF has performed much
worse since its inception than the spot prices of the grains it is
designed to track. In particular, whereas the spot prices of corn,
soybeans and wheat have approximately gone sideways over the past four
years, the first of the following charts shows that JJGTF has been in a
strong downward trend over this period. The second of the following charts
shows that DBA hasn't fared any better.
An alternative to buying funds that hold the commodity futures would
be to buy shares of the companies that produce the commodities. The
problem is that the most likely reason for a huge rally in grain and other
food-related commodity prices is reduced supply due to unseasonal weather
and/or changing climatic conditions. The implication is that high
commodity prices will coincide with lowered production and reduced
profitability for many producers. It will be impossible to predict which
producers will be left unscathed, and therefore in a position to profit
from, the weather conditions that bring about the supply disruption.
As far as we can tell, taking risk and potential reward into account
the best way to obtain LONG-TERM exposure to food commodities via the
major financial markets is to buy the shares of fertiliser producers.
These companies could benefit either from higher prices due to reduced
supply or from an increase in production.
It's obvious that we
aren't the only ones to figure this out given that the stock prices of
Nutrien Ltd. (NTR) and The Mosaic Company (MOS), two of the world's
biggest and best-known fertiliser producers, have been steadily rising
even though the prices of corn and soybeans are languishing near 9-year
lows. As illustrated by the following charts, NTR has been trending upward
since early-2016 and MOS has been trending upward since completing a
double bottom in Q3-2017. However, the charts also show that on a
long-term basis both NTR and MOS are much closer to the bottoms than to
the tops of the ranges that were established way back in 2008. Also, their
valuations are reasonable. This suggests that if new bull markets have
begun, they are still in their infancy.
If you are looking for long-term investments that will benefit from
rising agricultural-commodity prices and/or increasing global production
of food, the above stocks are good places to start. They will get dragged
down by the next meaningful decline in the broad stock market, but the
occasional sharp correction shouldn't be a problem for an investor
employing an averaging-in approach.
*When a
futures market is in "contango", which is the normal state of affairs for
most commodities, the contracts with later expiry dates have higher
prices. Consequently, 'rolling' from an earlier to a later futures
contract results in a loss.
Business optimism
continues to rise
The following chart shows that
the NFIB Small Business Optimism Index hit an all-time high last month.
Although this may well be as good as it gets, the implication is that the
US economy is a long way from commencing a recession (the last three
recessions didn't begin until after the Optimism Index dropped below 100).
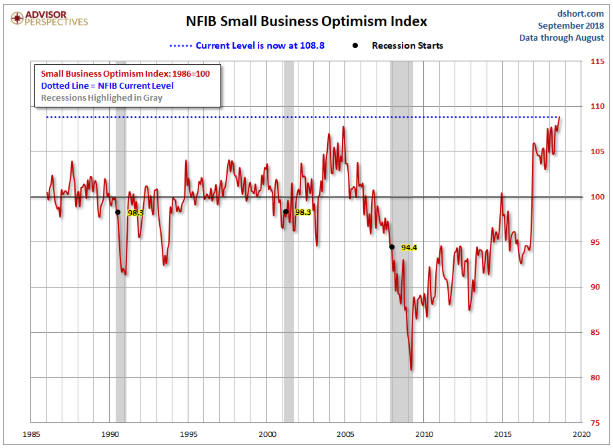
Chart source:
Doug Short
The Stock Market
The senior US stock indices did
nothing significant during the first three days of this week, but there
were some interesting developments beneath the surface.
The US
stock market has been rife with divergences over the past few months, one
of which is that strength in some of the high-profile stock indices has
gone with lacklustre performance on the part of the Bank Index (BKX). This
divergence became more pronounced on Wednesday 12th September, with the
BKX dropping below its 50-day and 200-day MAs (refer to the top half of
the following chart) and the BKX/SPX ratio dropping to within spitting
distance of its 12-month low (refer to the bottom half of the following
chart).
By the way, if you want a fundamental explanation for why
the gold market perked up on Wednesday, the sharp decline in the BKX/SPX
ratio is it. The relative strength of the banking sector is one of the
seven inputs to our Gold True Fundamentals Model (relative weakness in the
banking sector puts upward pressure on the gold price).
Critical
support for the BKX is near 104, or about 4% below the current price.
Here's a chart we haven't shown for about three months. It compares
the Bitcoin price (in green) with the S&P500 Index. The idea behind the
chart is that Bitcoin -- for whatever reason -- is leading the SPX and
that divergences are resolved by the SPX moving back into line with
Bitcoin. With Bitcoin near its low for the year and the SPX not far from
its high for the year, the current divergence is large and potentially
bearish for the SPX.
At this time we are following the Bitcoin-SPX
relationship more for the sake of interest than to identify trading
setups. The divergence is not something on which we would predicate a
bearish speculation, although there are reasons to expect a sizable move
in one direction or the other within the next few weeks and to suspect
that the direction will be down.
By the way, although the Bitcoin
price has fallen from around $20,000 in December-2017 to around $6,000
today, it has held up better than we thought it would. It essentially has
gone sideways since its December-January crash and is still up on a
year-over-year basis. This suggests that there is plenty of underlying
demand and that it would be premature to announce the death of the world's
first cryptocurrency.
Gold and the Dollar
Gold
The
US$ gold price broke above its short-term channel top on Wednesday 12th
September. Within $10 of Wednesday's closing price there is both lateral
resistance ($1220) and MA resistance (the 50-day MA), and above that there
is more lateral resistance at $1240.
We think that if the gold price achieves consecutive daily closes
above $1220 then it will work its way up to around $1280 over the ensuing
weeks. That's regardless of whether the fundamental backdrop turns bullish
or stays bearish.
Gold Stocks
The most
important gold-mining indices and ETFs made new 2-year lows on Tuesday
11th September and then rebounded quite sharply on Wednesday. So, what are
the chances that a multi-month bottom is now in place? Before answering
this question it's worth reviewing what happened to the gold-mining sector
over the past month, using GDX as the sector proxy.
In mid-August,
GDX's daily RSI(14) hit a rare extreme. As noted on the following chart,
it was the second-lowest level for this short-term momentum indicator in
10 years. We stated at the time that regardless of whether or not there
were new price lows over the weeks ahead, this would prove to be the
downward trend's momentum extreme.
Downward momentum extremes of
the sort experienced by GDX in August-2018 generally don't mark
sustainable price lows. More often than not there's a counter-trend
rebound and then a decline that tests or breaches the momentum price low
prior to the start of a tradable rally. With the momentum extreme in place
it goes without saying (but we'll say it anyway) that a decline to a new
price low would create a positive divergence between the RSI and the
price.
The rebound from the mid-August low was lacklustre and after
two weeks it still hadn't reached the 20-day MA. This indicated that it
was a counter-trend move and that a decline to new lows would occur either
in the near future or following a couple of months of upward drift. The
decline to new lows happened on 4th September, after which there was
additional downside and then a bottom on 11th September. Naturally, the
11th September bottom coincided with a higher low for the daily RSI, thus
creating the positive divergence mentioned above.
Which brings us back to the question: What are the chances that a
multi-month bottom is now in place?
The chances are good, because
we now have a) a new price low following a momentum extreme, b) a positive
divergence between price and momentum at this week's low, and c) a
divergence between gold bullion and the gold-mining sector at this week's
low (a higher low for gold alongside lower lows for the gold-mining
indices/ETFs).
The next question is: Assuming that at least a
multi-week bottom was put in place on Tuesday 11th September, what is a
reasonable upside target?
A reasonable initial upside target is the
50-day MA. For GDX this is a bit more than 10% above the current price.
The way the 50-day MA is reached will provide clues regarding whether
there is more upside to come. In particular, a fast move up to the 50-day
MA would suggest that there is significant additional short-term upside in
store whereas a slow/choppy rise to the 50-day MA would suggest that we
are dealing with another minor reaction within an on-going downward trend.
In the latter case, a rise to near the 50-day MA would create an
opportunity to buy put options to profit from or hedge against a decline
to new multi-year lows.
The Currency Market
It's possible that the Dollar Index (DX) and the euro are in the
process of completing H&S reversal patterns, with "possible" being the
operative word. This was discussed in the latest Weekly Update and nothing
has changed.
Due to its recent price action, the Australian dollar
(A$) is worthy of an update today.
As illustrated below, during
the first two trading days of this week the A$ spiked below the bottom of
a declining 'wedge'. Since the 'wedge' is steeply sloped, this has the
look of a downside blow-off. It also spiked below intermediate-term
lateral support.
Wednesday's rebound wasn't strong enough to mark
the preceding downside breakouts as false, but the potential is there.
Furthermore, the A$'s COT situation is very bullish.
It would be reasonable for risk-averse speculators to buy FXA here and
place an initial sell stop slightly below this week's low, whereas
aggressive speculators could consider buying FXA December-2018 $75 call
options. These options ended Wednesday's session at US$0.25-$0.35.
The TSI Stocks List contains an FXA September-2018 $80 call option
that will expire worthless at the end of next week. We are going to record
the loss and replace the expiring option with the one mentioned above,
using US$0.30 (the middle of the current bid-ask spread) as the starting
price for record purposes.
Updates on Stock Selections
Notes: 1) To review the complete list of current TSI stock selections, logon at
http://www.speculative-investor.com/new/market_logon.asp
and then click on "Stock Selections" in the menu. When at the Stock
Selections page, click on a stock's symbol to bring-up an archive of
our comments on the stock in question. 2) The Small Stock Watch List is
located at http://www.speculative-investor.com/new/smallstockwatch.html
Chart Sources
Charts appearing in today's commentary
are courtesy of:
https://stockcharts.com/
![]()