|
- Interim Update 12th October 2011
Copyright
Reminder
The commentaries that appear at TSI
may not be distributed, in full or in part, without our written permission.
In particular, please note that the posting of extracts from TSI commentaries
at other web sites or providing links to TSI commentaries at other web
sites (for example, at discussion boards) without our written permission
is prohibited.
We reserve the right to immediately
terminate the subscription of any TSI subscriber who distributes the TSI
commentaries without our written permission.
Copper Update
The copper market usually trends in the same direction as the broad stock market. In general, the stock and copper markets trend upward when speculators are anticipating easier monetary conditions and/or faster nominal economic growth. When speculators are anticipating tighter monetary conditions and/or slower nominal economic growth, both the copper market and the broad stock market trend downward.
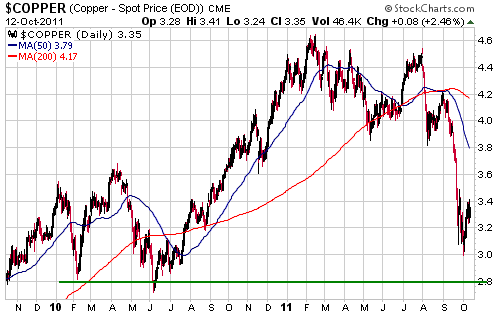
There's no evidence that the relationship described above is about to change, although we note that the copper market has recently been a lot weaker than the stock market. In particular, whereas the S&P500 Index has up until now made only a marginal and short-lived break below its August low, the following chart shows that the copper price broke out to the downside in September and fell a long way below its August low before beginning to rebound.
The next chart shows that the worldwide copper inventory (the sum of the copper inventories reported by the London, New York and Shanghai commodity exchanges) is in the top quintile of its 4-year range. This suggests that the copper price is not going to get any short-term support from tight physical supply.
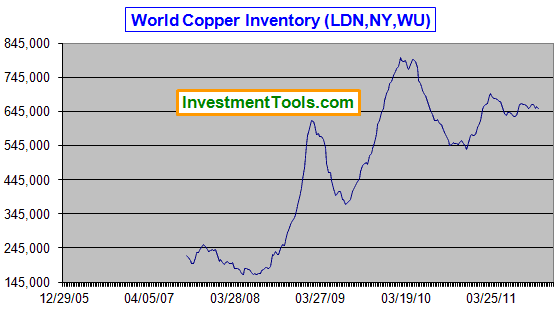
The fact that the copper market is in "contango" also points to the market being well supplied at this time.
Based on the way copper has been trading and on the physical supply situation, there's a good chance that speculative selling will push the copper price to new lows for the year when the stock market experiences its next significant decline. Support at US$2.80 appears to be a realistic short-term target. The Stock Market
Financial Reality
In the 3rd October Weekly Update we said that the S&P500's current P/E ratio of 14-15 would look reasonable if we made the assumptions that the economy will grow over the next 12 months and that today's high profit margins are sustainable. However, the first of these assumptions is questionable (to put it mildly) and the second is almost certainly wrong. The following chart relates to the second assumption.
History tells us that on an economy-wide basis, profit margins are mean reverting. In other words, elevated profit margins are followed by periods of margin contraction and depressed profit margins are followed by periods of margin expansion. This results in the sum of corporate profits, as a percentage of nominal GDP, oscillating on a long-term basis around a horizontal line as illustrated by the following chart. The chart was taken from a September-2011 report by CLSA's Russell Napier and shows after-tax US corporate profits as a percentage of GDP over the past 60 years.
One of the chart's messages is that the WORST time for long-term investors to increase their broad-based stock market exposure is when corporate profits are unusually elevated relative to GDP. The reason is that extreme highs in the profits/GDP ratio are invariably followed by 3-8 year downward trends in this ratio. Ominously, the profits/GDP ratio is presently not far from an all-time high. Another of the chart's messages is that US corporate earnings will probably fall over the next three years unless there is a large rise in US nominal GDP.
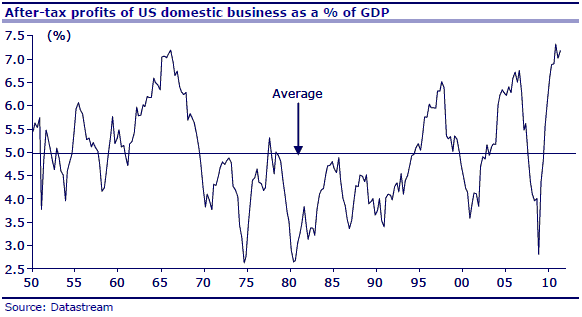
Two caveats go along with the above chart. First, although bear markets tend to begin no later than two years from a peak in the profits/GDP ratio, the ratio cannot be used as a market timing tool. Second, the reported profits of S&P500 companies usually peak well after the profits/GDP ratio shown in the chart. So, although the profits/GDP ratio appears to have reached an important peak in the final quarter of last year, there could still be a couple more quarters of growth in S&P500 profits.
The perils of short selling
A few days ago the Chinese government decided that the shares of China's largest banks had fallen too far. Consequently, Central Huijin Investment Ltd., the company set up to hold the government's stakes in the banks, began to add to its holdings. Refer to the Bloomberg article posted
HERE
for further details.
This led to quick rebounds in the stock prices of the banks and probably means that there is now a solid floor under these stocks. After all, we are talking about a price-support operation by an 'investor' with infinitely deep pockets. In fact, it probably means that China's government won't tolerate significant additional weakness in the overall stock market.
We remain bearish on China's economic prospects, but due to the substantial risk of government intervention we have no desire to bet against China's stock market.
Trying to have it both ways and usually getting away with it
In April of this year the Russell2000 Small Cap Index (RUT) made an all-time high. At the time, Ben Bernanke pointed to the new high in this index as evidence of the success of "QE2". That's right -- a speculative rally leading to new highs in small-cap stocks was deemed, by the Chairman of the Federal Reserve, to be evidence of successful monetary policy. Strangely, though, according to the Fed the same monetary policy had nothing to do with the large gains in the prices of many commodities that occurred in parallel with the equity rally. Unlike the rally in speculative small-cap stocks, which apparently represented a sustainable increase in real wealth, the increases in commodity prices would prove to be transitory.
When the RUT subsequently gave back all of its QE2-inspired gains, Bernanke didn't cite the decline as evidence that monetary policy hadn't succeeded after all. However, the decline in commodity prices over the past couple of months prompted the Fed to say: "See, we were right; the gains were transitory".
The reality is that the equity and commodity markets are ramping upward and downward together in response to changes in monetary conditions or the anticipation of monetary changes. The Fed takes credit for some of these market moves and denies responsibility for others. In general, the mainstream press lets them get away with the inconsistencies.
Current Market Situation
As mentioned above, the RUT rallied strongly in response to "QE2" and made a new all-time high in April. As also noted above, it subsequently gave back all of its QE2-related gains. At least, at the 4th October intra-day low it was only marginally above its lows of July-August 2010 -- just prior to the start of the QE2-fueled rally.
The following daily chart shows that it has rebounded strongly since bottoming on 4th October. That the rebound commenced after a clear break below short-term support and from the vicinity of longer-term support increases the probability that the RUT's 4th October low will hold for a few months.
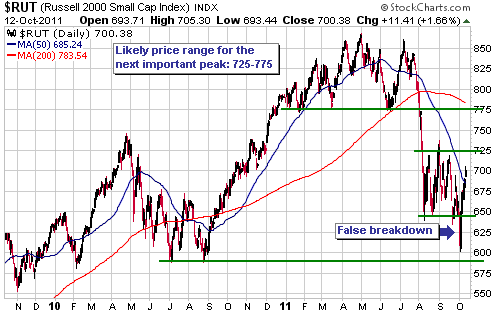
The RUT's price action skews the odds in favour of a multi-month bottom having been put in place on 4th October. However, the market is now 'overbought' on a short-term basis and likely to pull back or consolidate over the next several days.
If the 4th October low holds for a few months then it will likely have marked the end of the first leg of a cyclical bear market.
Gold and the Dollar
Gold
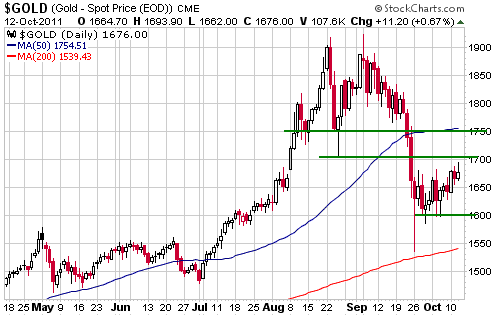
In 7 of the past 10 years gold made its peak for the year in December, so seasonal factors point to gold making a new high within the next two months. However, the price action suggests that gold peaked for the year in August on a daily closing basis and in September on an intra-day basis. In other words, it looks like 2011 will deviate from the seasonal pattern.
Gold probably won't exceed its August high within the next few months, but over the same period it also probably won't do much worse than test its 26th September low of $1532. At least, this is the message of the sentiment indicators we follow. As far as the next few months are concerned we suspect that gold will spend most of its time between $1600 and $1700, with moves up to resistance at $1750 or down to support at $1500-$1550 proving to be short-lived.
Gold Stocks
The following daily chart shows the HUI and a 15% envelope around the HUI's 50-day moving average (MA). With the exception of the market collapse of H2-2008, every decline by the HUI to the lower boundary of this MA envelope that occurred over the past 10 years marked an intermediate-term bottom to within a few days and a few percent. The fact that the HUI's 4th October plunge momentarily took it below the lower boundary of this MA envelope therefore adds to the evidence that the gold sector's correction ended during the first week of this month.
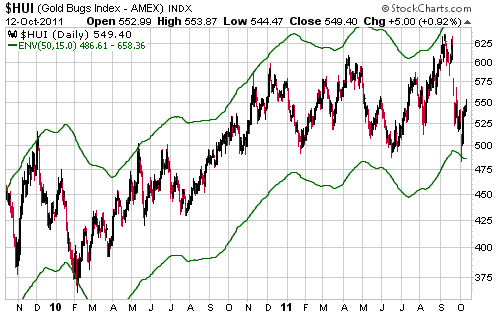
There's a good chance that the HUI will trade in the 600s before year-end, but it won't get there in a straight line. There will be pullbacks along the way that should be viewed as short-term buying opportunities. Also, the HUI will likely meet stiff resistance in the 570s. Therefore, a rise to the 570s within the next several days should be treated as a short-term selling opportunity.
As discussed in the latest Weekly Update, the effects of tax-loss selling could cause some junior gold stocks to remain under pressure until late December. This could lead to some excellent buying opportunities within the ranks of the micro-caps.
Currency Market Update
Europe's Crisis
As far as we can tell, there are five possible 'solutions' to the euro-zone's sovereign debt problem:
1. Greece leaves the euro zone and returns to using the Drachma, with the Drachma pegged to the euro. The Greek government re-denominates all of its obligations in Drachmas and then defaults by substantially devaluing the currency.
2. Germany leaves the euro zone, paving the way for a substantial devaluation of the euro that reduces the real value of all euro-denominated debt.
3. No country leaves the euro zone and no government directly defaults on its debts, but the ECB embarks on a massive debt monetisation program that substantially reduces the real value of all euro-denominated debt. In other words, all euro-zone governments indirectly default.
4. Greece stays in the euro zone and directly defaults on its debt, resulting in the holders of Greek government bonds taking "haircuts" of 50%-80%. Some other heavily-indebted euro-zone governments also default, with bondholders taking "haircuts" of varying sizes. Most of the commercial banks that would otherwise have gone under as a result of the losses stemming from these defaults are kept in business by the combination of the ECB, the EFSF and the financially-strongest governments.
5. The same as 4, except that commercial banks are not bailed out.
Solution 5 is the most sensible from an economic perspective, but solution 4 is the most likely because large commercial banks are a protected species. Solutions 1 and 2 would be very messy, and the German government would not go along with solution 3.
Solution 4 would probably lead to a few months of euro weakness, but the euro would remain a viable currency.
Current Market Situation
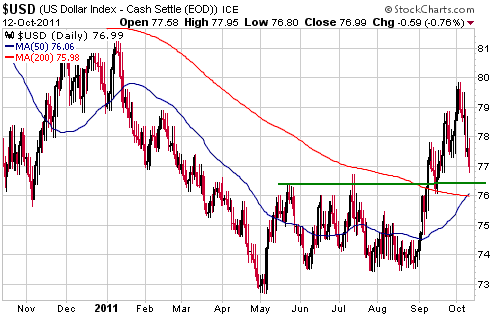
On 4th October we downgraded our short-term US$ outlook from "bullish" to "neutral" in anticipation of a correction. The likely extent of the correction was addressed in the 5th October Interim Update, when we wrote:
"Once the Dollar Index commences an intermediate-term advance, the 50-day moving average generally acts as support during pullbacks. The 50-day moving average is currently at 75.7, but it is rising and should roughly coincide with lateral support at 76.5 in a few weeks time. We therefore view 76.5 as a reasonable downside target for a near-term correction and will return our short-term US$ outlook to "bullish" if the Dollar Index trades below 77."
The Dollar Index traded as low as 76.8 and closed at 76.99 on Wednesday 12th October, so our short-term US$ outlook has returned to "bullish". We are also upgrading our intermediate-term US$ outlook to "bullish", as the past week's decline is likely just the first significant pullback in a rally that will continue for at least a few more months.
Based on the historical record, the dollar's short-term downside from here should be limited by support at 76.0-76.5.
Update
on Stock Selections
Notes: 1) To review the complete list of current TSI stock selections, logon at
http://www.speculative-investor.com/new/market_logon.asp
and then click on "Stock Selections" in the menu. When at the Stock
Selections page, click on a stock's symbol to bring-up an archive of
our comments on the stock in question. 2) The Small Stock Watch List is
located at http://www.speculative-investor.com/new/smallstockwatch.html
 Carpathian Gold (TSX: CPN). Shares: 423M issued, 466M fully diluted. Recent price: C$0.55 Carpathian Gold (TSX: CPN). Shares: 423M issued, 466M fully diluted. Recent price: C$0.55
Barrick Gold (ABX) bought 9% of CPN in July in order to gain exposure to CPN's Rovina Valley gold-copper project in Romania. Furthermore, some of ABX's technical people have been assigned to assist with the engineering of this project.
This doesn't guarantee that ABX will eventually offer to buy CPN, but it has obviously invested in CPN with the intention of eventually gaining full control of the Rovina project.
Thanks to ABX's additional funding and the drilling/engineering work that was already fully-funded by CPN's cash reserves, the Rovina project should generate a steady stream of potentially market moving news over the next several months. There should also be news from CPN's other project (the RDM project in Brazil), which has entered the construction phase and is expected to be in production by early 2013.
Valuing a company such as CPN boils down to the question: what discount should be applied to the estimated net present values of the company's projects to account for everything that could go wrong between now and when the projects start producing? For example, at a gold price of $1450/oz the Rovina Valley and RDM projects have been estimated to have net present values of $1.13B and $205M, respectively. The combined NPV equates to about C$2.90 per share, but CPN certainly isn't worth $2.90/share today.
Considering the risks, the growth potential of the Rovina Valley project and the likelihood that gold will be a long way above $1450/oz by 2013, we remain comfortable with our intermediate-term stock price target of C$1.00-C$1.20.
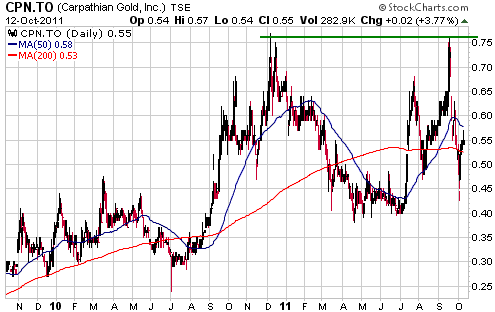
Chart Sources
Charts appearing in today's commentary
are courtesy of:
http://stockcharts.com/index.html

|

