|
- Interim Update 12th November 2003
Copyright
Reminder
The commentaries that appear at TSI
may not be distributed, in full or in part, without our written permission.
In particular, please note that the posting of extracts from TSI commentaries
at other web sites or providing links to TSI commentaries at other web
sites (for example, at discussion boards) without our written permission
is prohibited.
We reserve the right to immediately
terminate the subscription of any TSI subscriber who distributes the TSI
commentaries without our written permission.
Why the
Fed will have to hike
In the 22nd October Interim Update
we explained why we think the Fed will have to hike official interest rates
over the coming 12 months by more than the market is presently anticipating.
Then, in the 29th October Interim Update, we predicted that the Fed will
begin talking about the risks of rising inflation by the 28th January
FOMC Meeting. We are now going to revisit this matter because it is so
important and because we perceive a large mismatch between the consensus
view and what is actually going to happen.
Many of our readers would be familiar
with John Mauldin and his free newsletter that gets sent out to literally
millions of people each week. Mr Mauldin doesn't expect the Fed to raise
interest rates at all over the coming year so his view could not be described
as typical (the consensus view is that there will be a modest increase
in rates). However, his reasons for not expecting any rate hikes from the
Fed are representative of the wrong-headed thinking that appears to be
dominating interest rate discussions.
If you haven't already done so we suggest
that you read Mr Mauldin's latest analysis at http://www.2000wave.com/article.asp?id=mwo110803
for a 'take' on why the Fed won't hike next year. In summary, the argument
is that a) the Fed wants to see sustainable employment growth before hiking
rates, and b) the Fed is going to buy insurance for a growing economy in
the form of lower rates until after the November 2004 elections.
These arguments would be valid if
the short-term interest rate set by the Fed controlled the long-term interest
rates set by the market, that is, if keeping the Fed Funds Rate at a very
low level guaranteed that long-term interest rates would remain low. In
the real world, though, the opposite is true in that the Fed is typically
dragged along, 'kicking and screaming', by the bond market.
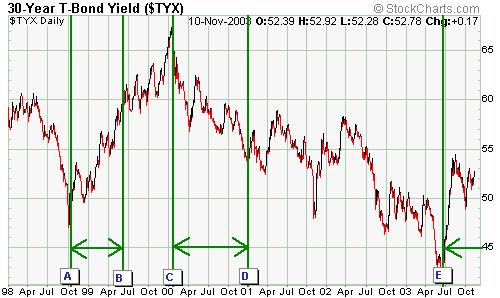
We've attempted to illustrate the lead-lag
relationship between the bond market and the Fed on the below chart of
the 30-year bond yield.
Point A on the chart corresponds to
the time when the trend for long-term interest rates turned higher in October
of 1998 while point B corresponds to the time when the Fed began to hike
short-term rates (June 1999). The difference between the two points --
9 months -- represents the time it took the Fed to respond to the changing
financial/economic environment.
Point C on the chart corresponds to
the time when the trend for long-term interest rates turned lower in January
of 2000 while point D corresponds to the time when the Fed began to cut
short-term rates (January 2001). The difference, in this case, was 12 months.
Currently, 5 months have gone by since
long-term interest rates turned higher (point E on the chart). If the Fed
follows the bond market with the same 9-12 month lag that characterised
the past two major monetary-policy shifts then the first rate-hike will
happen between March and June of next year.
We expect that the first official rate
hike will occur by March 2004 and that the Fed will be FORCED to hike rates
aggressively during the 6 month period leading up to the November 2004
presidential election. The reason they will be forced to hike rates is
that once inflation expectations get out of hand -- something that has
a good chance of happening next year due to the excessively easy monetary
policies of the past year -- it becomes counter-productive NOT to do so.
This is because long-term interest rates are pushed higher by rising inflation
expectations and long-term interest rates have a much greater effect on
the stock market, the real estate market and the economy than do short-term
interest rates. As such, at some point in the inflation cycle it becomes
necessary to increase official short-term interest rates in order
to quell the inflation fears and bring down long-term interest rates.
Further to the above, the argument
that short-term interest rates will remain low because the Fed wants them
to remain low makes no sense. The Fed will only have the option
of keeping short-term interest rates low for as long as long-term interest
rates remain near current low levels. And long-term interest rates will
only remain near current low levels for as long as inflation expectations
remain subdued. However, if we are right about what is going to happen
to the gold price, to commodity prices in general and to the US$ over the
next year then inflation expectations are absolutely NOT going to remain
subdued.
Funnily enough, whether or not the
Fed ends up having the option of keeping short-term interest rates near
current low levels for much longer will be determined, to a large extent,
by the actions of the Chinese and Japanese monetary authorities. There
are two reasons for this. First, the credit expansion that is raging away
in China is causing that country's demand for commodities to ramp-up at
a staggering pace. Unless the Chinese authorities are successful in slowing
the credit expansion and the resultant credit-induced boom within the next
few months, the CRB Index will burst above its 1996 peak and begin heading
towards its 1980 peak at a rapid rate. It doesn't take much imagination
to realise that this would put enormous downward pressure on bond prices
(upward pressure on long-term interest rates) throughout the world. Second,
long-term US interest rates would already be much higher if not for the
huge purchases of US Treasury Bonds and Agency Securities made by the central
banks of Japan and China over the past year.
Copper
Below is a weekly chart of copper futures.
When copper broke above resistance
in the 79-80 range 3 months ago it generated an upside target in the mid-90s,
a level that also roughly corresponded to the peak reached in September
of 2000. This target has been achieved and given the almost vertical rise
in the price that has occurred over the past several weeks it would be
normal for a pullback to begin from around the current level. A reasonable
target for such a pullback, assuming it does occur, would be the breakaway
gap at around 86. This would constitute a 40% retracement of the rally
from the May low to the recent peak.
There might be some short-term downside
risk in the copper market based primarily on technical factors and perhaps
a delayed reaction to planned increases in copper production, but taking
a 6-12 month view the risk/reward looks very favourable. A potential slowing
of Chinese demand for copper represents a risk and the Chinese monetary
authorities are already taking steps that could create such a slowdown.
However, once a credit expansion is in full swing -- as is the case right
now in China -- an extended period (many months) of concerted effort on
the part of the central bank is typically required to effect a sustainable
slowing in the rate of expansion. Therefore, over the next 6 months the
situation in China probably represents more of a threat to the 'shorts'
in the copper market than it does to the 'longs'. Also, the trend reversal
(from up to down) in the US money-supply growth rate isn't likely to have
a significant adverse effect on US economic growth until the second quarter
of next year, so on the whole the economic backdrop remains bullish for
copper (and the other base metals).
The US
Stock Market
Current Market Situation
No market-timing indicator works all
the time and over the past several months many of the popular indicators
of market sentiment have failed. For example, by June of this year many
of the sentiment indicators we follow, including the TSI Index of Bullish
Sentiment (a weighted index made up of the VIX, the 5-day moving average
of the equity put/call ratio, and the results of four sentiment surveys),
were suggesting that the stock market was close to an important peak. However,
although the market hasn't made much upside progress since that time it
has continued to work its way higher in defiance of persistently 'overbought'
readings. Note, on the below chart, that something similar occurred between
December of 1998 and July of 1999.

The apparent failure of sentiment indicators
over the past 6 months won't stop us from paying attention to such indicators
in the future. In fact, they will probably begin to work very well again
as medium-term market-timing tools shortly after most people become convinced
that they are of little value. The recent failure of these indicators does,
however, show that if liquidity remains high enough for long enough then
almost nothing else matters.
The stock market was generally quite
strong on Wednesday, but one of the most notable aspects of yesterday's
rally was the small decline in the Dow Utilities Average. This was
notable because the 'utes' tend to move with the combination of
stocks and bonds, so on a day such as yesterday during which both stocks
and bonds were up we'd have expected this particular sector to have fared
relatively well.
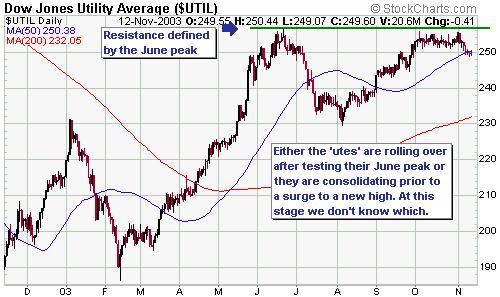
The below 1-year chart shows that the
Utilities Average is hovering just below important resistance, so this
might explain yesterday's lackluster performance. In any case, a decisive
move above the June high by the 'utes' would be a bullish omen for the
combination of US stocks and bonds whereas a failure to breakout to the
upside would be a bearish omen. In other words, an upside breakout in the
Utilities Average would warn that there was likely to be strength in US
stocks and bonds over the coming months or that the strength in
one market (stocks or bonds) was going to more than offset the weakness
in the other market over the coming months.
So far, this has been a strange week
because the US$ has confirmed last Friday's downward reversal by heading
lower while the stock market has moved back to near its recent highs. We
are not sure what to make of this. Anyhow, we are yet to see any cracks
in the stock market's bullish veneer.
Gold and
the Dollar
Current Market Situation
Wednesday's decisive move above $390
by the gold price suggests that our short-term target of $410-$420 will
be reached within the next few weeks. Also, as discussed in the latest
Weekly Update the daily close above $390 has created an intermediate-term
upside target of $460. It is possible that this higher target will also
be reached over the coming few weeks, but a more likely scenario is that
which we've outlined in the past (a move up to 410-420 followed by a 3-6
month consolidation followed by another rally).
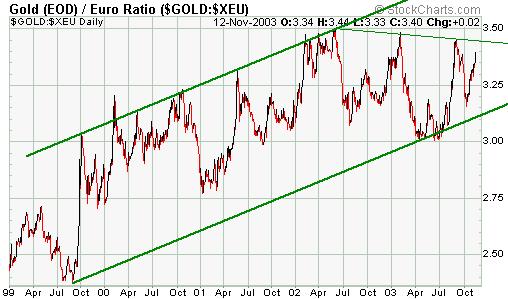
Over the past several months our forecast
has been that a peak in the US$ gold price would coincide with a move in
the euro gold price to its long-term channel top (see chart below). In
order to reach the channel top over the next month the gold price would
need to move up to around 370 euros, but if the gold rally were to extend
into the first half of next year (as now seems likely) then a move to the
channel top would require a gold price of 380-390 euros. Looking at this
from a different angle, if we assume that the US$ gold price reaches its
$460 target at the same time that the euro gold price is hitting its channel
top, then the implied EUR/USD exchange rate at the next important gold
price peak would be 460/380 = 1.21.
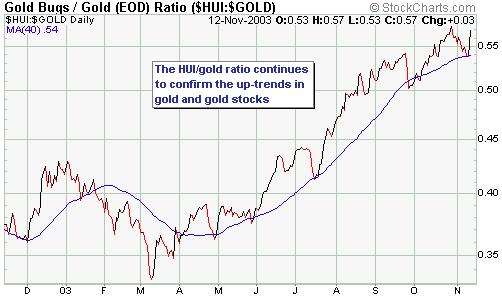
The HUI/gold ratio completed another
successful test of its 40-day moving average earlier this week before surging
on Wednesday, meaning that the upward trend in gold stocks relative to
the gold price remains intact. This, in turn, means that there is no sign
of imminent danger as far as the gold market is concerned.
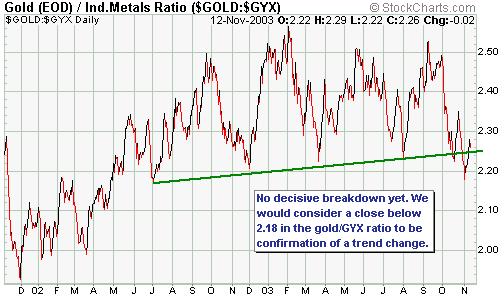
As discussed in previous commentaries,
there are a few signs that growth-oriented investments are beginning to
get the upper hand over safety-oriented investments. However, a trend change
has not yet been confirmed. For example, the below chart of the gold/GYX
ratio shows that gold is continuing to cling to its up-trend relative to
the GYX (Industrial Metals Index).
Below is a weekly chart of the silver
price. By closing above resistance in the 5.15-5.20 range on Wednesday
silver brought our previously mentioned short-term target of 5.80 (the
one we discarded when the silver price dropped below 4.90 in early October)
back into play. In the TSI Stocks List we have exposure to silver via Western
Silver (TSX: WTC, AMEX: WTZ), Cardero Resource (TSXV: CDU) and Metallica
Resources (AMEX: MRB).
Update
on Stock Selections
 During
the first 12-18 months of the gold-stock bull market our focus at TSI was
on the major and mid-tier gold producers. However, during the third quarter
of last year we made a decision to shift away from the larger companies
and to start focusing on the juniors. This decision was made because at
the market prices that prevailed at the time the risk/reward for many of
the junior gold companies was vastly superior to the risk/reward for their
larger counterparts. During
the first 12-18 months of the gold-stock bull market our focus at TSI was
on the major and mid-tier gold producers. However, during the third quarter
of last year we made a decision to shift away from the larger companies
and to start focusing on the juniors. This decision was made because at
the market prices that prevailed at the time the risk/reward for many of
the junior gold companies was vastly superior to the risk/reward for their
larger counterparts.
A result of this decision was that
by February of this year there were no large gold producers in the TSI
Stocks List. Also, with the exceptions of mid-tier producers Wheaton River
and Northgate the gold/silver section of the Stocks List has been totally
comprised of juniors over the past 9 months.
To some observers our strategy might
appear to be overly risky, but it's not. A single junior mining stock can
be a very risky speculation, but when we decided to shift our focus to
the juniors it was apparent that a carefully selected portfolio of, say,
10 junior stocks offered less risk (in addition to substantially
greater reward) than a portfolio of 10 large-cap stocks. This is because
substantial gold price increases were already built into the larger
stocks whereas many of the smaller stocks were under-valued based on the
current gold price. This, in turn, meant that there was large valuation
risk amongst the majors which generally didn't exist amongst the juniors.
For an example of what can happen when
an over-valued stock fails to live up to the lofty expectations that are
built into its stock price, take a look at the year-to-date performances
of Meridian Gold, Agnico Eagle and Royal Gold. These were generally not
perceived to be high-risk stocks, but they were high-risk stocks when they
were trading near their peaks because they were priced for perfection.
At the same time, many of the juniors were priced as though the gold price
was going to remain below $325 forever and thus, as a group, were less
risky.
The reason we originally decided to
shift our focus to the juniors is the same as the reason we are sticking
with the juniors. With gold trading at around $390 we have no interest
in buying stocks that already discount a $450-$500 gold price, which is
the case with most of the large and mid-size North American gold stocks.
If the gold price rises to $500 then these stocks would still show good
gains because equity investors would ramp-up their gold price expectations,
but if investors began to believe that a $450-$500 was unattainable over
the medium-term then these stocks would be vulnerable to a sizeable decline.
From risk/reward perspective, it makes
more sense to focus on those companies that are under-valued at the current
gold price. In other words, don't expect us to change tack anytime soon.
The same argument applies, by the way,
to the non-gold commodity stocks. Despite the huge run-ups in stock prices
over the past 2 months it is still very easy to find juniors that offer
exceptional value. In general, however, the majors have already gone a
long way towards discounting a brighter future for commodity prices.
We re-emphasise that there is often
considerable risk with any single junior resource stock and for
this reason the amount of money put into any one situation should be a
small percentage of your overall portfolio (a maximum of, say, 5%). As
mentioned above, though, this risk can be very effectively mitigated by
spreading your exposure across several companies.
Aquiline
Resource (TSXV: AQI) broke its short-term downtrend earlier this week and
has done enough to confirm that a correction low is in place. A daily close
above the hefty resistance that exists at C$0.90 would confirm that the
stock was on its way to a new high.
One
of the most under-valued junior gold stocks we know of is Patricia Mining
(TSXV: PAT). This company's Island Gold Project in Canada has an inferred
resource of 1.6M ounces plus a modern 650tpd mill and related infrastructure
(providing the ability to quickly move into production once reserves have
been proved up over the coming year). All this and PAT is being valued
by the market at only US$11M (around US$6.80 per ounce of gold in the ground).
We
continue to like NovaGold (TSX: NRI) and the NovaGold warrants (TSX: NRI.WT)
near current levels.
In
an e-mail sent to paid-up subscribers earlier today we added two more junior
gold stocks to the Stocks List and took profits on one of our existing
junior gold stocks.
We
plan to send an e-mail to paid-up subscribers on Friday to advise the addition
of at least one more non-gold junior resource stock to the List.
Chart Sources
Charts appearing in today's commentary
are courtesy of:
http://stockcharts.com/index.html
http://www.futuresource.com/

|
