![]()
![]()
![]()
![]()
- Interim Update 13th February 2019
Copyright
Reminder
The commentaries that appear at TSI
may not be distributed, in full or in part, without our written permission.
In particular, please note that the posting of extracts from TSI commentaries
at other web sites or providing links to TSI commentaries at other web
sites (for example, at discussion boards) without our written permission
is prohibited.
We reserve the right to immediately
terminate the subscription of any TSI subscriber who distributes the TSI
commentaries without our written permission.
Some thoughts on Modern
Monetary Theory
Modern Monetary Theory, or MMT
for short, is gaining in popularity in the US. It is based on the idea
that under the current monetary system the government doesn't have to
borrow. Instead, it simply can print all the money it needs to fill the
gap between its spending and its income. The only limitation is
"inflation". As long as "inflation" is not a problem the government can
spend -- using newly-created money to finance any deficit -- as much as
required to ensure that almost everyone is gainfully employed and to
provide all desired services and infrastructure. It sounds great! Why
hasn't anyone come up with such an effective and easy-to-implement
prosperity scheme in the past?
Of course, it has been tried in the
past. It has been tried countless times over literally thousands of years.
The fact is that there is nothing modern about Modern Monetary Theory. It
is just another version of the same old attempt to get something for
nothing.
Most recently, MMT has been put into effect in Venezuela.
For all intents and purposes, the government of Venezuela has been
printing whatever money it needs to pay for the extensive 'free' social
services it promised to the country's citizens. The MMT apologists
undoubtedly would argue that the money-printing experiment didn't work in
Venezuela because the government didn't pay attention to the "inflation"
rate. It kept on printing money at a rapid pace after "inflation" became a
problem. Our retort would be: "Good point! Who would have thought that a
government with the power to print money couldn't be trusted to stop
printing as soon as an index of prices moved above an arbitrary level."
In essence, MMT is based on the fiction that the government can
facilitate an increase in overall economic well-being by exchanging
nothing (money created 'out of thin air') for something, or by enabling
the recipients of the government's largesse to exchange nothing for
something. It is total nonsense.
New wealth can't be created by
printing money, but existing wealth will be redistributed. It's like when
a private counterfeiter prints new money for himself. When he spends that
money he diverts real wealth to himself while contributing nothing to the
economy. MMT is the same principle applied on a gigantic scale.
As
is the case when money is loaned into existence under the current system,
the application of MMT will affect relative prices as well as the
so-called "general price level". The reason is that the new money won't be
injected uniformly across the economy. However, it's likely that the price
increases stemming from the monetary inflation will be more uniform and
direct under MMT than under the current system. In other words, under MMT
the effects of monetary inflation should be reflected much sooner and to a
far greater extent in the CPI than is the case with the current system.
That the application of MMT would lead quickly to what most people
think of as "inflation" is a benefit, because the link between cause
(monetary inflation) and effect (rising prices) would be obvious to almost
everyone. A related benefit is that MMT would short-circuit the boom-bust
cycle.
Booms happen when the Fractional Reserve Banking (FRB)
system (with or without a central bank) expands credit and in doing so
creates the impression that the quantity of real savings is much greater
than is actually the case, prompting excessive investment in long-term
business ventures that would not look viable in the absence of misleading
interest-rate signals. We assume that under MMT the commercial banks would
still be lending new money into existence, but the temporary downward
pressure on interest rates from the surreptitious money creation of the
banks would be more than offset by the upward pressure on interest rates
from the blatant money-printing of the government. The boom phase
therefore would be very short, perhaps even barely noticeable. In effect,
MMT would bypass the boom and go straight to the bust. Again, this would
be beneficial because it would expose the link between cause (the
application of a crackpot monetary theory) and effect (economic hardship
for most people).
MMT is such an obviously silly idea that any
economist, politician, journalist or financial-market commentator who
advocates it should not be taken seriously. However, that they are being
taken seriously opens up the possibility that MMT will be implemented in
the not-too-distant future, with the 'benefits' outlined above.
Lithium Update
There is an overview of the
lithium market, including brief descriptions of the two most important
lithium compounds (lithium carbonate and lithium hydroxide), in the 26th
December 2018 Interim Update. Prices have since moved sideways (refer to
the following charts for details), but price expectations have fallen,
that is, investors have become less optimistic about future prices. Most
recently, lithium sentiment took a hit on Monday of this week when U.S.
lithium producer Livent Corp
said that it expects demand for the white metal to sag in China for
the rest of the year.
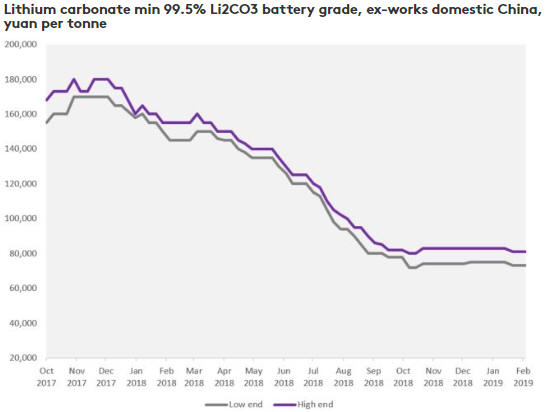
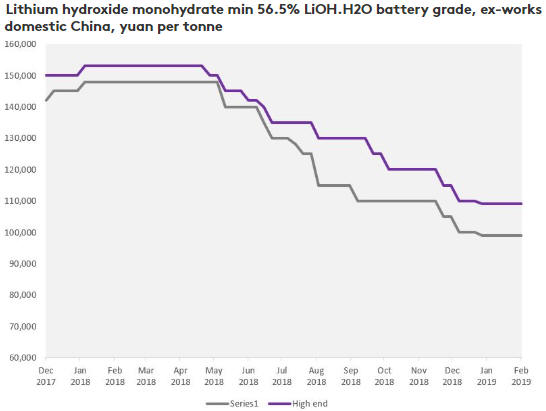
The final paragraph from our 26th December lithium write-up remains
applicable. Here it is again:
"...there is a risk that all the
new investment in lithium hydroxide production now happening in Australia
will be more than sufficient to cater for the coming increase in demand,
but...we suspect that most forecasters are greatly under-estimating the
future EV-related demand for battery metals such as lithium. We therefore
like the idea of maintaining long-term exposure to well-financed lithium
hydroxide producers/developers such as Mineral Resources (MIN.AX) and
Kidman Resources (KDR.AX)."
The Stock Market
The US stock market has
continued its relentless march upward, enabling the S&P500 Index (SPX) to
close slightly above its 200-day MA on Wednesday 13th February.
Unfortunately, this doesn't tell us anything new of importance. Although
the initial rebound from the December low has now gone further than the
overall rebound was expected to go, the remarkable speed of the recovery
is not inconsistent with performance during the first several months of a
bear market. It neither confirms nor denies the bear market scenario. It
simply means that there is no evidence that the initial rebound is over.
Preliminary evidence that the initial rebound is over would be another
failure to achieve a weekly close above the 50-week MA. That will happen
if the SPX ends this week below 2730.
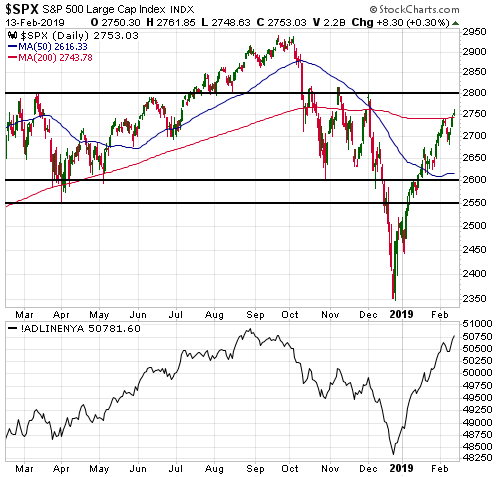
What we have at the moment is several US stock indices near 200-day MA
resistance, which implies that the market is stretched to the upside given
how far the indices had to travel from their December lows to get back to
this MA. We also have a put/call sell signal (see chart below). The
early-October market top occurred one week after the previous put/call
sell signal and a week has now gone by since the most recent signal. What
we don't have is a significant bearish divergence. In particular, the
Advance-Decline Line (ADL) shown in the bottom section of the above SPX
chart continues to confirm the SPX's strength.
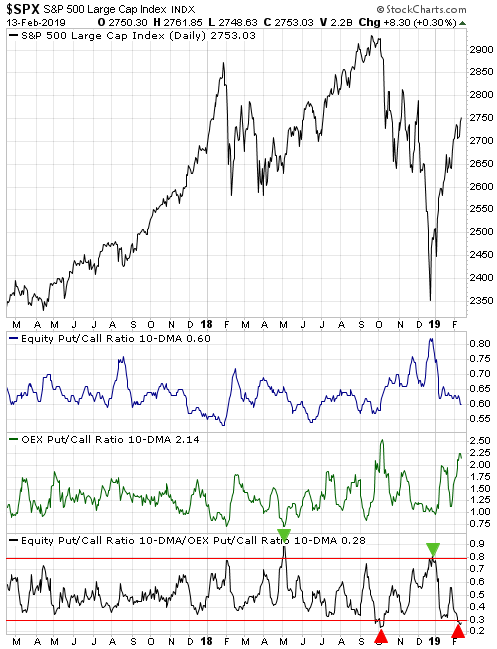
If the market had dropped sharply over the past week then the
Fed-generated 'liquidity drain' that potentially will take place this
Friday or early next week could have precipitated a trend-ending plunge.
However, that's no longer a realistic possibility. There could be
significant weakness over the next few days due to the Fed's quantitative
tightening (QT), but if so it won't be the culmination of a multi-week
decline.
Gold and the Dollar
Gold
The
US$ gold price has done well over the past 4.5 months in the face of a
strong US$. This is explained by the fact that the US dollar's exchange
rate is only one of several important fundamental drivers of the gold
price. Taking everything into account, the fundamental backdrop has been
gold-bullish since the second week of December.
With one exception,
any decline in the gold price should be corrective (a counter-trend move
within an on-going intermediate-term rally) as long as gold's true
fundamentals stay bullish. The exception is when sentiment is dangerously
stretched into optimistic territory, warning that the bullish fundamentals
have been more than fully discounted in the current price. But even in
this case the fundamentals, as indicated by our GTFM, should begin to
deteriorate in the early part of an intermediate-term downward trend, thus
confirming the trend reversal in a timely manner.
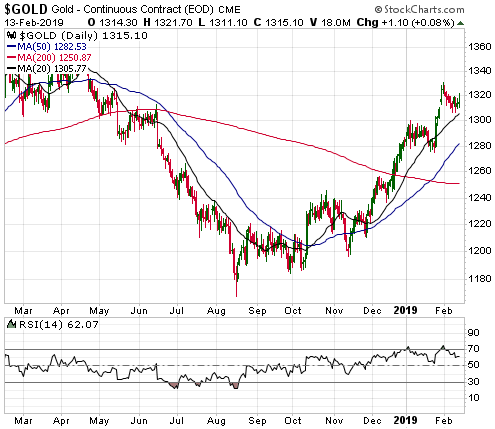
Turning to the
daily price chart, we see that the gold price has been drifting lower
since the start of February. This correction probably will be limited by
support near $1280, although it could extend as far as $1250 without
signaling an intermediate-term reversal.
Gold Stocks
The 158-164 range for the HUI
contains three of the most useful moving averages and multiple lateral
support levels. The HUI ended Wednesday's session at the top of this
support range.
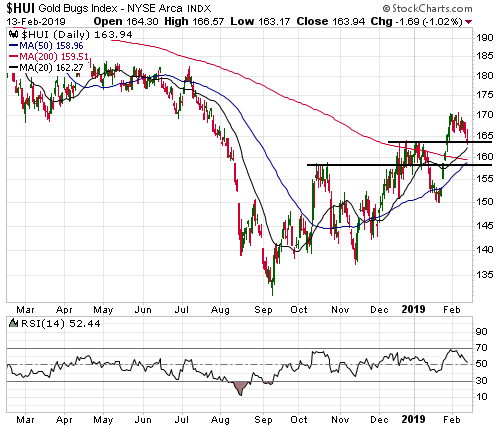
A routine correction within an on-going short-term upward trend could
take the HUI to the bottom of the aforementioned support range (158), but
no lower.
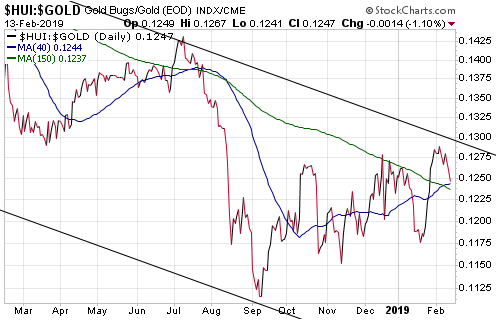
Of greater immediate importance than what the HUI does
in dollar terms is what it does in gold terms. As pointed out in a couple
of recent TSI commentaries, if the gold-mining sector is immersed in
something more bullish than a counter-trend rebound then the HUI/gold
ratio should hold above its 150-day and 40-day MAs during pullbacks over
the weeks ahead. By the same token, if HUI/gold drops below these MAs
within the next few weeks it won't mean that a multi-month top is in
place, but it will imply that the rally from the September-2018 low is no
more significant than the other rebounds of the past two years.
As
illustrated by the following chart, HUI/gold's 150-day and 40-day MAs are
only slightly below Wednesday's closing level. Consequently, there is not
much scope for additional near-term weakness in the gold-mining sector
relative to gold bullion.
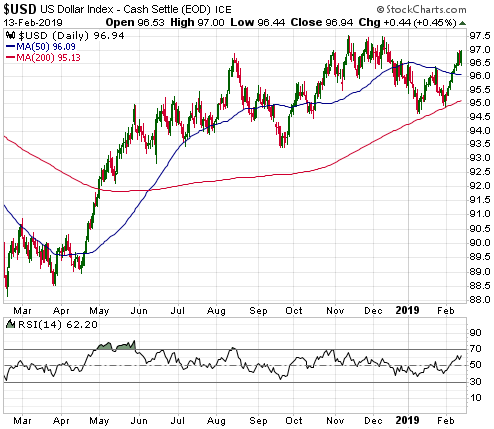
The Currency Market
From the 31st December
Weekly Update:
"According to Brandt's research, there has been
a very strong tendency for the Euro (or trade-weighted proxy prior to
2002) to establish its annual high or low in the month of January or
early-February. To be specific, an annual low or high in EUR/USD has
occurred within the first six weeks of the year in 79% of years dating
back to 1971. Furthermore, the January Effect has produced an average
price advance or decline of 19.7%.
This will be useful information
if the euro moves sharply higher or lower over the weeks ahead and
reverses course by early-February. If this happens there will be a decent
chance that the high or low for the year has been set."
The
euro just made a new 3-month low, opening up the possibility that the
"January Effect" will create an important bottom this year. If the euro
reverses upward by early next week then the low for the year might be in
place.
For the euro, the most clear-cut and easiest-to-trade
BULLISH setup would involve a spike BELOW the November low during the
final two days of this week followed by an upward reversal. Traders could
then go long the euro in anticipation of a multi-month rally and manage
risk by placing an initial stop slightly below this week's low.
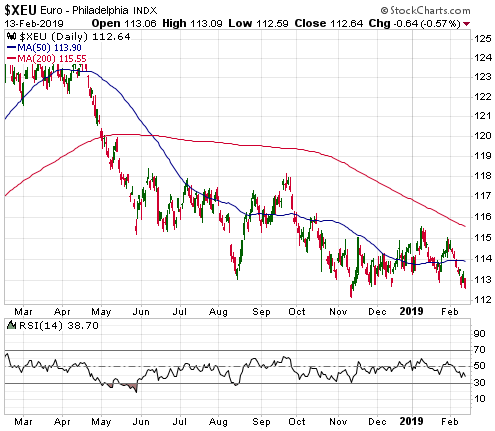
Unsurprisingly, the Dollar Index (DX) is in the opposite position. For
the DX, the most clear-cut and easiest-to-trade BEARISH setup would
involve a spike ABOVE the November high during the final two days of this
week followed by an downward reversal. Traders could then go short the DX
in anticipation of a multi-month decline and manage risk by placing an
initial stop slightly above this week's high.
Updates on Stock Selections
Notes: 1) To review the complete list of current TSI stock selections, logon at
http://www.speculative-investor.com/new/market_logon.asp
and then click on "Stock Selections" in the menu. When at the Stock
Selections page, click on a stock's symbol to bring-up an archive of
our comments on the stock in question. 2) The Small Stock Watch List is
located at http://www.speculative-investor.com/new/smallstockwatch.html
Chart Sources
Charts appearing in today's commentary
are courtesy of:
https://stockcharts.com/
https://www.metalbulletin.com/LITHIUM-PRICES-UPDATE.html
![]()