|
- Interim Update 13th June 2007
Copyright
Reminder
The commentaries that appear at TSI
may not be distributed, in full or in part, without our written permission.
In particular, please note that the posting of extracts from TSI commentaries
at other web sites or providing links to TSI commentaries at other web
sites (for example, at discussion boards) without our written permission
is prohibited.
We reserve the right to immediately
terminate the subscription of any TSI subscriber who distributes the TSI
commentaries without our written permission.
Commodities
Agricultural Commodities
We continue to be bullish on agricultural commodities, primarily the
grains. We therefore continue to believe that it makes sense to scale
into DBA -- an ETF that invests in corn, soybeans, wheat and sugar
futures.
Be aware that this bullish outlook is of the 'big picture' variety and
that we have no expectations regarding what will happen to grain prices
over the next few months, other than we certainly don't expect them to
collapse. Short-term price moves will continue to be determined to a
large extent by the effects of weather on crop conditions, and we have
neither the time nor the inclination to become experts on such things.
Our view, in a nutshell, is that a secular bull market has commenced in
the agricultural sector due to the coming-together of three major
long-term price drivers. These price drivers are:
1. Inflation
Rampant money-supply growth throughout the world has put upward
pressure on the prices of all commodities, but the agricultural
commodities have generally been affected to a much lesser degree than
the base metals and 'energies'. This has left the real
(inflation-adjusted) prices of most agricultural commodities at
extremely low levels relative to the real prices of many other
commodities, thus setting the stage for big catch-up moves.
2. Using food for fuel
Rational concerns about energy security and depleting supplies of
conventional fuel, along with irrational (we think) concerns about
"global warming", are causing rapid growth in the demand for renewable
fuels made from agricultural commodities (corn-based ethanol, for
instance).
3. Increased Chinese demand
China's demand for food commodities (grains, pork, beef) is growing
much faster than its ability to produce these commodities. As a result,
China will be importing a lot more food in the future than it has in
the past.
The ETF mentioned above (DBA) is not the sort of investment that's
likely to provide a quick double, at least not at this stage of the
long-term bull market. By the same token, it has minimal downside risk
compared with other investments because even if a global recession were
to begin later this year the demand for food would probably continue to
rise; as would the demand for renewable fuels such as ethanol. That is,
we think DBA is close to being 'crash proof'.
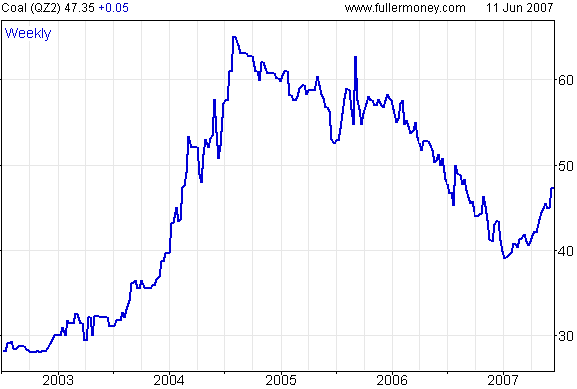
Coal
Coal was one of the two most important energy sources over the past 50
years -- the other being oil -- and will almost certainly remain so for
at least the next 20 years. This is despite going out of fashion to
some extent in the developed world due to the shift toward cleaner
sources of energy.
As is the case with many commodities, increased demand from China will
help keep the price of coal in a long-term upward trend. It wasn't that
long ago that China was a huge net-exporter of coal (China's net
exports of coal amounted to 830M tonnes in 2003), but in the first
quarter of this year it became a net-importer of the stuff.
The following www.fullermoney.com
chart shows that the price of coal more than doubled within the space
of 18 months during 2003-2004 and then spent almost 2.5 years drifting
lower. The lengthy correction seems to have ended at the beginning of
this year, though, perhaps partly in response to China becoming a net
importer.
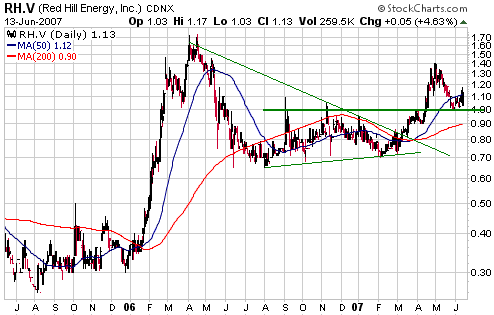
Our only coal play is
Red Hill Energy (TSXV: RH), an exploration-stage coal mining company
that owns coal deposits in Mongolia. The Mongolian location might not
seem ideal at first glance, but the deposits are actually well situated
given that China is now looking outside its own borders for the coal it
needs to satisfy its voracious appetite for energy. The location will
also look fine from the Russian and Japanese perspectives.
Our interest in RH has revolved around the Ulaan Ovoo project with its
209M-tonne M&I coal resource. However, based on the press release
issued by RH earlier this week it is clear that we should also be
taking into account the company's Chandgana Tal project, which appears
to contain more than 100M tonnes of coal and to be amenable to
relatively low-cost open pit mining. If this is the case then we should
be valuing RH based on the assumption that it owns 300M tonnes of
in-ground coal.
It is likely that RH will end up being purchased by a large
coal-producing or coal-consuming company. We don't know what RH's
in-ground coal would be worth to such a company, but a value of only
US$1/tonne -- versus the current spot price of around US$47/tonne --
would equate to more than C$5/share for RH. With RH having closed at
only C$1.13 on Wednesday the potential reward intrigues us.
Anyhow, RH is not so much a play on coal as it is a play on a very
under-valued in-ground resource that just happens to be in the form of
coal. Regardless of whether the coal price drops back to near last
year's low or moves up to near 2004's high over remainder of this year,
the investment case for RH won't change much. Someone will either buy
it, in which case it will be a financial 'home run', or they won't, in
which case it will probably be 'dead money'.
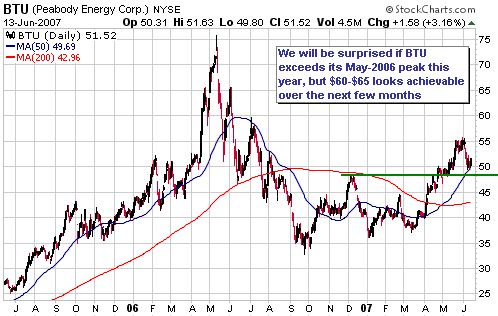
A chart of RH is included below, as is a chart of major coal producer Peabody Energy (NYSE: BTU).
BTU is a more direct play than RH on coal's upside potential. It should
do well over the long-term as the coal price trends upward, but as is
the case with most large-cap energy stocks its shorter-term performance
will be strongly influenced by the performance of the broad stock
market. In other words, BTU will likely be a good performer over the
next few months if -- and only if -- the broad stock market continues
its advance.
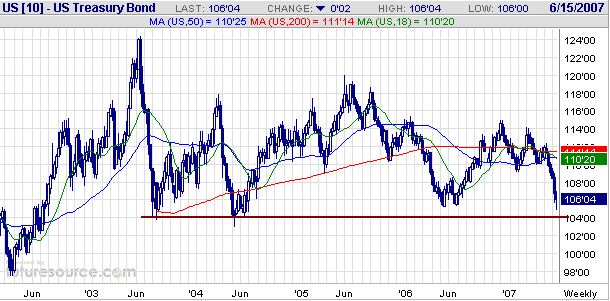
Bonds
Below is a weekly chart of T-Bond futures.
In our opinion, everything that has happened in the bond market over
the past 5 years is part of a giant topping pattern. The topping
pattern will be complete once the T-Bond breaks decisively below
long-term support at 103-104.
The fact that the German and Japanese bond markets have already
breached their 2003-2004 lows is part of a mountain of evidence
pointing to an eventual breakdown in the US bond market, but we expect
that US T-Bonds will remain above the aforementioned long-term support
for at least another two months. With bonds having become very
'oversold' and with a cyclical turning point due this month, we think
the most likely scenario entails a short-term bottom this month
followed by a multi-week -- or perhaps even a multi-month -- rebound.
The Stock Market
Current Market Situation
"Dow Posts Best One-Day Gain of 2007" was one of the headlines in the
aftermath of Wednesday's rally, but from our perspective the previous
day's action -- a day on which the Dow fell 130 points -- was more
bullish because it contained some positive divergences. In particular,
with respect to Tuesday's market action we were impressed by the
ability of the stock market to remain above last week's lows even while
bonds were plunging to new lows for the year and also by the strength
in the NDX relative to the Dow.
Last Friday's upward reversal in the bond market was not sustained and
Wednesday's upward reversal might also prove to be fleeting. However,
we expect that if bonds did not make a short-term bottom on Wednesday
then they will do so within the next several trading days, thus
removing significant downward pressure from the stock market.
A short-term bottom in the bond market at around this time would open
the door to the 1987 scenario discussed in the latest Weekly Market
Update. Under such a scenario the stock market would be free to rally
as long as bonds remained above their June-2007 lows, but a break below
the June lows by the bond market later this year would bring-on a bear
market in equities.
The potential for the Yen carry trade to unwind remains a short- and
intermediate-term risk. It wasn't a coincidence, for example, that
Wednesday's strong rebound in the stock market was accompanied by
weakness in the Yen relative to both the US$ and the euro. Weakness in
the Yen emboldens large traders to borrow this currency at less than 1%
to finance speculations in higher-yielding currencies.
We noted several weeks ago that the currency market backdrop that
provided the most support for the stock market entailed weakness in the
US$ relative to the euro and weakness in the Yen relative to the US$
(extreme weakness in the Yen relative to the euro, that is); and that
the worst situation for general equities would therefore entail
strength in the US$ relative to the euro and strength in the Yen
relative to the US$ (extreme strength in the Yen relative to the euro,
that is).
The risk posed by the potential for the Yen to rebound from its present
ultra-depressed level prevents us from being short-term bullish on
equities, but the likelihood of the short-term bond market threat
dissipating in the near future means that a short-term bearish view is
no longer appropriate. We are therefore shifting our short-term stock
market view to "neutral".
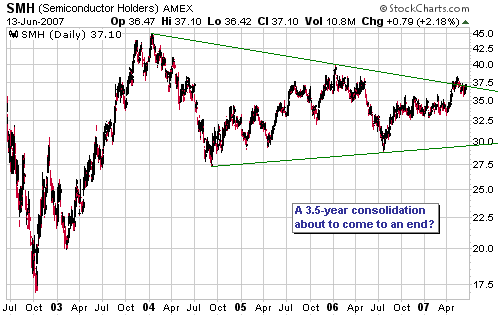
A potential trade in the "semis"
We've decided to feature charts of the Semiconductor sector today
because the recent price action within this group might be pointing
toward a significantly bullish outcome over the next few months.
The first of our charts shows the performance of the Semiconductor
Holders ETF (AMEX: SMH) over the past 12 months. Of note is that an
8-month consolidation between $33 and $35.50 was followed by an upside
breakout in April of 2007 and then a May-June pullback to 'test' the
breakout. Also of note is that Wednesday's action might have signaled
an end to the May-June pullback.
It looks like SMH could be on its way to new highs for the year.
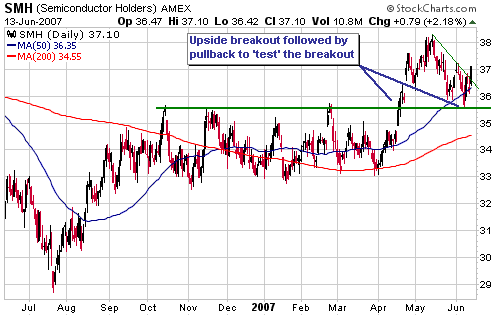
The second of our
charts shows that a move by SMH to new highs for the year might have
longer-term significance in that it would potentially signal an end to
the consolidation that began way back in January of 2004.
We aren't going to
add SMH to the TSI Stocks List because we probably won't have time to
provide regular updates on it in the commentaries (when we add a
position to the TSI List we create a commitment to follow-up, and in
this regard we already have more commitments than we can handle).
However, in response to Tuesday's positive stock market divergences and
the turnaround in the bond market we added some personal exposure to
SMH at the start of trading on Wednesday.
If SMH closes below its early-June low then we will assume that our
positive short-term outlook on the semiconductor sector is wrong.
Gold and
the Dollar
Gold/Silver Stocks
Sentiment
Disinterest has been evident in the gold sector for some time, but
another sign of a general lack of enthusiasm towards gold stocks has
recently emerged. We are referring, here, to the heavy way in which
small-cap gold stocks have been trading of late. More to the point, the
slow and relentless declines in the prices of many small- and micro-cap
gold/silver stocks over the past several weeks is a sign that the
public has begun to 'throw in the towel'.
As a group, the small-scale gold stocks (junior producers and
explorers) performed quite well relative to their larger-sized brethren
during the first four months of this year. At the time we noted that
this was a bearish divergence because it indicated that 'the public'
was more optimistic than 'the pros' about the gold sector's prospects.
Periods when the juniors are relatively strong are fun for those of us
who concentrate on these types of stocks, but it should be remembered
that such periods usually only occur during the final stages of major
rallies or the early stages of major corrections.
In an environment where there is a general dearth of new buying it
doesn't take much selling to push the stocks of the small-scale miners
downward. In fact, all it might take to get the price of an
exploration-stage mining stock to fall by 5% or more is for a couple of
part-time investors, who between them own no more than $10,000 worth of
the stock in question, to give-up and place 'at the market' sell
orders. Therefore, if you speculate within this area of the market --
and we emphasise that it is an area worth speculating in because over
the course of the long-term bull market it is where the greatest
profits will be achieved -- then you simply must do some selling during
the good times (the rallies) because during the bad times (the
corrections) there will often be no-one to sell to.
Evidence that the public has begun to 'throw in the towel' is not,
however, necessarily a sign that a sustainable price low is close at
hand. As we are fond of saying: sentiment follows price, not the other
way around. To be confident that sentiment was about to bottom-out we
would therefore need to be confident that the price was about to make a
sustainable low for some reason other than sentiment.
If we thought that a normal intermediate-term correction was underway
then we would view the current sentiment backdrop as a big plus because
the current pessimism would add fuel to the next rally, but we don't
think this is a normal intermediate-term correction. Instead, we
suspect that a much larger-than-normal correction commenced during May
of last year and that the second downward leg in this major correction
is still in its early stages. If so, then sentiment will become
considerably more pessimistic over the next six months.
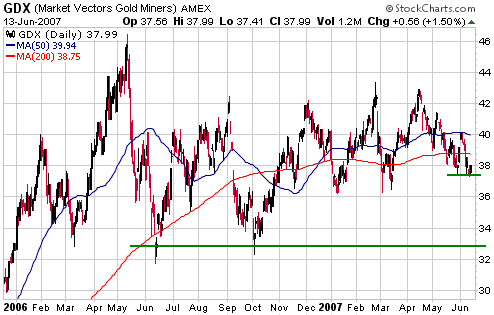
Current Market Situation
The following chart shows that GDX has short-term support defined by
the lows of the past three weeks and intermediate-term support defined
by the June/October-2006 lows. Our guess is that short-term support
will hold for now and the gold sector will rebound over the coming 1-3
weeks, but this is not a rebound that we would attempt to play. Rather,
we think that those who have not yet retreated to their 'core'
gold/silver stock exposure should use near-term strength to lighten-up.
We expect that intermediate-term support will be tested within the coming 4 months.
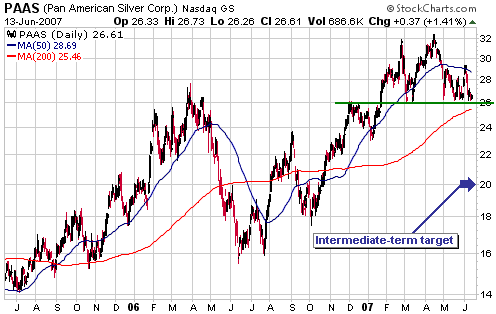
The following chart
of mid-tier silver producer Pan American Silver (NASDAQ: PAAS) shows
the important support that exists at US$26. A break below this support
would create a technical objective of $20.
A rebound in PAAS over the coming 1-3 weeks should, we think, be viewed as a selling opportunity.
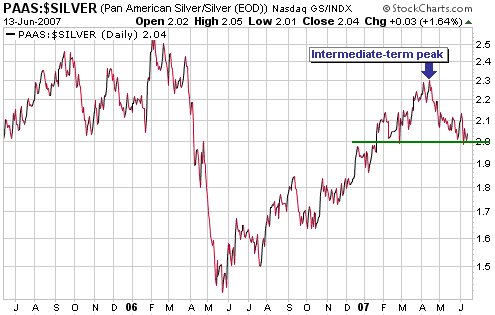
Intermediate-term
peaks in the PAAS/silver ratio usually lead intermediate-term peaks in
the gold stock indices by at least a few weeks. However, the most
recent intermediate-term peaks in PAAS/silver and the gold stock
indices were concurrent.
With reference to the following chart, a move below 2.0 by PAAS/silver
would constitute further evidence that an important top is in place in
the gold/silver sector.
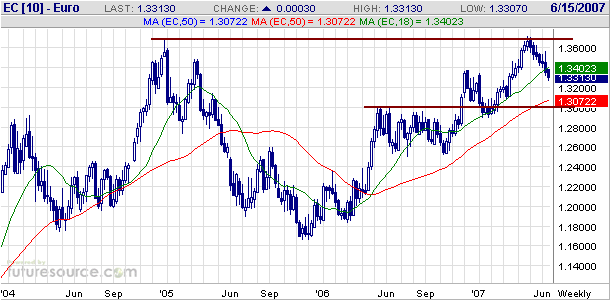
Currency Market Update
The following weekly chart shows that euro futures are presently
mid-way between intermediate-term resistance at 1.36-1.37 and
intermediate-term support at 1.30. From our euro-bearish perspective,
the ideal situation would be for the euro drop to around 1.30 before it
commences a rebound or consolidation. However, it is currently working
on its 7th down week in succession, meaning that the decline is
becoming extended on a short-term basis.
Whether it bounces now or from a lower level, we think it's just a matter of time before the euro moves back below 1.30.
There's been a lot of
talk over the past month about the impact on the gold market of the
sale, by the Bank of Spain, of 108 tonnes (about 25%) of that country's
official gold reserves during March-May of this year.
In our opinion, there is so much money sloshing around the financial
world these days that the sale of around $2B of central bank gold over
the space of 3 months will not create a problem for the gold market.
This particular sale might, however, be a sign of impending trouble
within the European Monetary Union and, therefore, an impending euro
problem. We say this because Spain's unexpected sale of 25% of its
official gold reserve looks like an act of desperation by a country
that's beginning to experience the inexorable bad effects of a massive
credit expansion.
In the spirit of Keynes, governments these days like to address the
problems caused by inflation (excessive money-supply growth) via...more
inflation. Elementary-school logic will tell you that this can only
result in even bigger problems down the track, but this won't matter if
your overriding goal is to get re-elected. If this is your goal then
you will be inclined to embrace stopgap measures that mask the
underlying problem in the short-term (between now and the next
election, that is).
One of the inherent weaknesses of the euro has always been the
likelihood that the monetary union would become strained, and
eventually crack, once it became clear to some member governments that
their desire to inflate their way to victory in the next election had
become incompatible with the ECB's monetary policy. Spain's recent gold
sales could mean that cracks are about to appear at the periphery of
the Union.
Update
on Stock Selections
(Note: To review the complete list of current TSI stock selections, logon at http://www.speculative-investor.com/new/market_logon.asp
and then click on "Stock Selections" in the menu. When at the Stock
Selections page, click on a stock's symbol to bring-up an archive of our comments on the stock in question)
 USEC Inc. (NYSE: USU). Shares: 87M. Recent price: US$18.21 USEC Inc. (NYSE: USU). Shares: 87M. Recent price: US$18.21
The stock price of uranium enrichment company USEC plunged during the
first three days of this week, from a high of US$22.27 on Monday to an
intra-day low of US$17.12 on Wednesday. It rebounded from the low hit
during the early going on Wednesday and ended the session at US$18.21.
The catalyst for USU's dive was a very negative article in the New York
Times (NYT). The NYT article contained nothing new; in fact, it mostly
just dredged-up negatives that have been well known for years. It had a
big effect on the stock, though, because sentiment towards USU had
recently become way too bullish. After the public becomes 'frothing at
the mouth' bullish towards any investment then that investment will
likely experience a substantial price decline if an unanticipated
negative development occurs.
We remain long-term bulls on USU. However, we recently suggested taking
profits on the stock in the $22-$24 range because it had run up too
far/fast and had become fully valued. The question now is: would we
return to the stock as buyers at this time?
The answer is no. USU is probably only 1-2 weeks into a correction that
will last at least a few months. It may not trade much lower than
Wednesday's panic low of $17.12, but in the absence of a takeover bid
for the company it is unlikely to trade appreciably higher until after
a lengthy period of basing has occurred and financing is in place for
its new centrifuge project.
Those who didn't follow our earlier suggestion to take money off the
table in USU should look to do so if it rebounds back to the low-20s
over the next few weeks.
Copper Fox (TSXV: CUU). Shares: 69M issued, 78M fully diluted. Recent price: C$1.06
In case you missed it, here is a link to Copper Fox's press release explaining why trading in the stock has been halted:
http://biz.yahoo.com/cnw/070611/copper_fox_trade_halt.html?.v=1
The bottom line is that an earlier press release understated the grade
of the Schaft Creek resource. The total resource won't change, but an
updated calculation will show a higher classification of the resource.
This is obviously good news.
Chart Sources
Charts appearing in today's commentary
are courtesy of:
http://stockcharts.com/index.html
http://www.futuresource.com/
http://www.fullermoney.com/

|