![]()
![]()
![]()
![]()
- Interim Update 13th July 2016
Copyright
Reminder
The commentaries that appear at TSI
may not be distributed, in full or in part, without our written permission.
In particular, please note that the posting of extracts from TSI commentaries
at other web sites or providing links to TSI commentaries at other web
sites (for example, at discussion boards) without our written permission
is prohibited.
We reserve the right to immediately
terminate the subscription of any TSI subscriber who distributes the TSI
commentaries without our written permission.
The Generational Bond
Bull Market
The US Treasury Bond (T-Bond)
entered a secular bullish trend in the early-1980s. As evidenced by the
following chart, over the past 30 years this trend has been remarkably
consistent.
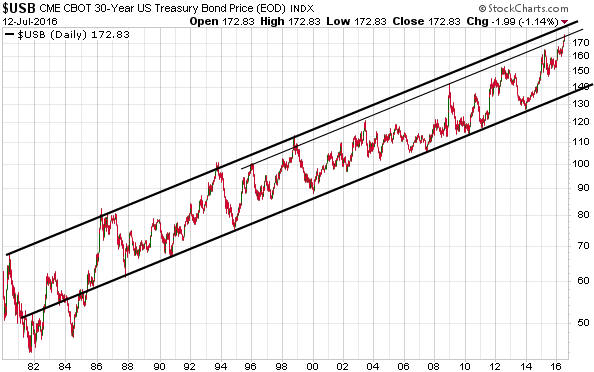
There is no evidence, yet, that the long-term bull market is over.
Furthermore, such evidence could take more than a year to materialise even
if the bull market reaches its zenith this month. The reason is that for a
decline to be clearly marked as a downward leg in a new bear market as
opposed to a correction in an on-going bull market it would have to do
something to differentiate itself from the many corrections that have
happened during the course of the bull market. In particular, it would
have to result in a solid break below the bottom of the long-term channel.
This is something that probably wouldn't happen until at least the second
half of next year even if the bull market just reached its final peak.
However, we don't need to have an opinion on whether or not the bull
market is about to end to see that the risk/reward is currently favourable
for a bearish T-Bond speculation. What we need to do is look at a) future
"inflation" indicators, which point to rising price inflation over the
coming months, b) sentiment indicators, which suggest the potential for a
large majority of speculators to be caught wrong-footed by a T-Bond
decline, and c) the position of the T-Bond within its long-term channel.
With regard to the channel position, to become as stretched to the
upside as it was at the 1986, 1993 and 1998 peaks the T-Bond would have to
move about 5 points above this month's high, but it is already at least as
stretched to the upside as it was at the 1996, 2003, 2008, 2012 and 2015
peaks.
Needless to say, we continue to like the bearish T-Bond
trade.
The Stock Market
The US
Should we anticipate a traditional
September-October crash?
Over the past few months there were
times when the US stock market seemed poised for a significant (10%+)
multi-week decline, but at no time during this period was there a
realistic chance of a crash. Furthermore, the probability of a crash
happening within the next few weeks is approximately zero. However, at
this time we can't rule out the possibility of a market crash during
September-October, a part of the year that has contained more than its
fair share of crashes throughout history*.
That being said, it is
not appropriate at this stage to take positions in anticipation of a
crash. This is because crashes in the US stock market don't just happen
out of the blue. Instead, they follow a predictable pattern and the
pattern hasn't yet begun to develop.
If the senior US stock indices
were to move sharply higher over the next few weeks then the initial phase
of a potential crash pattern would be in place, but at that point the
probability of a crash would still be very low. The crash probability
would subsequently be given a boost by a 5%-10% decline over a couple of
weeks followed by a 1-3 week rebound that ended at a lower high. A drop to
test the support level defined by the low of the initial 5%-10% decline
would then complete the pattern that makes a crash possible.
The
optimum time to take positions in anticipation of a crash is near the end
of the rebound that follows the initial 5%-10% decline, because this is
the time when it is easiest to mitigate the risk of loss (risk can be
managed via a plan to exit if the market closes at a new high) and when it
is still possible to capture the bulk of the peak-to-trough decline.
*In a
blog
post last November and again
in April we jokingly forecast that the US stock market would
crash during September-October of 2016.
Current Market Situation
In the
latest Weekly Update, we wrote:
"It's time to focus more on
accumulating exposure to commodity-related stocks and less on bearish
stock-market speculations."
And:
"The SPX is likely
to make a new all-time high this month, but it's unlikely to run away to
the upside anytime soon. Furthermore, there's a good chance that new highs
by the SPX and the Dow Industrials Index will not be confirmed by some
other important indices. An example is the NYSE Composite Index (NYA)."
Here is a chart of the NYA. The NYA broke above resistance at 10650
during the first half of this week but remains well shy of last year's
peak. That's despite the SPX having moved decisively above last year's
peak.
It will be interesting to see if the NYA can confirm the
SPX's move to a new high before short-term downside risk shifts back to
centre-stage.
Like most stock indices, the Dow Transportation Average (TRAN) has
rebounded strongly from its post-Brexit sell-off low. It has risen above
its 50-day and 200-day MAs, but still needs to break its sequence of
declining tops (by closing above 8150) to generate a clear-cut sign of
strength.
TRAN has been a leader to both the downside and the
upside over the past 20 months. The fact that it remains relatively weak
is therefore a short-term bearish sign, albeit the market's only current
short-term bearish sign.
Europe
It seems that there is almost never a
time when at least part of the European banking industry is not in crisis
mode. Currently, the entire European banking industry is in trouble, but
the Italian banks can aptly be described as being in crisis.
Italy's banking crisis has a lot to do with non-performing loans (NPLs),
which are currently estimated to be about 17% of total loans (about
10-times the level in the US). Something will have to be done, but it will
be politically difficult to implement the new rules* that require the
'bailing-in' of bond-holders. This is because many members of the Italian
voting public bought bank bonds as a way of obtaining a yield on their
liquid savings.
For a bit more information about the Italian
banking crisis refer to Joseph Salerno's
recent short post on the
topic.
It will be worth keeping a close eye on the Italian
stock market over the weeks ahead for signs that its intermediate-term
bearish trend has ended. The reason is that when the weakest
sectors/indices stop falling, the direction of least resistance for the
entire market (in this case, European equities in general) will be up.
Below is a chart of Italy's MIB Index. A daily close by this index
above 17500 would warn that an intermediate-term decline ended with a
false downside breakout in late-June.
*The EU's
Bank
Recovery and Resolution Directive (BRRD)
Commodity Stocks
As discussed in TSI commentaries over the
past few weeks we've begun to build-up exposure to non-gold
commodity-related equities, with a particular focus on the miners of
copper and other industrial metals. To reflect this shift, the stocks of
three junior resource companies (SCP.TO, TGB and XPL) were recently added
to the TSI List.
Those who want some exposure to commodity stocks
but don't want to take-on the risk of owning speculative small-caps could
consider averaging into ETFs such as COPX (for copper mining), OZR.AX (for
metals and oil production) and PICK (for industrial-metals mining and
steel production), or averaging into a large, diversified mining stock
such as BHP (buying shares of BHP is similar to buying shares of a mining
ETF). We aren't aware of any ETFs that focus on junior non-gold/silver
mining stocks.
The averaging-in aspect is worth stressing, because
this is the best way to mitigate the risk that the short-term timing is
not optimal. In fact, with regard to buying the aforementioned ETFs the
short-term timing is definitely not optimal right now. This is due to the
price run-ups of the past week. The point is that if you use an averaging
process for buying and selling then the price at which you make your
initial purchase or sale will not be critical.
In any case, there
is no need to buy with urgency at this time because if multi-year
commodity trends are in the process of turning up then the biggest gains
are likely to happen during 2017-2018.
Gold and the Dollar
Gold
After a gold rally has gone as far and generated as much speculative
enthusiasm as this year's rally, a trend reversal will usually be signaled
by a sharp decline in the SILVER price. This means that a downturn in the
gold price will probably not constitute an important trend reversal unless
it goes hand-in-hand with a sharp decline in the silver price. It's
therefore unlikely that Tuesday's $23 decline in the gold price marked the
beginning of a downward trend. The decline simply wasn't confirmed by
silver's performance.
Consequently, after the first three trading
days of this week we still have a gold market with uncomfortably-high
short-term downside risk by virtue of the rampant enthusiasm of
speculators in gold futures, but also with a decent chance of extending
its short-term upward trend before experiencing something more than a
routine pullback.
Trend-defining support for gold remains at $1308,
but a daily close below the rising 20-day MA (the black line on the
following chart) could now be used as an early warning that a trend
reversal is in the works.
Gold Stocks
The HUI spent the past 5 days
trading sideways within a narrow range. As extraordinary as the advance
from this year's low has been (it is the gold-mining sector's fastest-ever
6-month advance from a multi-year low) and as recklessly-speculative as
the rally has become, it looks like additional gains will be made prior to
a multi-month top.
In the Weekly Update we'll compare this year's
gold mining rally with what is now the only comparable rally from the
historical record.
The Currency Market
It has been an uneventful
week to date in the currency market.
The Dollar Index (see chart
below) has essentially been trading sideways in the narrow gap between
support at 96 and resistance defined by its 200-day MA. It needs to
achieve consecutive daily closes above the 200-day MA to signal an
extension of the short-term upward trend, whereas a close below 96 would
suggest that the recent upside breakout was false (a short-term bearish
signal).
We await further evidence.
Updates on Stock Selections
Notes: 1) To review the complete list of current TSI stock selections, logon at
http://www.speculative-investor.com/new/market_logon.asp
and then click on "Stock Selections" in the menu. When at the Stock
Selections page, click on a stock's symbol to bring-up an archive of
our comments on the stock in question. 2) The Small Stock Watch List is
located at http://www.speculative-investor.com/new/smallstockwatch.html
Chart Sources
Charts appearing in today's commentary
are courtesy of:
http://stockcharts.com/index.html
![]()