|
- Interim Update 13th August 2003
The Fed
gives gold investors a green light
The Fed left interest rates unchanged
at Tuesday's monetary policy meeting, something that shouldn't have surprised
anyone. What was of interest, though, was the way the Fed's monetary policy
announcement was worded. In particular, the Fed reiterated its view that
the main concern for the foreseeable future was for "undesirably low" inflation
and confirmed that short-term interest rates could stay low for a "considerable
period".
Now, Greenspan and Co. can say whatever
they want about interest rates but at the end of the day the market will
determine when short-term rates are hiked and by how much. For example,
there's a reasonable chance that bond prices will work their way higher
over the next 2-3 months, thus giving the Fed some breathing room. However,
this bond rally will most likely turn out to be a counter-trend move that
will be followed by a drop to well below the recent lows. When long-term
interest rates push above 5%, then 6%, and then start heading rapidly towards
7%, is the Fed really going to be able to or willing to hold the Fed Funds
Rate at 1%? If they did then inflation expectations would spiral out of
control, the US$ would collapse and we'd have a 4-digit gold price on our
hands. The bottom line is; regardless of what policy-makers are telling
us now, the Fed will only be able to hold the Fed Funds Rate at the current
low level beyond the next few months in the extremely unlikely event that
the US really does start to experience deflation.
The Fed's stated intention to leave
short-term interest rates at an artificially low level for as long as deemed
necessary is, however, important because it confirms that the Fed has no
desire to be pre-emptive with regard to the building inflation problem.
In effect, the Fed has confirmed that it will keep short-term rates at
a low level until the market forces it to do otherwise, that is, until
the inflation problem becomes obvious to all. This, in turn, means that
the natural hedges against a loss of confidence in the US$ are going to
have a lot more room to run than would be the case if the Fed was primarily
concerned about suppressing the effects of inflation. This is why we headed
this section with "The Fed gives gold investors a green light".
In addition to giving gold investors
a green light the Fed has just given bond investors a kick in the stomach.
This obviously wouldn't have been their intention because long-term interest
rates must remain low if the great US credit expansion is to continue,
but it would appear that the bond market is beginning to sense the inflation
problem that has been brewing now for years. So when the Fed now says it
is concerned about undesirably low inflation, thus implying that
a goal of current Fed policy is currency depreciation, bond investors head
for the hills.
But why the sudden fear on the part
of bond investors? After all, didn't everything in bond land seem rosy
just 2 months ago?
As we've argued in the past, we think
the huge run-up in bond prices (plunge in long-term interest rates) over
the first 6 months of this year was, to a large extent, a consequence of
the falling US$. Specifically, the falling dollar prompted foreign central
banks (mainly the Japanese) to aggressively buy dollars in the currency
market and these dollars were, in turn, invested in US Treasury and Agency
debt. When the dollar stopped falling a large slice of this central bank
buying support was removed and US bonds were left to trade based on their
own fundamentals. Therefore, a resumption of the dollar's downward trend
will probably coincide with the start of a sizeable rally in the bond market.
The Fed is continually trying to manage
inflation expectations in order to get the markets to behave in a particular
way. The problem is; the gap between what the Fed wants the markets to
do and what the markets should be doing based on the reality of
the situation is becoming unmanageable.
Bonds
The initial sharp decline following
a major peak tends to bottom about 2 months after the peak. If the US bond
market follows this pattern then the initial decline from its mid-June
peak should bottom around...now.
Below is a daily chart of September
T-Bond futures. Yesterday's plunge in the bond price could turn out to
be a test of the 1st August low or a spike to a new low might occur in
the immediate future. Either way, there is a reasonable chance that bonds
are within a few days of an intermediate-term bottom and that the NEXT
upward reversal in the bond market will be followed by a multi-month rally.
The US
Stock Market
Current Market Situation
Semiconductor equipment manufacturer
Applied Materials (NASDAQ: AMAT) announced its latest quarterly results
after the close of trading on Tuesday. In the ensuing conference call with
analysts the company's management said that next quarter's revenue would
be about 10% lower than previously expected, but at the same time they
talked about how business was starting to improve. The stock was up 3.4%
on Wednesday which clearly shows that stock-market participants are generally
still willing to believe 'spin' over facts. This, in turn, is a bullish
factor because it indicates a high tolerance for risk.
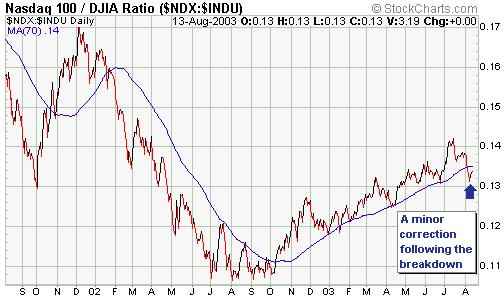
Below is a 2-year chart of the NASDAQ100/Dow
ratio. This ratio broke down last week, a definitively bearish signal because
it indicated that market participants were starting to become more risk
averse (something that tends to happen in the early stages of a major decline).
However, as mentioned above the market's reaction to the AMAT earnings
report and guidance indicates the opposite. The most likely explanation
for this apparent discrepancy is that a change in trend was confirmed last
week and that the action over the first 3 days of this week was a counter-trend
move.
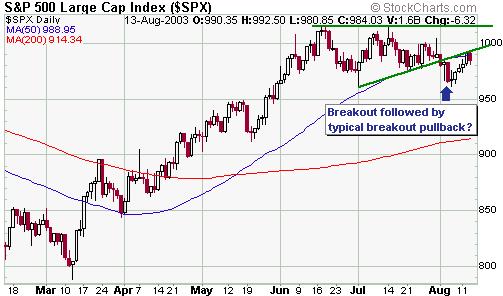
The S&P500 Index broke below the
bottom of its 2-month consolidation pattern at the beginning of last week
and has since rebounded in what appears to be a normal test of the breakout
(see chart below). If this is the correct interpretation then the S&P500
and the other major stock indices should begin to head lower almost immediately.
However, a daily close above 995 would negate this view and suggest that
a rally to new recovery highs was underway.
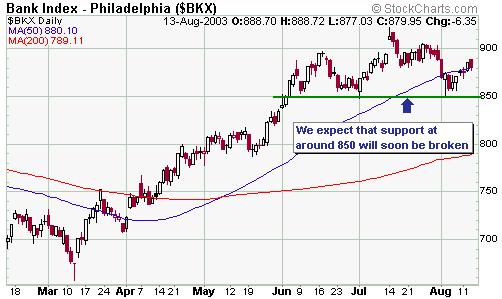
Below is a chart of the Bank Stock
Index (BKX). With a major peak in the bond market now behind us the bank
stocks are most likely going to be relatively poor performers over the
next 6-12 months. There is an outside chance that the counter-trend rally
in the bond market that we expect to begin from whatever low is set this
month will be sufficient to boost the BKX to a marginal new high for the
year. It is, however, much more likely that an important peak for the BKX
is already in place and that support at 850 will be taken out over the
coming few weeks.
Just to be clear, there is no change
to our short and medium-term views as outlined in recent commentaries.
That is, we are expecting near-term weakness in the stock indices and have
reason to believe that major peaks in some of the indices (e.g., the NDX
and the BKX) are already in place. However, we expect that both the S&P500
Index and the Dow Industrials Index will make new recovery highs over the
next few months BEFORE a major decline in the overall market gets underway.
Commodity-Cyclical Stocks
Here's a quick review of the charts
of some of the most important commodity-cyclical stocks:
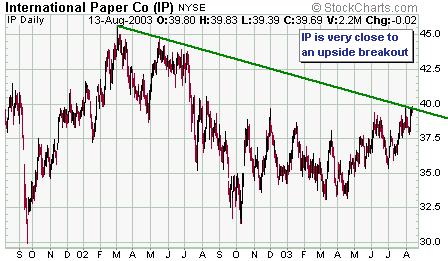
a) A daily close above $40 will not
only break the intermediate-term downtrend in the International Paper (NYSE:
IP) stock price shown on the below chart, it will also break the major
downtrend that has been in force since January of 2000. We have IP and
IP call options in the TSI Stocks List in anticipation of such an upside
breakout.
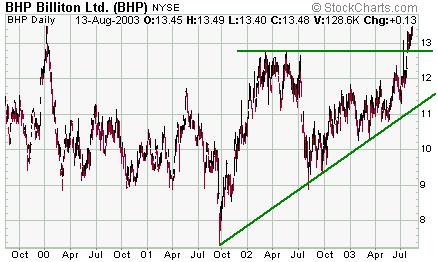
b) In US$ terms, BHP, the world's largest
diversified natural resource company, has been in an up-trend since September
of 2001 and is currently near its all-time high.
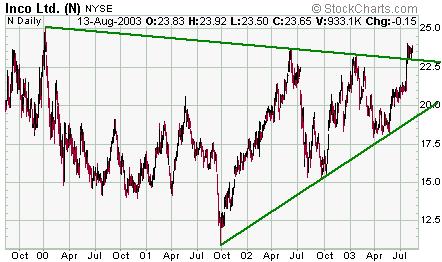
c) The below chart shows the US$ stock
price of base-metals producer Inco. The Inco chart looks quite similar
to the BHP chart (both stocks have been in upward trends for around 2 years,
have recently broken out to the upside and are close to the peaks reached
in early 2000).
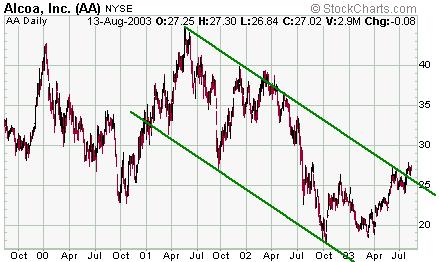
d) Alcoa broke out of a 2.5-year downward
trend about 2 weeks ago.
Even if you don't trade on the stock
market the price action in certain stocks can provide useful information.
For example, if you were interested in figuring out what retail sales were
going to be like over the next 6 months then you would probably benefit
from monitoring the Walmart stock price. Similarly, the above charts contain
clues with regard to future economic growth and commodity prices.
Although the charts of the major commodity-cyclical
stocks have moved up quite sharply over the past few months the charts
do not suggest that important peaks are close at hand. On the contrary,
these stocks appear to have considerable upside potential over the next
few months. This, in turn, suggests that global growth is going to reasonably
strong over the next 6-9 months and that commodity prices will move to
new multi-year highs once the current correction has run its course.
Gold and
the Dollar
The bull market in gold stocks
In the latest Weekly Update we commented
that if we owned any major gold stocks we'd start scaling out of these
positions and would perhaps shift the proceeds into physical gold. We said
this due to the high prices of many of the major gold stocks and the gold
stock indices relative to the gold price. Gold stocks are generally considered
to be leveraged plays on the gold price, but if the current prices of gold
stocks already discount a substantially higher gold price then this leverage
has, in effect, been removed. Considering that the risk in owning a gold
stock is typically a lot higher than the risk of owning gold bullion there
is no reason for investors to own gold stocks in preference to the bullion
unless they can obtain greater leverage to the gold price by doing so.
The senior gold stocks being more than
fully priced relative to the current gold price is a sign that risk is
increasing and that we are potentially close to an intermediate-term peak,
but it is not a sign that an end to the gold-stock bull market is imminent.
In fact, what appears to be underway is just the sort of progression that
normally occurs during any major rally in the stock market. First, investors
bid up the prices of the high-profile large-cap stocks. Then a gradual
shift towards the more speculative end of the market occurs.
If we were close to the end of the
gold stock bull market then most of the junior gold stocks would be very
expensive relative to the amount of gold they have in the ground. However,
that is clearly not the case right now (as per the valuation analysis included
in the latest Weekly Update, many junior gold stocks still offer excellent
value and considerable leverage to the gold price). The public is yet to
get enthusiastic about the gold stocks and all we've really seen to date
is that a few of the larger and reputedly safer gold stocks - the ones
that would tend to be favoured by institutions - have been pushed significantly
higher than where they really should be based on the current gold
price.
In recent commentaries we've described
what we consider to be the two most likely outcomes for the gold price
over the remainder of this year. The first is that gold will soon embark
on a rally that will take the price above $400 while the other is that
gold will continue its consolidation for a few more months before taking
off. Either way, the fundamental backdrop strongly suggests that the direction
of the next big move in the gold market will be up and price action continues
to confirm such an outlook. As such, and with our junior gold stocks generally
being under-valued relative to the CURRENT gold price, we don't think it
is wise to be taking much money off the table at this time as far as the
junior gold stocks are concerned. Profit-taking opportunities will arise
from time to time in individual issues and we'll do our best to identify
such opportunities, but we think that whole-scale selling at this stage
would be a mistake.
Gold
Earlier in today's commentary we said
that the Fed has just given gold investors a green light. This doesn't
mean that the gold price will necessarily rocket higher over the next few
weeks, but rather that the underlying trend for gold is going to remain
bullish for some time. Prior to the Fed meeting our analysis already told
us that a gold price of at least $450 was 'written on the wall' as far
as the coming 12 months were concerned. The Fed's reiteration of its promise
to pursue currency devaluation for the foreseeable future just increases
our confidence that we are going to be right about this. The 'writing on
the wall' is, however, only readable if you are standing a good distance
from the wall.
In the short-term the outlook for gold
is ambiguous. A daily close above $378 would confirm to us that a rally
to over $400 was in progress. Due to the recent strength of the gold shares
we would put the odds at about 60% that such a rally was already underway.
Alternatively, the consolidation that began in February could extend for
a while longer with the gold price perhaps spiking below its 200-day moving
average before embarking on the rally that will take it above $400.
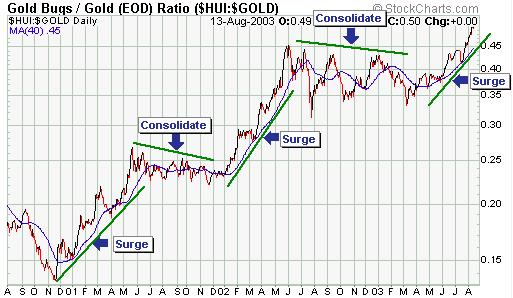
Below is a 3-year chart of the HUI/gold
ratio with a 40-day moving average. During those periods in which the ratio
was surging higher, as it is now, pullbacks have tended to end at around
the 40-day MA. If such a pullback occurred now it would result in a 10%
fall in the HUI relative to the gold price. This, we think, defines
the downside risk in the HUI assuming the bullish trend remains intact.
At some point, of course, the HUI/gold ratio will break decisively below
its 40-day MA and we will have a sign that the bullish trend has ended.
Currency Market Update
Below is a weekly chart of the Swiss
Franc. Shortly after the SF peaked we identified support in the 0.70-0.72
range as a likely area for a correction low to occur. The SF reached this
support in July and has since rebounded. Another test of the 0.70-0.72
range over the next few weeks would not surprise us, but the rapid rate
at which commercial traders have purchased SF futures during the pullbacks
suggests that this support will hold. If support at 0.70 is breached then
a drop to 0.66 would become likely, but this is not a possibility we are
seriously considering at this stage. It would, however, be worth giving
serious consideration to such a possibility if the SF moved up to at least
0.76 and then dropped back to 0.72.
Below is a daily chart of the September
Swiss Franc futures. The SF has resistance at around 0.7480 defined by
its late-July peak, but there is more important resistance just a bit higher
at 0.7550. A daily close above 0.7550 would suggest that a rally to a new
high for the year was underway.
Update
on Stock Selections
 We
are going to add a trading position in anticipation of a rebound in the
bond market over the next 1-3 months. Specifically, we will add the TLT
December 2003 $85.00 call options (TLTLG) to the Stock List if they trade
down to $0.90. In order for the options to trade this low bonds will need
to move at least 1 point below yesterday's closing level. (TLT is the symbol
on the AMEX for the 20+ Year Treasury Bond Fund). We
are going to add a trading position in anticipation of a rebound in the
bond market over the next 1-3 months. Specifically, we will add the TLT
December 2003 $85.00 call options (TLTLG) to the Stock List if they trade
down to $0.90. In order for the options to trade this low bonds will need
to move at least 1 point below yesterday's closing level. (TLT is the symbol
on the AMEX for the 20+ Year Treasury Bond Fund).
As
discussed in recent commentaries we are generally not enthusiastic about
the major North American gold stocks simply because they have moved up
too far relative to the gold price. There is, however, one exception.
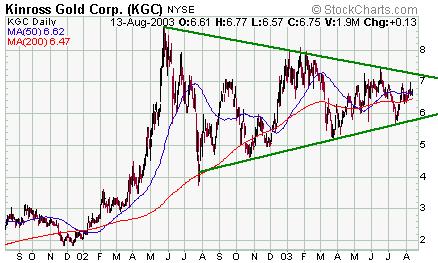
The exception is Kinross Gold (NYSE:
KGC, TSX: K), a stock that has lagged many of the other large and mid-size
NA gold producers over the past few months. Whereas the AMEX Gold BUGS
Index (HUI) has broken upwards out of its lengthy consolidation range,
KGC remains within its own 14-month-long consolidation pattern (see chart
below). It would be very unusual if KGC's consolidation didn't end in an
upside breakout, particularly considering the price action in leading stocks
such as NEM. Therefore, KGC looks interesting from a technical perspective.
It also looks interesting from a valuation perspective because its reserves
are selling at a substantial discount to those of the other NA gold producers
that have market caps in excess of US$1B. For example, KGC's reserves are
priced at about a 70% discount to Goldcorp's reserves, a 50% discount to
Glamis Gold's reserves, and a 30% discount to Newmont's reserves. These
discounts appear to be too high given that we are in a rising gold price
environment.
KGC is a reasonable buy at its current
level, as are the Kinross warrants (TSX: K.WT) that we added to the TSI
Stocks List via the e-mail that was sent to paid-up subscribers earlier
this week. (Three warrants plus C$15 can be exchanged for one share at
any time prior to December 2007).
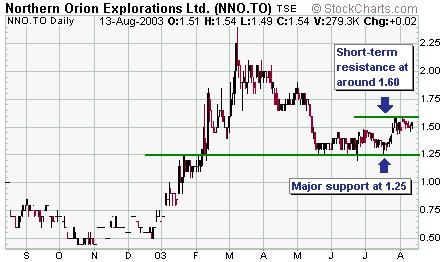
Northern
Orion (TSX: NNO) is a stock with substantial upside potential. The stock
is highly leveraged to copper and gold prices, but as advised in the above-mentioned
e-mail even more leverage can be obtained by buying the NNO warrants (TSX:
NNO.WT). The warrants have an exercise price of C$2.00 and an expiry date
of May 2008.
In
last week's Interim Update we said that Golden Phoenix (OTCBB: GPXM) was
showing signs that it was about to move higher. The stock was trading at
US$0.32 at the time and it subsequently traded as high as 0.50 before closing
at 0.45 on Wednesday. New buying would be appropriate on a pullback to
0.37. Also, we plan to take profits on GPXM if it moves up to the 0.54-0.60
range.
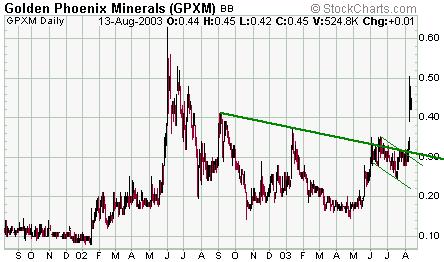
Chart Sources
Charts appearing in today's commentary
are courtesy of:
http://stockcharts.com/index.html
http://www.futuresource.com/

|
