![]()
![]()
![]()
![]()
- Interim Update 13th September 2017
Copyright
Reminder
The commentaries that appear at TSI
may not be distributed, in full or in part, without our written permission.
In particular, please note that the posting of extracts from TSI commentaries
at other web sites or providing links to TSI commentaries at other web
sites (for example, at discussion boards) without our written permission
is prohibited.
We reserve the right to immediately
terminate the subscription of any TSI subscriber who distributes the TSI
commentaries without our written permission.
Gold and the Yield
Curve
The yield curve is a remarkably
useful leading indicator of major economic and financial-market events.
For example, its long-term trend can be relied on to shift from flattening
to steepening ahead of economic recessions and equity bear markets. Also,
usually it will remain in a flattening trend while a
monetary-inflation-fueled boom is in progress. That's why we consider the
yield curve's trend to be one of the true fundamental drivers of both the
stock market and the gold market. Not surprisingly, when the yield curve's
trend is bullish for the stock market it is bearish for the gold market,
and vice versa.
A major steepening of the yield curve will have one
of two causes. If the steepening is primarily the result of rising
long-term interest rates then the root cause will be rising inflation
expectations, whereas if the steepening is primarily the result of falling
short-term interest rates then the root cause will be increasing risk
aversion linked to declining confidence in the economy and/or financial
system. The latter invariably begins to occur during the transition from
boom to bust.
A major flattening of the yield curve will have the
opposite causes, meaning that it could be the result of either falling
inflation expectations or a general increase in economic confidence and
the willingness to take risk.
On a side note, the conventional
wisdom is that a steepening yield curve is bullish for the banking system
because it results in the expansion of banks' profit margins. While
superficially correct, this 'wisdom' ignores the reality that one of the
two main reasons for a major steepening of the yield curve is widespread,
life-threatening problems within the banking system. For example, the
following chart shows that over the past three decades the US yield curve
experienced three major steepening trends: the late-1980s to early-1990s,
the early-2000s and 2007-2011. All three of these trends were associated
with economic recessions, while the first and third got underway when
balance-sheet problems started to appear within the banking system and
accelerated when it became apparent that most of the large banks were
effectively bankrupt.
Continuing with the side note, here's an
analogy that hopefully helps explain the relationship (under the current
monetary system) between major yield-curve trends and the
economic/financial backdrop: Saying that a steepening of the yield curve
is bullish because it eventually leads to a stronger economy and
generally-higher bank profitability is like saying that bear markets are
bullish because they eventually lead to bull markets; and saying that a
flattening of the yield curve is bearish because it eventually -- after
many years -- is followed by a period of severe economic weakness is like
saying that bull markets are bearish because they always precede bear
markets.
Both rising inflation expectations and increasing risk aversion tend
to boost the general desire to own gold, whereas gold ownership becomes
less desirable when inflation expectations are falling or
economic/financial-system confidence is on the rise. Consequently, a
steepening yield curve is bullish for gold and a flattening yield curve is
bearish for gold.
As discussed in a
TSI
blog post earlier this week, the US yield curve's trend has not yet
reversed from flattening to steepening. This means that the yield curve's
present situation is bullish for the stock market and bearish for the gold
market.
Currently, of the seven inputs to our Gold True
Fundamentals Model (GTFM) the yield curve is the only one that isn't
bullish.
The Stock Market
The S&P500 Index (SPX) broke
into new high territory over the past three days. This doesn't necessarily
mean that significant additional gains are going to occur, but it does
change the pattern from what was expected.
A September low is now
out of the question, but there is still a realistic chance of an October
low. A lot depends on what happens over the next few days. In particular,
a downward reversal followed by a daily close below 2460 would create a
very bearish set-up, while an ability to hold above 2480 until the end of
next week would suggest that we are dealing with a genuine upside breakout
and a significant extension to the upward trend that got underway last
November.
Gold and the Dollar
Gold
Looking for some historical context
In euro terms the early-July low in the gold price was below the
December-2016 low. In fact, it was a 16-month low. Also, in euro terms the
gold rebound from the early-July low has done no more to date than take
the price up to the declining 200-day MA. Refer to the following daily
chart for details. An implication is that this year's rise in the US$ gold
price has a lot more to do with US$ weakness than genuine gold-market
strength.
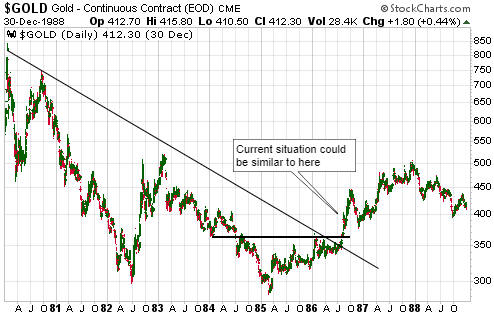
At this stage 1986-1987, when a gold rally occurred alongside an
upward-trending stock market, an economic expansion and a
downward-trending US$, appears to be a more relevant historical parallel
than 2001-2002, when a gold rally occurred alongside an equity bear
market, an economic recession and a topping US$. In particular, the
current situation could be similar to September-1986. At that time, in
response to relentless US$ weakness the US$ gold price broke above
intermediate-term lateral support and a long-term trend-line. Here's the
associated chart:
And here's a chart showing the current situation:
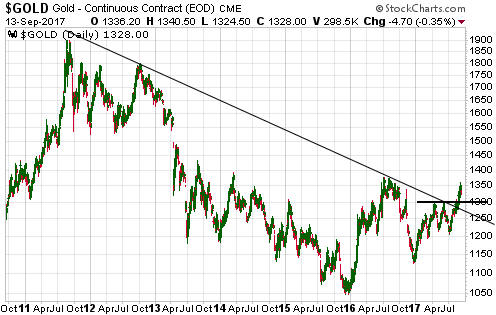
The impressive upside breakout in the US$ gold price in Q3-1986 was
not confirmed by an upside breakout in the gold/SPX ratio and did not
indicate that a new gold bull market was underway. However, there was
still plenty of money to be made over the ensuing 12 months from owning
gold-related investments, especially gold-mining stocks.
Current Market Situation
A
gold-price correction has begun. If this is a routine pullback to address
the short-term 'overbought' condition that existed at the end of last week
then it should end at or above former resistance (now support) at $1300.
However, as stated in the latest Weekly Update:
"In previous
instances over the past 35 years when the gold price made a short-term
bottom during June-July and then rallied strongly into the first half of
September, the 50-day MA became an important demarcation level. As long as
declines did not decisively breach this MA then the rally was intact and a
move to well above the September high was in store prior to year-end,
whereas a decisive breach of this MA was a reliable signal that an
intermediate-term top was in place."
In other words, a
pullback could continue to the 50-day MA (the blue line on the following
chart) without presenting a problem to the short-term bullish case. The
50-day MA is rising and at its current rate of ascent will reach $1300
near the end of this month.
Gold Stocks
The gold-mining sector has begun
to 'correct' along with the US$ gold price.
Gold-mining
corrections within short-term upward trends typically last 4-8 trading
days. The current correction is 4 days old, which means that it may
already be at least half complete.
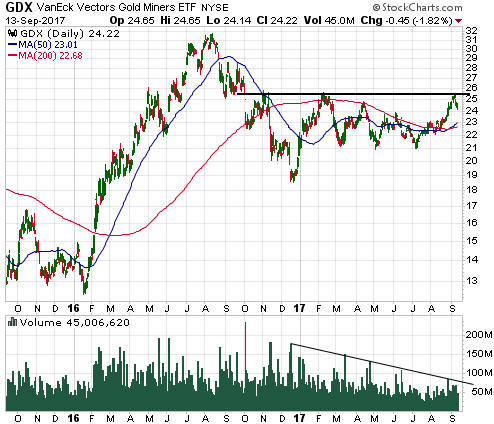
We don't put much emphasis on
trading volume, but we are a little concerned that the recent sharp moves
higher by gold-mining ETFs such as GDX were not accompanied by volume
surges. In fact and as illustrated by the following daily chart, GDX
volume has trended downward during the entire rally from the December-2016
low.
Perhaps this just means that the gold-mining ETFs will have to
break above their February highs to generate some enthusiasm.
US$ weakness to the rescue
Under the weight of
its own over-valuation, the Chinese Yuan weakened relentlessly for about
18 months prior to December of last year. In doing so it created two
problems for China's government.
First, in its efforts to slow the
pace of the Yuan's depreciation China's government was rapidly 'eating up'
its foreign currency reserves to the extent that by late last year the
efforts had consumed more than 1 trillion US dollars. That still left
almost 3 trillion dollars, but at the rate the reserve pile was being
reduced there was a genuine risk that in the not-too-distant future the
government would lose its most important exchange-rate-manipulation tool.
Second, even though China's government was acting to prop-up the Yuan,
Donald Trump, due to either ignorance or a willingness to say anything to
get votes, was citing the Yuan's weakness as evidence that China's
government was attempting to gain a trade advantage at the expense of the
US. Consequently, the Yuan weakness led to a perception problem that
potentially could have been the catalyst for a US-China trade war
following Trump's election victory.
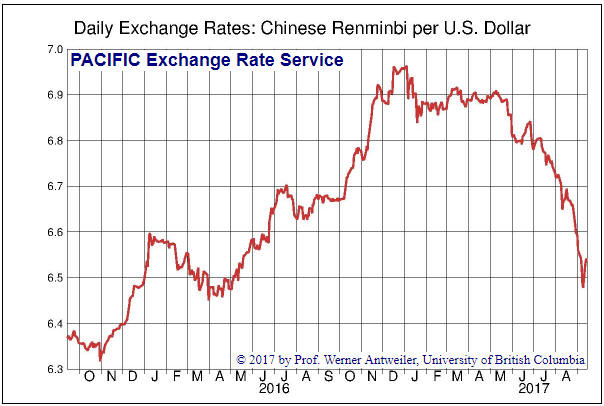
Fortunately for all concerned,
the Yuan stopped weakening at the beginning of this year and in May of
this year began to strengthen at a relatively fast pace. As illustrated by
the following chart, against the US$ it has now recouped all of last
year's loss. Note that the chart shows the number of Yuan to the US$, so a
falling line indicates a strengthening Yuan and a rising line indicates
relative weakness in the Yuan.
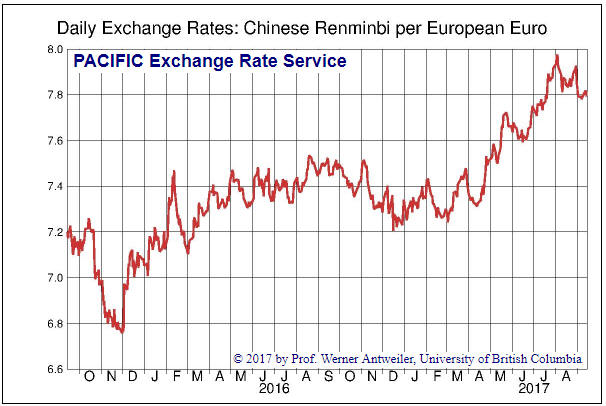
This year's strength in the Yuan relative to the US$ was not caused by
the actions of China's government. It was, instead, caused by weakness in
the US$ that had nothing to do with China. We know that this is the case
because the next chart shows that the Yuan has continued to weaken against
the euro (again, a rising line indicates relative weakness in the Yuan).
In fact, relative to the euro the Yuan is about 5% lower today than it was
at the start of this year.
China's government did not cause this year's strong rebound in the
Yuan relative to the US$, but there is no doubt that it has benefited.
First, it has not only been able to stop consuming its FX reserves, it has
also begun to replenish its reserves. This eliminates the short-term risk
that it will run out of reserves, but more importantly it results in
looser monetary conditions in China (the selling of currency reserves
takes money out of the local economy whereas the accumulation of currency
reserves injects new money into the local economy). Second, the Yuan's
strength relative to the US$ greatly reduces the threat of an all-out
trade war with the US. In fact, it creates the impression that China's
government is going out of its way to support the efforts of the new US
Administration.
Updates on Stock Selections
Notes: 1) To review the complete list of current TSI stock selections, logon at
http://www.speculative-investor.com/new/market_logon.asp
and then click on "Stock Selections" in the menu. When at the Stock
Selections page, click on a stock's symbol to bring-up an archive of
our comments on the stock in question. 2) The Small Stock Watch List is
located at http://www.speculative-investor.com/new/smallstockwatch.html
![]() The
TSI Stocks List has short-term bearish speculations in the form of VIX
October $15 call options and Amazon (AMZN) October $800 put options. The
VIX is capable of gaining 50%-100% or more within the space of a few days,
so there is still time for the VIX call-option position to work. However,
even if we are right to interpret AMZN's price pattern as a "head and
shoulders" top (see chart below) there's now a high risk that the pattern
will take more time to complete than we have left in our October options.
For TSI record purposes we are therefore 'rolling' from the October to the
December $800 puts.
The
TSI Stocks List has short-term bearish speculations in the form of VIX
October $15 call options and Amazon (AMZN) October $800 put options. The
VIX is capable of gaining 50%-100% or more within the space of a few days,
so there is still time for the VIX call-option position to work. However,
even if we are right to interpret AMZN's price pattern as a "head and
shoulders" top (see chart below) there's now a high risk that the pattern
will take more time to complete than we have left in our October options.
For TSI record purposes we are therefore 'rolling' from the October to the
December $800 puts.
The cost of doing the 'roll' is the price paid
for the December options minus the price received for the October options.
This cost is added to the trade's original entry price to get the
new/revised entry price.
Based on the middles of Wednesday's
closing bid-offer spreads, the cost is $3.59 ($4.45 for the December puts
minus $0.86 for the October puts). This gives us a revised entry price of
$6.52 ($2.93 plus $3.59) for the AMZN put-option trade.
Chart Sources
Charts appearing in today's commentary
are courtesy of:
http://stockcharts.com/index.html
http://fx.sauder.ubc.ca/plot.html
![]()