![]()
![]()
![]()
![]()
- Interim Update 13th October 2015
Copyright
Reminder
The commentaries that appear at TSI
may not be distributed, in full or in part, without our written permission.
In particular, please note that the posting of extracts from TSI commentaries
at other web sites or providing links to TSI commentaries at other web
sites (for example, at discussion boards) without our written permission
is prohibited.
We reserve the right to immediately
terminate the subscription of any TSI subscriber who distributes the TSI
commentaries without our written permission.
Objective and
Subjective Selling Opportunities
There are two general reasons
for a trader with an intermediate-term or a long-term time horizon to sell a
stock during a period of strength. The first encompasses the situations where
the stock has reached the trader's price target or has become stretched to the
upside in valuation terms or has reached a price level at which the
intermediate-term risk/reward is no longer favourable. When a stock is in such a
position it offers what we'll refer to as an "objective selling opportunity".
The second general reason is that even though a stock is not yet fully valued
and is still well below the trader's intermediate-term target, selling makes
sense based on personal money-management considerations. We'll refer to this as
a "subjective selling opportunity".
With regard to the stocks we cover at TSI and the stocks we own, objective
selling opportunities have been as scarce as hen's teeth over the past 2.5
years. However, over this period there have, from our perspective, been many
subjective selling opportunities. A good example of "subjective" selling into
strength is provided by our handling of Evolution Mining (EVN.AX) over the past
several months.
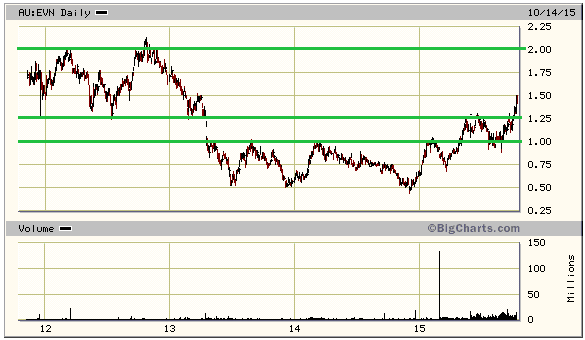
Due to its relatively good performance and low risk, by the time EVN rose to the
A$1.20s in May it was easily our largest position. It was also about to
encounter resistance at around A$1.25. Therefore, despite our strong belief that
the stock would make significant additional headway over the ensuing 6 months we
sold about 25% of our position at that time. We subsequently took advantage of
price weakness in July to re-purchase the shares that were sold in May, but due
to the stock's recent rise to a new 2-year high we again found ourselves in the
position where, from a money-management perspective, it made sense to do some
selling. Accordingly, we again sold about 25% of our position at A$1.45-$1.50
early this week. We did so despite the fact that we expect the stock to trade at
A$2.00 within the coming 6 months.
We obviously can't identify subjective selling opportunities for our readers as
these opportunities are, by definition, determined by each individual's
financial position. The best we can do is note when TSI stocks are becoming
'overbought' or nearing resistance that could limit the short-term upside.
The Stock Market
The US
We doubt that the S&P500 Index (SPX) will revisit its August and September lows
over the remainder of this year, but a decline that retraces at least half of
the rebound from late-September bottom is likely to begin before the end of this
month. It's possible that such a decline began on Tuesday 13th October, although
it's also possible that the SPX will rise to near resistance at 2050 before
commencing a multi-week move to the downside.
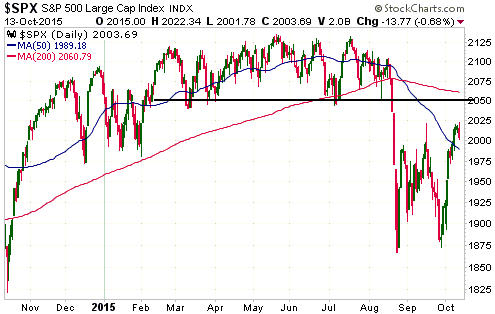
If at any time from here on the SPX closes below its 24th August low of 1867 it
will leave little doubt that a bear market has begun. Looking at it from a
different angle, as long as the August low isn't breached there will still be a
realistic chance that the bull market is intact.
Europe
Despite the much faster monetary inflation rate in the euro-zone, the EURO STOXX
50 Index (STOX5E) has been weak relative to the SPX since April. Moreover, the
relative weakness has persisted over the past month, in that the STOX5E's rally
from its late-September low has been unable to exceed either its September high
or its 50-day MA.
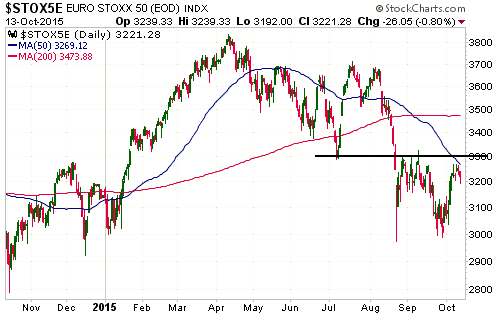
It's a good bet that the European refugee/migrant crisis has been more than
offsetting the effects on stock prices of the ECB's ultra-'accommodative'
monetary policy. The flood of refugees and migrants from Syria and other
countries into Europe over the past few months is likely to cause both economic
and social problems in some important European countries, including Germany,
over the coming 12 months. We currently don't know enough about this issue to
write about it in detail, but it appears to have the potential to cause
large-scale capital flight from Europe.
Gold and the Dollar
Gold
What changed?
Why have gold and gold-mining stocks, which for several months couldn't seem to
get out of their own way, recently started trading more positively?
Aside from bear-market-ending sentiment extremes, we can identify four
catalysts. The most obvious is the downgrading of interest-rate expectations
prompted initially by the Fed's decision not to take action at its mid-September
meeting and reinforced by the lousy US Employment Report on 2nd October.
A less obvious catalyst -- and this is just a guess on our part -- is that even
though the US stock market successfully tested its August low in late-September
there has been a significant increase in the number of market participants who
suspect that an equity bear-market has begun. This is evidenced by the results
of the Investors Intelligence sentiment survey, the latest of which showed that
34.4% of advisors were bearish. As recently as two months ago the bearish
percentage was well below 20.
Another non-obvious (to most analysts and observers) catalyst is the change in
the banking sector's relative strength. The major bank stocks began to weaken
relative to the SPX on 24th July and the US$ gold price bottomed for the year on
the same day.
The fourth catalyst is that Fed representatives have begun to hint at the
possibility of the Fed's interest-rate target being lowered into negative
territory. This reflects a mindboggling level of ignorance on the part of these
monetary central planners and therefore ties in with the overarching theme that
gold's perceived value is the reciprocal of confidence in the central bank. It
almost defies belief that with seven years of ZIRP having failed to promote
sustained strength in the economy, people with training in economics could
conclude that zero must be too high and that what's really needed is a negative
interest rate.
Current Market Situation
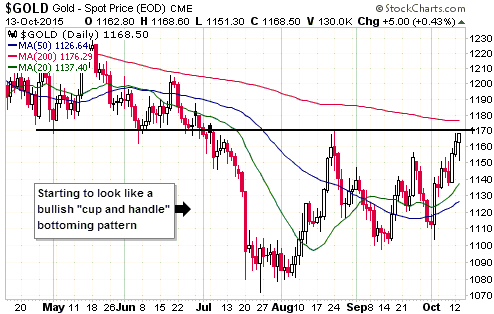
The US$ gold price rose to test important lateral resistance at $1170 on Monday
before dropping back a little. On Tuesday it initially fell to around $1150
before returning to $1170 for another test of resistance.
The price action suggests that additional gains will be made before a short-term
top is in place, but even if this is the correct interpretation there is no way
of hazarding an educated guess as to exactly when a solid break above $1170 will
happen. It could happen today. Alternatively, there could be some 'backing and
filling' in the $1150-$1170 range prior to an upside breakout.
What would invalidate the short-term bullish outlook?
A daily close below the 20-day MA (the green line on the following chart) would
do it. This MA ended Tuesday's session at $1137, but it is rising rapidly and
could soon be high enough to provide timely indication of a downward trend
reversal.
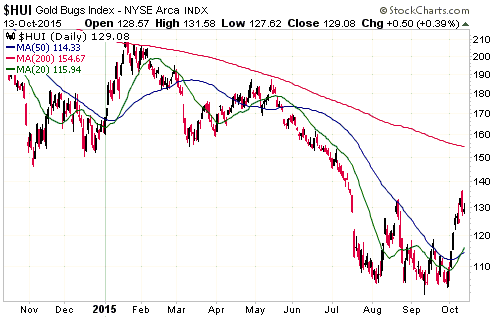
Gold Stocks
The HUI made a new 2-month high on Monday and then reversed course. At this
stage we do not expect anything more bearish than a multi-day correction to the
short-term upward trend.
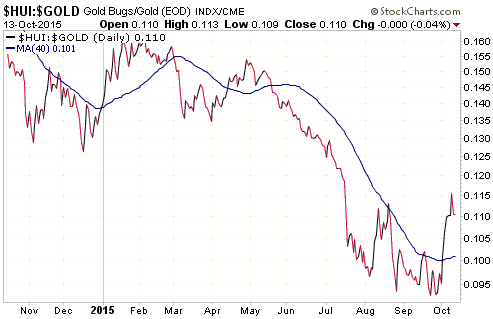
The HUI/gold ratio also reversed course after making a new 2-month high on
Monday. Corrections are normal and should not come as a surprise, especially
when the preceding advance has been near-vertical.
The gold-mining sector's early-October upward reversal was confirmed when the
HUI/gold ratio broke above its 40-day MA (the blue line on the following chart).
Unfortunately, it is probably going to take a few weeks for the 40-day MA to get
into a position where it can again be used as a demarcation line between bullish
and bearish.
The Currency Market
Almost regardless of valuation and other considerations, the performance of the
Australian Dollar (A$) tends to be dominated by what's happening to commodity
prices. With commodity prices having rebounded over the past several weeks, the
A$ has done the same.
Prior to last week the A$ had spent about 5 months within the confines of a
downward-sloping channel, but last week it responded to strength in the
commodity markets and broke above the top of this channel. It also broke above
its 50-day MA.
The upside breakout led to quick additional gains of almost 2 points and
resulted in the currency becoming short-term 'overbought' (based on the daily
RSI included at the bottom of the following chart). The 'overbought' condition
and some weakness in commodity prices paved the way for a sharp pullback on
Tuesday 13th October.

To signal an intermediate-term trend reversal the A$ will have to achieve a
weekly close above 76. As per the A$-commodity relationship mentioned above,
whether it is able to generate this reversal signal will largely depend on
whether commodity prices have turned the corner on an intermediate-term basis.
We don't know if commodity prices have turned the corner on an intermediate-term
basis. An early sign that they have, or are about to, will come from the gold
market. Gold tends to lead the commodity world at important bottoms and is
therefore likely to signal an intermediate-term reversal to the upside before
the broad-based commodity indices do the same.
An intermediate-term reversal in the gold market would be signaled by a weekly
close above US$1180.
Updates on Stock Selections
Notes: 1) To review the complete list of current TSI stock selections, logon at
http://www.speculative-investor.com/new/market_logon.asp
and then click on "Stock Selections" in the menu. When at the Stock
Selections page, click on a stock's symbol to bring-up an archive of
our comments on the stock in question. 2) The Small Stock Watch List is
located at http://www.speculative-investor.com/new/smallstockwatch.html
![]() As
confirmed in the email sent to subscribers after Monday's trading session,
shortly after the start of trading on Monday the TSI position in GDX
January-2016 $18 call options reached the sell target mentioned in the latest
Weekly Update and has therefore been exited.
As
confirmed in the email sent to subscribers after Monday's trading session,
shortly after the start of trading on Monday the TSI position in GDX
January-2016 $18 call options reached the sell target mentioned in the latest
Weekly Update and has therefore been exited.
 Dragon Mining (DRA.AX). Share Count: 89M. Recent Price: A$0.19
DRA is a junior gold producer with mines in Finland and Sweden. Its stock is too
illiquid to be part of the TSI Stocks List. In fact, some days it doesn't trade
at all. However, it is part of the
TSI Small
Stocks Watch List and, considering its very low valuation, is a reasonable
candidate for accumulation by intrepid speculators with access to the Australian
stock exchange.
The low valuation is evidenced by the fact that despite being debt free and
having profitable gold-mining operations in politically-secure locations, DRA's
stock market capitalisation is comfortably below the value of its cash. Based on
its latest financial reports, it has about A$0.25/share of cash.
DRA shares are a good speculation at A$0.18-$0.20.
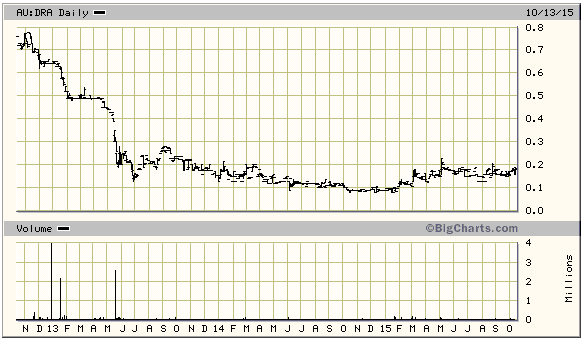
Chart Sources
Charts appearing in today's commentary
are courtesy of:
http://stockcharts.com/index.html
http://bigcharts.marketwatch.com/
![]()