|
- 13 November, 2002
The US
Stock Market
Current Market Situation
Just a few brief comments on the stock
market today because nothing of significance has happened since our previous
commentary and we want to devote most of today's commentary to the gold
and currency markets.
First, short-term sentiment indicators
such as put/call ratios and volatility indices have not yet reached levels
that would normally be associated with a peak. As such, we would not be
surprised if the stock indices exceeded last week's peaks before the next
major decline got underway. However, a concern we have, and the reason
we have already established some put option positions, is that we are 3
years into a bear market and, therefore, the market might not get as 'overbought'
as it has in the past before resuming its downtrend.
Second, short-term sentiment indicators
might not have reached extremes, but some medium-term indicators certainly
have. For example, after hitting an 8-year low of 28% just 4 weeks ago,
the sentiment survey conducted by Investors' Intelligence shows that the
percentage of investment-newsletter writers who are bullish is now above
50%. This means that investment advisors are now more bullish than they
were at the time the market was peaking in August, even though the S&P500
Index is presently well below its August peak.
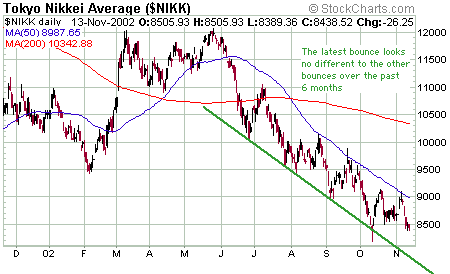
Third, Japan's Nikkei225 Index closed
at 8,322 today, a new 19-year low on a daily closing basis (note that the
below chart doesn't show today's trading). It is still marginally above
its 10th October intra-day low, so at this stage an optimist could suggest
that we are just seeing a test of the October low. However, the rally off
the 10th October low was weak - the Nikkei was unable to surmount its 50-day
moving-average during the rally and began to roll over after heading higher
for only a few days. So, the price action certainly does not provide any
evidence that 10th October gave us anything more significant than an interim
low. At this stage US market participants are doing a good job of ignoring
the goings-on in Japan. We think they are making a big mistake.
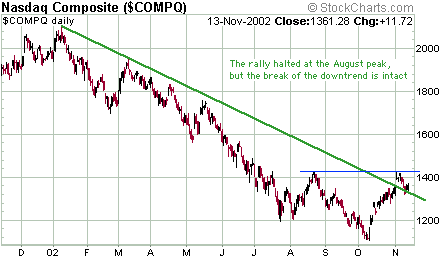
Finally, below is a chart of the NASDAQ
Composite Index. The most bullish argument we can come up with for the
US stock market is the NASDAQ's price action. The NAS recently broke its
medium-term downtrend and moved up to its August peak. It then commenced
what appears to be a normal breakout pullback. The thing is, as mentioned
in the latest Weekly Update the early stages of a new downward trend are
often indistinguishable from a normal pullback within an on-going uptrend.
In order for the market to keep most people 'in the dark' most of the time,
it couldn't be any other way.
Gold and
the Dollar
Gold Stock Valuation Comparison
Below is an updated version of the
table that last appeared in our 7th August commentary. It is a rough
valuation comparison of twelve (previously eight, but we've now added DROOY,
GLG, LHG and MDG) large and mid-sized gold producers, ranked in order of
PE ratio (lowest to highest). The figures have been updated, wherever applicable,
based on the September-quarter reports that have been issued by all the
companies over the past few weeks.
Note that:
a) Estimates of annual production,
revenue and earnings are either based on forecasts provided by the companies
or have been calculated by annualising the results from the September quarterly
reports.
b) The figures for Kinross Gold assume
that the takeovers of TVX, TVX Newmont and Echo Bay have already been completed,
that is, we've assumed that TVX and Echo Bay will make a full year's contribution
to KGC's results. The KGC earnings estimate is therefore very 'rough' since
we have no way of knowing how the combined company will perform or how
long it will take to fully integrate the separate companies into one.
c) We calculate a mining company's
cost to produce an ounce of gold as follows: We subtract reported earnings
from reported revenue to get a total, all-in cost figure. We then divide
this total cost by the number of ounces produced to get a cost per ounce.
This is a much fairer way to do a cost comparison than using the cash costs
or production costs reported by the mining companies.
| Name |
Symbol |
Recent Price (US$) |
Market Cap (US$M) |
Annual Prod (Koz) |
Annual Rev ($M) |
Annual Earnings ($M) |
Cost per oz prod (US$) |
Reserves (M oz) |
Mkt Cap $ per oz reserves |
Price/ Sales |
Price/ Earnings |
| Anglogold |
AU |
28.62 |
6,354 |
6,348 |
1,924 |
404 |
239 |
59 |
108 |
3.3 |
15.7 |
| Harmony Gold |
HGMCY |
15.75 |
2,756 |
3,200 |
1,016 |
160 |
268 |
49 |
56 |
2.7 |
17.2 |
| Gold Fields |
GFI |
11.54 |
5,424 |
4,520 |
1,488 |
284 |
224 |
79 |
69 |
3.6 |
19.1 |
| Lihir Gold |
LHG |
0.69 |
788 |
600 |
200 |
40 |
300 |
15 |
53 |
3.9 |
19.7 |
| Kinross Gold |
KGC |
1.96 |
1,776 |
2,000 |
620 |
80 |
270 |
19 |
93 |
2.9 |
22.2 |
| Durban Deep |
DROOY |
3.59 |
714 |
912 |
268 |
32 |
259 |
16 |
46 |
2.7 |
22.3 |
| Goldcorp |
GG |
11.06 |
2,289 |
652 |
200 |
72 |
196 |
5 |
458 |
11.4 |
31.8 |
| Meridian Gold |
MDG |
17.9 |
1,718 |
416 |
134 |
37 |
233 |
2 |
818 |
12.8 |
46.4 |
| Barrick Gold |
ABX |
15.86 |
8,596 |
5,700 |
1,892 |
184 |
300 |
82 |
105 |
4.5 |
46.7 |
| Newmont |
NEM |
24.28 |
9,712 |
7,500 |
2,912 |
160 |
367 |
97 |
100 |
3.3 |
60.7 |
| Agnico Eagle |
AEM |
12.50 |
1,163 |
320 |
100 |
12 |
275 |
4 |
291 |
11.6 |
96.9 |
| Glamis Gold |
GLG |
8.88 |
995 |
250 |
80 |
10 |
280 |
5 |
195 |
12.4 |
99.5 |
Here are some of our thoughts on the
information presented in the above table:
1. The South African gold stocks (HGMCY,
GFI, AU, DROOY) do, in general, offer much better value than their North
American counterparts. This is, of course, partly due to the greater political
risk associated with South Africa. However, as we've mentioned in the past
this political risk always seems less important to international gold-stock
investors when the gold price is in a strong uptrend than it does at other
times. When the gold price is perceived to be in an uptrend the overriding
motivation changes from wanting a safe play on the gold price to wanting
a highly-leveraged play on the gold price.
2. Taking into account P/E ratio, price-to-sales
ratio, and the price the market is currently putting on reserve ounces
in the ground, Harmony Gold offers the best value out of the 12 stocks
considered in this analysis. Amongst the North American contingent the
'new' Kinross appears to offer the best value, although we are yet to see
how the combined company performs. The lone Australian entrant - Lihir
Gold - is reasonable value and has, by the way, recently increased its
near-term exposure to the spot gold price by postponing delivery into some
forward-sales contracts by 3 years.
3. The market assigns the lowest prices
to the reserves owned by South Africa's Durban Deep (US$46/ounce) and Australia's
Lihir Gold (US$53/ounce). There are reasons for this. For example, both
are marginal producers, Durban has suffered more than its fair share of
problems over the years, and all of Lihir's reserves are located on an
island in Papua New Guinea.
4. Equity investors are obviously enchanted
with both Meridian and Goldcorp. Why else would they pay an extraordinarily-high
$458/ounce for Goldcorp's reserves and an eye-popping $818/ounce for Meridian's
reserves? We are, of course, assuming that the gold these two companies
dig out of the ground is no different to the gold that can be purchased
for less than $325/ounce from your local bullion dealer.
Below is the same comparison, but this
time based on a gold price of $420. The earnings at a gold price of $420
have been calculated by assuming that the cost to produce an ounce of gold
will remain at its current level and that 70% of the increase in revenue
resulting from the higher gold price will drop through to the bottom line.
These assumptions may or may not be valid but for our purposes they are
reasonable because we are trying to assess the relative merits of
these 12 gold stocks, not determine accurate earnings figures. Once again
the companies have been ranked in order of PE ratio. Note that we haven't
accounted for the adverse effects that hedging will have on the earnings
of ABX, AU, NEM and LHG if the gold price rises to $420. We also haven't
accounted for exchange rate changes (e.g., at a gold price of US$420 the
SA Rand would likely be stronger than it is today).
| Name |
Symbol |
Recent Price (US$) |
Market Cap (US$M) |
Annual Prod (Koz) |
Annual Rev ($M) |
Annual Earnings ($M) |
Cost per oz prod (US$) |
Reserves (M oz) |
Mkt Cap $ per oz reserves |
Price/ Sales |
Price/ Earnings |
| Harmony Gold |
HGMCY |
15.75 |
2,756 |
3,200 |
1,351 |
395 |
|
|
|
2.0 |
7.0 |
| Anglogold |
AU |
28.62 |
6,354 |
6,348 |
2,559 |
848 |
|
|
|
2.5 |
7.5 |
| Durban Deep |
DROOY |
3.59 |
714 |
912 |
356 |
94 |
|
|
|
2.0 |
7.6 |
| Gold Fields |
GFI |
11.54 |
5,424 |
4,520 |
1,979 |
628 |
|
|
|
2.7 |
8.6 |
| Lihir Gold |
LHG |
0.69 |
788 |
600 |
293 |
91 |
|
|
|
3.0 |
9.1 |
| Kinross Gold |
KGC |
1.96 |
1,776 |
2,000 |
825 |
223 |
|
|
|
2.9 |
11.6 |
| Newmont |
NEM |
24.28 |
9,712 |
7,500 |
3,873 |
833 |
|
|
|
2.5 |
11.7 |
| Barrick Gold |
ABX |
15.86 |
8,596 |
5,700 |
2,516 |
621 |
|
|
|
3.4 |
13.8 |
| Goldcorp |
GG |
11.06 |
2,289 |
652 |
266 |
118 |
|
|
|
8.4 |
17.6 |
| Meridian Gold |
MDG |
17.9 |
1,718 |
416 |
178 |
68 |
|
|
|
9.6 |
25.3 |
| Agnico Eagle |
AEM |
12.50 |
1,163 |
320 |
133 |
35 |
|
|
|
8.7 |
33.1 |
| Glamis Gold |
GLG |
8.88 |
995 |
250 |
106 |
28 |
|
|
|
9.3 |
34.9 |
Based on the figures in the above table,
the companies that would show the biggest improvement in earnings as a
result of a $100 increase in the gold price are NEM (+420%), ABX (+238%),
DROOY (+193%), and AEM (+193%). However, this is because the current earnings
of these companies are at depressed levels. Of the companies that are currently
very profitable we calculate that the biggest percentage increase in earnings
due to a $100 increase in the spot gold price would be generated by HGMCY
(+147%) and the lowest increase would be generated by GG (+64%).
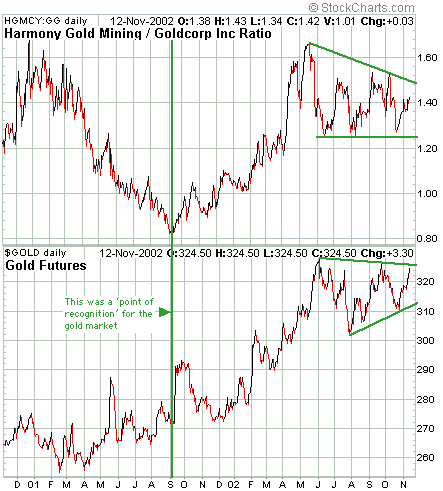
The greater leverage to the gold price
provided by HGMCY relative to GG is illustrated in the below chart. The
chart compares the HGMCY/GG ratio with the gold price. The HGMCY/GG ratio
trended lower until early-September 2001, at which point a trend change
occurred. At around that time more investors began to believe that the
up-move in gold that had begun earlier in the year might be 'real' and
more money started to flow towards the major gold stocks that provided
the most leverage to the gold price. Between September 2001 and May 2002
the HGMCY/GG ratio trended higher with the gold price (HGMCY out-performed
GG as the gold price rose), and when the gold price began to consolidate
in late-May of this year so did the HGMCY/GG ratio. It is highly likely
that an upside breakout in the HGMCY/GG ratio will occur at around the
same time as an upside breakout in the gold price.
Gold Stocks, Interest Rates and
the US$
In recent commentaries we've spent
a lot of time discussing how interest rates influence the prices of gold
stocks. In particular, we've explained that it is the level of long-term
interest rates relative to short-term interest rates (the 'yield
spread'), rather than the absolute level of long-term interest rates,
that is of greatest importance to the prices of gold stocks.
When we talk about the 'yield spread'
we are referring to the yield on the 30-year T-Bond minus the yield on
the 13-week T-Bill. Since 1982 the correlation between the yield spread
and gold stock prices (as represented by the Barrons Gold Mining Index)
is +0.29. This is a significant correlation and, in rough terms, implies
that the yield spread and gold stocks trend in the same direction about
65% of the time. In recent years, however, the relationship has become
even stronger. In fact, since the beginning of 2000 the positive correlation
between the yield spread and the Barrons Gold Mining Index (BGMI) has been
an extremely-high 0.77 (implying that the 2 sets of data have trended in
the same direction about 88% of the time).
We can't be sure that the higher correlation
over the past 3 years means that there is now a permanently-stronger relationship
between the yield spread and the gold sector of the stock market. However,
since the relationship has been so strong during recent years it is certainly
worth paying close attention to the behaviour of the yield spread when
attempting to assess gold sector's risk/reward ratio.
While the correlation between the yield
spread and gold stocks has varied widely over the past 30 years, the inverse
correlation between gold (and hence gold stocks) and the US$ has consistently
been strong since gold and the Dollar were officially de-linked in the
early-1970s. This is the case almost regardless of what period we select.
For example, over the past 30 years the correlation between the SF/US$
exchange rate (the number of US Dollars per Swiss Franc) and the gold price
was 0.79, whereas the correlation between the two over the past 12 months
was 0.74. In other words, the correlation between gold and the Dollar over
the past 12 months has not only been very high, it has been almost perfectly
in line with the long-term average.
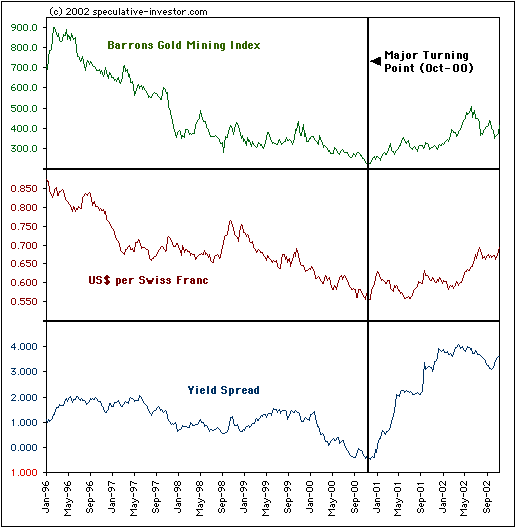
The below chart shows how the Barrons
Gold Mining Index, the SF/US$ exchange rate and the yield spread have moved
in synch with each other since the beginning of 2000.
We are certain that the gold market
is manipulated and we are quite sure that some of the world's major central
banks and governments have a hand in this manipulation. However, it is
clear that the manipulation has not prevented the inter-market relationships
that have worked well for the past 30 years from continuing to work well.
Therefore, although it is certainly possible that the gold price could
move higher for reasons that have nothing to do with the US$, it is highly
improbable.
At this stage the US$ appears to be
headed much lower. This, in turn, is a good reason to be very bullish on
the prospects for gold and gold stocks. When bond prices fall, thus causing
the yield spread to widen, this will create more upward pressure on the
prices of gold and gold stocks.
Current Market Situation
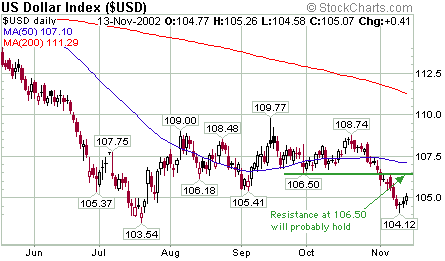
Below is a 6-month chart of the Dollar
Index. The Dollar fell in almost a straight line from its peak of 108.74
on 21st October to its low of 104.12 on 11th November. The rebound over
the first half of this week is therefore not surprising. At this stage
the bounce over the past few days looks like a rebound within a continuing
short-term downtrend. This rebound will probably fail at, or below, 106.50.
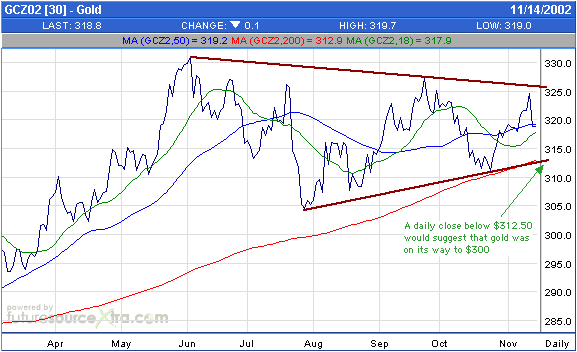
Wednesday's sharp drop in the gold
price wasn't significant, and neither was the previous day's bounce. As
the below chart shows, December gold continues to trace out a consolidation
pattern that began in May. Tuesday's rally fell short of the upper trend-line
while Wednesday's plunge simply brought the price back to the middle of
its consolidation range. If trend-line support at around $312.50 is broken
then the target of $300 that we first mentioned in early-October would
come back into play. However, with the US$ likely to resume its decline
within the next few days we doubt that a downside breakout in the gold
price (a drop below 312.50) is on the cards in the short-term.
Wednesday's gold market action highlights
the risks posed by small traders being heavily net-long gold futures. The
news that Iraq was going to comply with UN demands regarding weapons' inspections
was taken as meaning that a war now has a lower probability of occurring.
Whether this is correct or not the Iraq situation has almost no relevance
to the gold price, but the news did provide an opportunity to shake the
'weak hands' (the small traders) out of some of their long positions in
the futures market.
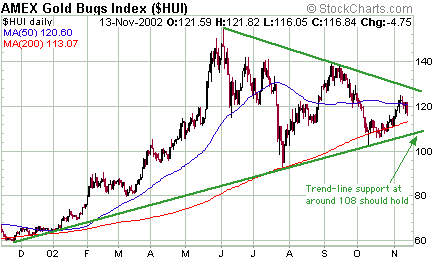
Below is a 12-month chart of the Amex
Gold BUGS Index (HUI). The September-October plunge in the HUI resulted
in a short-lived move below the 200-DMA which, as we mentioned at the time,
will probably turn out to have been a good buying opportunity. However,
although the HUI briefly moved below its 200-DMA it held above the uptrend-line
dating back to the November-2001 low. This trend-line, which would currently
be hit on a drop to around 108, should continue to hold during pullbacks.
As has been the case over the past
2 weeks, the gold and currency markets are at critical junctures. If not
for the weakness in the US$ we would be confident that gold was about to
work its way down to around $300 over the next several weeks. A drop of
this magnitude would probably be needed to eliminate much of the large
net-long position in COMEX gold futures accumulated by small traders and
thus to set the stage for a major advance. The reality of the situation
is, though, that the US$ is weak and there is a distinct possibility
that the Dollar's current rebound will be followed by a drop to new lows
for the year.
In our view, the approach with the
best risk/reward balance is to 'buy the dips' in the gold stocks. We bought
in mid-October when the HUI dropped below its 200-DMA and tested its uptrend-line
and we would be buyers again if presented with another test of the uptrend.
Schedule
Change
Due to family commitments the next
Weekly Market Update will be up to 24 hours late. It will, however, be
posted well before the US markets open next Monday.
Chart Sources
Charts used in today's commentary were
taken from the following web sites:
http://www.futuresource.com/
http://stockcharts.com/index.html

|

