![]()
![]()
![]()
![]()
- Interim Update 13th December 2017
Copyright
Reminder
The commentaries that appear at TSI
may not be distributed, in full or in part, without our written permission.
In particular, please note that the posting of extracts from TSI commentaries
at other web sites or providing links to TSI commentaries at other web
sites (for example, at discussion boards) without our written permission
is prohibited.
We reserve the right to immediately
terminate the subscription of any TSI subscriber who distributes the TSI
commentaries without our written permission.
Bitcoin, again
In the 4th December Weekly
Update we wrote that Bitcoin couldn't be reliably used as a medium of
exchange, a store of purchasing power or a means of transferring
purchasing power. The time to validate a transaction is an issue, as is
the cost of transacting (fees charged by the Bitcoin network plus the cost
of converting to/from more useful media of exchange). However, the main
issue is that its purchasing power is far too unstable.
We
regularly transfer money between banks in different countries and the
aggravation from dealing with the compliance departments of these
financial corporations has probably taken a year off your editor's life.
Consequently, we would love to be able to use Bitcoin for a
non-speculative end. However, the volatility prevents us from doing so.
The only reason we would store a significant amount of purchasing power in
Bitcoin form is if we were confident that its purchasing power was going
to increase. That is, like almost everyone else we would only hold it as a
speculation/gamble.
We are well aware that some people do transfer
purchasing power and make payments via Bitcoin, but only a small fraction
of the Bitcoin supply is used in this way. It currently cannot be
generally or even widely used as a means of payment.
As announced
HERE, the volatility has reached the point where
Steam, one of the most
natural users of Bitcoin in the world of on-line merchants, is refusing to
accept it. The announcement linked above also mentions rapidly-rising
transaction fees as part of the reason for the decision to stop supporting
Bitcoin.
It could be argued that when Bitcoin becomes more widely
accepted as a medium of exchange its purchasing power will stabilise, but
this is a circular argument. It won't be more widely used as a medium of
exchange until it becomes less volatile, but it won't become less volatile
until it stops being primarily a speculative plaything and starts being
more widely used as a medium of exchange.
A related point is that
the extreme and still-increasing volatility is the main reason for the
rising popularity. The greater its price run-ups and oscillations the
greater its popularity as a speculation, and the greater its popularity as
a speculation the greater its price volatility. This is a spiral that can
only end one way. It can only end the way that every previous speculative
mania in history ended.
Looking from a different angle, consider
what would happen if, against all odds, the Bitcoin price suddenly became
so stable that its purchasing power changed by less than 3% from one year
to the next. In this case Bitcoin's popularity wouldn't increase, it would
plummet. The allure is the speculative potential. Take away that
speculative potential and Bitcoin would, at best, become an irredeemable
currency serving a niche market.
A final point is that the legal
restrictions imposed by governments on Bitcoin trading have been tentative
to date, but that's mainly because central banks and governments perceive
it to be a speculation along the lines of a dot.com stock in 1999 (which,
by the way, is not far from the truth). However, if Bitcoin evolved to
achieve widespread utility as a medium of exchange then the world of
officialdom would feel threatened and would take action to severely
curtail its use.
Don't let Bitcoin's spectacular price rise fool
you. The internet was a revolutionary technology in 1998-2000, but this
didn't mean that the spectacular rises in the prices of internet stocks
during that period were based on realistic appraisals of the future.
The Stock Market
The trade that is sure
to NOT work in 2018
The most consistently profitable trade
since the stock-market bottom of February-2016 wasn't owning Bitcoin or
one of the other 'cryptoassets'. The 'cryptos' achieved the largest and
fastest price gains, but they experienced a few 30%+ crashes along the
way. The most consistently profitable trade also wasn't being long the
"FANGs". Taking into account the consistency of the trend, the most
profitable trade over the past 21 months was being short volatility.
Here's a long-term chart of the Volatility Index (VIX). This chart
shows that the VIX trended downward over the past 2 years and in 2017 did
something it had never done before: spend a lot of time under 10. This is
part of the reason that shorting volatility paid great dividends since
early-2016, but it is far from being the complete reason.
The steep upward slope of the VIX futures curve is the other part of
the reason. Over the past 18 months and especially during 2017, the price
of a VIX futures contract that expired in a few months was almost always
much higher than the price of the nearest futures contract. For example,
at the close of trading on Wednesday 13th December the December-2017 VIX
futures contract was priced at 10.0 and the May-2018 VIX futures contract
was priced at 15.17 (prices can be obtained
HERE). This means that someone who buys the May-2018 VIX futures and
holds to expiry will require a VIX increase of more than 50% just to break
even, whereas someone who short sells the May-2018 VIX futures will make a
profit if the VIX does anything other than rise by more than 50%.
Due to the steep upward slope of the futures curve, the ETFs and ETNs that
go long volatility by owning VIX futures have been leaking significant
value every time they rolled from an expiring contract to a later-dated
contract. The result is illustrated by the following chart of VXX, the
most popular product for going long the VIX. The price of this ETN has
trended downward in almost a straight line from a split-adjusted level of
about $480 in February-2016 to its current level of about $30.
Now,
the longer a trend stays in motion the greater will be the general
interest in 'jumping on board'. Notice the large rise in VXX trading
volume over the past 8 months. This is mostly due to increasing eagerness
on the part of the trading public to profit from VXX's seemingly
never-ending decline.
The belief in the short-volatility trade is now so strong that this
trade is almost guaranteed NOT to work in 2018. By the same token, trades
that are predicated on increased volatility should do much better in 2018
than they did in 2017.
Getting close to a put/call sell
signal
The S&P100 Index (OEX) put/call ratio indicates the
sentiment (fearful, complacent or somewhere in between, with increasing
concern about downside risk corresponding to a rising put/call ratio) of
the relatively smart money whereas the equity put/call ratio indicates the
sentiment of the relatively dumb money. By dividing the OEX put/call ratio
into the equity put/call ratio we therefore get an indication of smart
money sentiment relative to dumb money sentiment. The lower the result of
this division, the greater the fear of the smart money relative to the
fear of the dumb money and the greater the short-term downside risk in the
market (since the "smart" and "dumb" labels exist for a reason).
The bottom section of the following chart shows the 10-day MA of the
equity put/call ratio divided by the 10-day MA of the OEX put/call ratio.
This is our favourite short-term sentiment indicator, although we don't
often mention it because it doesn't generate a lot of signals. We are
mentioning it today because it is close to generating a sell signal.
The way we interpret this indicator, a rise to 0.75 or higher is a buy
signal and a decline to 0.30 or lower is a sell signal. There is presently
no signal, but IF there is a small additional rise in the OEX put/call
relative to the equity put/call over the days ahead then we will get a
sell signal.
The last sell signal occurred near the end of
October-2016. This one proved to be false, but it was the only false
signal of the past three years. This year there have been only two signals
to date, both of them buys. Specifically, there was a buy signal in
January and a buy signal in April. We should have paid more attention to
these signals, because they were prescient.
The price action
Daily charts of the S&P500
Index (SPX) and the NASDAQ100 Index (NDX) are displayed below.
The
new highs achieved by the SPX and the Dow Industrials Index during
December have not yet been confirmed by the NDX, but the odds favour an
extension of the US stock market's rally, with intervening minor
pullbacks, to a high near the turn of the year or during the first half of
January.
The most significant divergence from the rally theme is the price
deterioration over the past few months in the junk bond market. This price
deterioration is illustrated on the following daily chart by the
performance of the iShares High Yield Bond ETF (HYG).
Since peaking
in July, HYG has made a sequence of lower highs. The decline to date does
not look significant on its own, but it is at odds with the continuing
stock market rally (the junk bond market typically strengthens and weakens
with the stock market).
The significance of HYG's decline would
increase substantially if support at $86 were breached.
Our expectation is that the equity bull market will extend through the
first half of 2018, which is as far ahead as we are looking. However, we
perceive a high risk that a sizable correction lasting anywhere from a few
weeks to three months will begin by mid-January.
Gold and the Dollar
Gold
The
Fed did what 'everyone' was expecting on Wednesday 13th December. It went
ahead with the 0.25% rate hike that was fully discounted by the market
some time ago, and as far as we can tell there were no surprises in the
wording of the FOMC statement or in Janet Yellen's press conference.
This week's Fed news has set off an attempt to rally the gold market.
This was predictable, because after something has happened two years in a
row in the financial markets (gold began to rally within 24 hours of Fed
rate-hike announcements in December-2015 and December-2016) many traders
will assume another recurrence and act accordingly.
At the time of the Fed's rate-hike announcement in December of 2015
and 2016 the stage was set for a multi-month gold rally by virtue of the
market being very 'oversold' and sentiment being depressed (more so in
December-2015 than in December-2016). This time around we don't know if
sentiment is sufficiently depressed to set in motion a tradable rally. A
critical clue as to whether it is or not will be provided by the COT
report that gets issued at the end of this week.
The preceding COT
report revealed that speculative positioning had begun to move quickly in
the right direction (it showed that speculators were finally rushing for
the exit after stubbornly clinging to their bullish positions for 2.5
months), but that a further speculative shake-out likely would be required
prior to a sustainable price low. A further speculative shake-out of
sufficient magnitude may or may not have happened by the end of trading on
Tuesday 12th December. We'll find out on Friday.
As things stand at
the moment there remains a high risk of a trend-ending plunge to the
low-$1200s during the second half of this month or in January.
Gold Stocks
In the latest Weekly Update, we wrote:
"...based on two considerations it is certainly possible that the
decline from the early-September high ended on Thursday 7th December. The
first is that as measured by the daily RSI...the HUI was more 'oversold'
at last week's bottom than at any time over the preceding 12 months
(including at the December-2016 low). The second is that last week's low
for the HUI was close to the bottom of the channel we drew on the chart
included in the 6th December Interim Update."
The HUI tested
its 7th December low during the first two days of this week and then
rebounded strongly on 'Fed day'. This constitutes more evidence that the
downward trend is over, but the evidence is still far from conclusive.
The HUI's first resistance of note lies at 185. Achieving a daily
close above this resistance would boost the probability that a multi-month
price low is in place, but if the trend has reversed from down to up then
the earliest clear-cut evidence of it should come from the HUI/gold ratio.
As was the case in January-2016 and December-2016, there should be a surge
in the HUI/gold ratio during the 1-2 week period immediately after an
intermediate-term price bottom.
On a related matter, with reference
to the following chart of the HUI/gold ratio notice the performance
differences between the 1-2 week periods after the January-2016,
December-2016 and July-2017 lows. The lacklustre performance of the
HUI/gold ratio in the immediate aftermath of the HUI's early-July low was
a clear sign that we were dealing with a counter-trend rebound and not a
substantial rally.
At their lowest levels of the past week the HUI and GDX were about 10%
and 15% above their respective December-2016 lows. Even GDXJ managed to
stay comfortably above its December-2016 low. However, the stocks of
Barrick Gold (ABX) and Goldcorp (GG), two of the world's three largest
gold producers, recently traded at their lowest levels in more than 18
months, as did many junior gold-mining stocks. The point is that even
though the gold-mining indices and ETFs weakened relentlessly over the
past three months they still held up better than many individual gold
stocks.
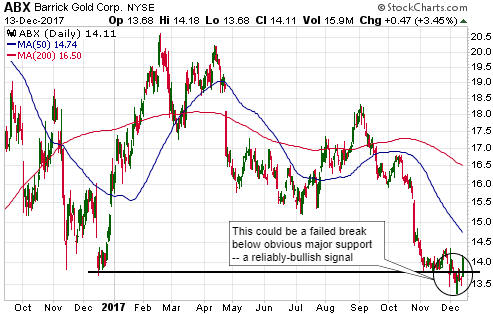
Speaking of Barrick Gold (ABX), over the past week ABX
generated a reliably bullish signal in the form of a failed break below an
obvious and important lateral support level. It would be reasonable to buy
ABX for a trade, setting an initial daily-closing stop at around $13.50.
Lastly, be aware that a) quarterly ETF and index rebalancing takes
place at the end of this week and could result in high-volume price
changes in some junior mining stocks on Friday, and b) large price moves
that occur in response to quarterly rebalancings are often retraced during
the following week.
The Currency Market
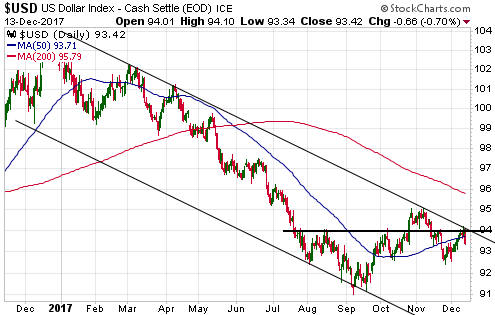
Based on current fundamentals and sentiment, the Dollar Index (DX) should
trade above its November-2017 high before making a sustained break below
its September-2017 low. However, the DX's 'Fed day' reversal was bearish
because it happened immediately after a test of resistance near 94. As
illustrated by the following chart, there is both lateral and channel
resistance near 94.
The price action points to a test of the
September-2017 low within the next 2-3 weeks.
A daily close above 94.1 would remove the conflict between price
action on the one hand and sentiment and fundamentals on the other hand.
If that doesn't happen soon then reconciliation between the different
influences could involve the DX's overall rebound extending well into the
first quarter of 2018, with a test of the September-2017 low along the
way.
Updates on Stock Selections
Notes: 1) To review the complete list of current TSI stock selections, logon at
http://www.speculative-investor.com/new/market_logon.asp
and then click on "Stock Selections" in the menu. When at the Stock
Selections page, click on a stock's symbol to bring-up an archive of
our comments on the stock in question. 2) The Small Stock Watch List is
located at http://www.speculative-investor.com/new/smallstockwatch.html
Chart Sources
Charts appearing in today's commentary
are courtesy of:
http://stockcharts.com/index.html
![]()