|
- Interim Update
14th May 2014
Copyright
Reminder
The commentaries that appear at TSI
may not be distributed, in full or in part, without our written permission.
In particular, please note that the posting of extracts from TSI commentaries
at other web sites or providing links to TSI commentaries at other web
sites (for example, at discussion boards) without our written permission
is prohibited.
We reserve the right to immediately
terminate the subscription of any TSI subscriber who distributes the TSI
commentaries without our written permission.
Money
Velocity, Supply and Demand
"Money Velocity" is NOT a useful concept in economics or
financial-market speculation. The reasons have been discussed
numerous times in TSI commentaries over the years, but in response
to some emails received over the past few weeks it is time for a
brief recap.
As is the case with the price of anything, the price of money is
determined by supply and demand. Supply and demand are always equal,
with the price adjusting to maintain the balance. A greater supply
will often lead to a lower price, but it doesn't have to. Whether it
does or not depends on demand. For example, if supply is rising and
demand is attempting to rise even faster, then in order to maintain
the supply-demand balance the price will rise despite the increase
in supply.
When it comes to price, the main difference between money and
everything else is that money doesn't have a single price. Due to
the fact that money is on one side of almost every economic
transaction, there will be many (perhaps millions of) prices for
money at any given time. In one transaction the price of a unit of
money could be one potato, whereas in another transaction happening
at the same time the price of a unit of money could be 1/30,000th of
a car. This, by the way, is why all attempts to come up with a
single number -- such as a CPI or PPI -- to represent the price of
money are misguided at best.
To summarise, in the real world there is money supply and there is
money demand; there is no money "velocity". Why, then, do so many
economists and commentators on the economy harp on about the
"velocity of money"?
The answer is that the velocity of money is part of the very popular
equation of exchange, which can be expressed as M*V = P*Q where M is
the money supply, V is the velocity of money, Q is the total
quantity of transactions in the economy and P is the average price
per transaction. The equation is a tautology, in that it says
nothing other than the total monetary value of all transactions in
the economy equals the total monetary value of all transactions in
the economy. In this ultra-simplistic tautological equation, V is
whatever it needs to be to make the left hand side equal to the
right hand side.
Another way to express the equation of exchange is M*V = nominal
GDP, or V = GDP/M. Whenever you see a chart of V, all you are seeing
is a chart of nominal GDP divided by money supply. That's why a
large increase in the money supply will usually go hand-in-hand with
a large decline in V.
In conclusion, V (money velocity) does not exist outside of a
mathematical equation that, due to its simplistic and tautological
nature, cannot explain real-world phenomena.
The Stock Market
Russia
Due to the goings-on in the Ukraine and the associated
biased media coverage, a good opportunity for speculators to accumulate long
exposure to the Russian stock market is now presenting itself. This opportunity
would have occurred anyway as a result of the Russian stock market's tendency to
act like a leveraged play on the emerging-market and commodity themes, but the
game being played on the international stage regarding political control of
Ukraine is making the opportunity even better than it would otherwise have been.
The reason for our interest in obtaining some 'long' exposure to the Russian
stock market -- via the Market Vectors Russia ETF (RSX) -- is illustrated by the
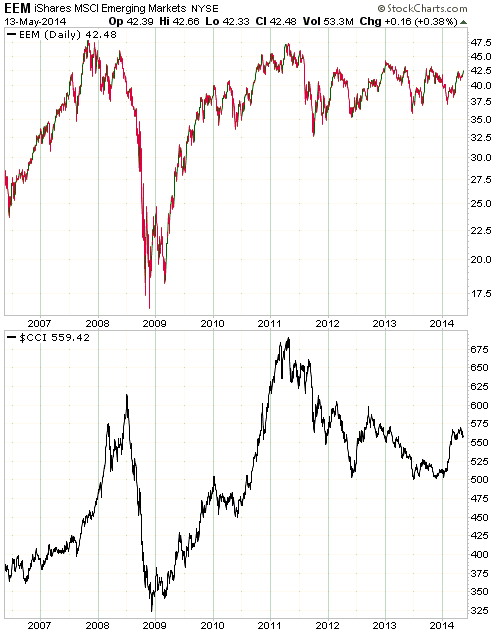
following charts, the first of which shows that EEM, the iShares Emerging
Markets Fund, has trended in the same direction as the Continuous Commodity
Index (CCI) for many years. The relationship depicted on this chart suggests
that EEM should perform well over the next couple of years if we are right to
believe that commodities, as a group, are in the process of turning higher on a
long-term basis. We are well aware that the economic fundamentals do not suggest
that the recent relative strength in emerging-market equities will be sustained
beyond the very short-term, but if the upward trend in commodity prices is set
to continue then additional relative strength in emerging-market equities is a
high-probability bet.
While the first chart makes the case that emerging-market equities (represented
by EEM) tend to do well during cyclical commodity bull markets and poorly during
cyclical commodity bear markets, the second chart makes the case that Russian
equities tend to do the same, only more so. In other words, the second chart
shows that the Russian stock market tends to rise by more than emerging-market
equities in general during cyclical commodity bull markets and fall by more than
emerging-market equities in general during cyclical commodity bear markets.
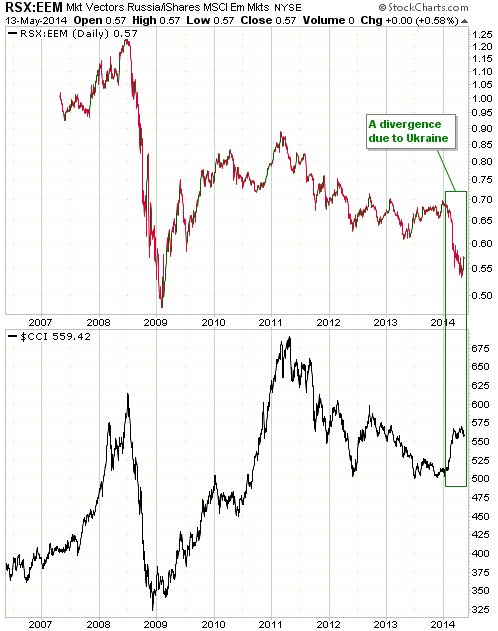
An implication of the above charts is that in the absence of Ukraine-related
violence, political manipulation and biased media coverage, the commodity rally
that began in January would probably have caused RSX to be strong relative to
EEM over the past few months. Instead, the commodity rally went with a plunge in
the RSX/EEM ratio as speculators and investors became distracted by the news of
the day. This, we think, has enhanced the buying opportunity.
Due to the risk of substantial weakness in the US stock market and the potential
for most other markets to be adversely affected, a position in RSX (or something
similar) should be gradually averaged into. We suggest taking an initial
position now and adding to the position on weakness over the next six months.
The US
The S&P500 and Dow Jones Industrials indices made new all-time highs during the
first half of this week in parallel with more bearish divergences than we can
poke a stick at. There's a high probability that a top of at least
intermediate-term importance is being formed.
Gold and the Dollar
Gold
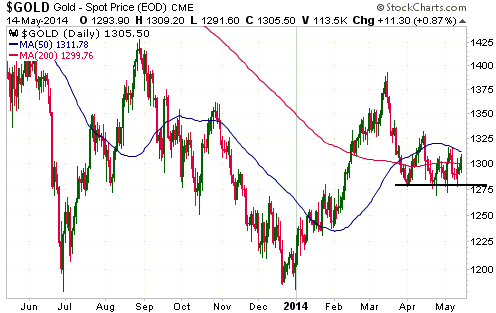
Gold re-tested support at $1280 at the beginning of this week and then rebounded
to just below the resistance defined by its 50-day MA. This resistance is now at
$1312.
This price action doesn't tell us much, although the fact that gold managed to
hold above $1280 despite the S&P500 Index making a new high reduces the risk
that the $1280 support level will be breached. In any case and as noted in the
latest Weekly Update, we expect that the gold price will work its way up to
around $1400 over the coming 6 weeks regardless of whether or not it first
breaks below $1280.
The fundamental backdrop is becoming increasingly gold-bullish, sentiment is
constructive (hardly anyone expects a meaningful gold rally to begin in the near
future), and the historical record following cyclical bear markets points to
strength over the next couple of months. Also worth noting is that over the past
14 years, 2013 was the only year in which gold trended lower into May and
experienced significant additional downside over the ensuing 1-2 months. In the
three other years in which the gold market trended lower into May (2004, 2005
and 2012), a multi-month rally commenced in May.
Silver
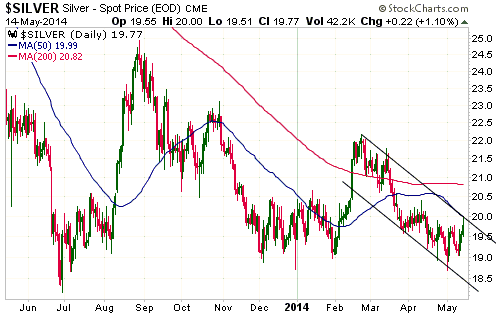
Silver has resistance at $20.00 defined by its 50-day MA and the top of the
short-term channel drawn on the following daily chart. This resistance was
tested on Wednesday 14th May.
Due to being 'oversold' in dollar terms and relative to gold, silver has the
potential to spring upward in the near future. A daily close above $20.00 would
signal that an upward 'spring' had begun.
Gold Stocks
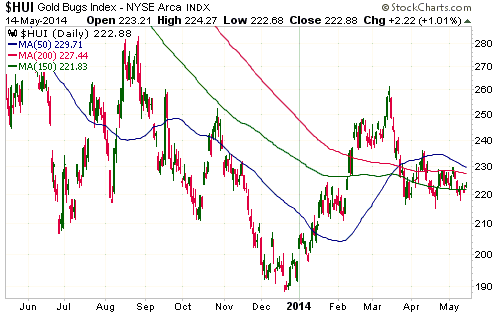
The first three days of this week were uneventful for the gold-stock indices.
The HUI managed to hold above support at 219 and move marginally above its
150-day MA, but the market was very quiet and essentially directionless. This is
the proverbial "calm before the storm", as the narrowing price range of the past
7 weeks should soon give way to increased volatility.
We expect that the next move of consequence will be to the upside and that it
will soon get underway, but we are prepared for the possibility of a quick
decline by the HUI to the 205-210 range prior to the start of a strong rally.
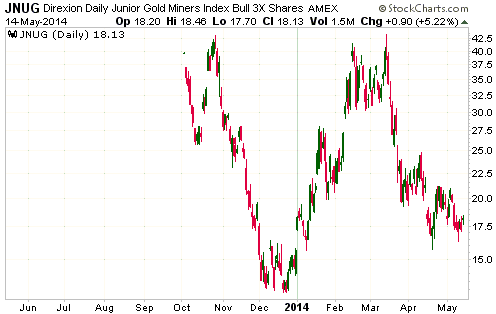
There is now an interesting set-up for a trade in JNUG, a fund that is designed
to have daily percentage moves that are three times the daily percentage moves
of the Market Vectors Junior Gold Miners Index (GDXJ). For example, a 5% daily
move by GDXJ will result in a 15% daily move in the same direction by JNUG.
The following chart shows the large swings in JNUG during its young life (it was
introduced last October). If the gold-mining sector is about to turn higher,
then a large percentage advance in JNUG is on the cards.
Adventurous speculators should consider buying JNUG near its current price and
managing risk by either placing a stop just below the May intra-day low ($16.33)
or planning to quickly exit the position if the HUI closes below 219.
The Currency Market
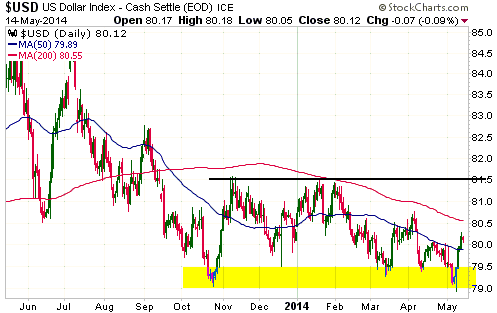
Last week's downside breakout in the Dollar Index turned out to be a 'fakeout'.
It has since rebounded enough to breach minor resistance at 80, but the more
important resistance defined by its 200-day MA lies just above this week's high
at 80.5 and the most important nearby resistance lies a point higher at 81.5.
Resistance at 80.5 could be tested and briefly exceeded in the near future, but
we do not expect that resistance at 81.5 will be seriously challenged this year.
The incipient strength in most things commodity-related suggests that the next
move of consequence in the Dollar Index will be to the downside.
Updates
on Stock Selections
Notes: 1) To review the complete list of current TSI stock selections, logon at
http://www.speculative-investor.com/new/market_logon.asp
and then click on "Stock Selections" in the menu. When at the Stock
Selections page, click on a stock's symbol to bring-up an archive of
our comments on the stock in question. 2) The Small Stock Watch List is
located at http://www.speculative-investor.com/new/smallstockwatch.html
Chart Sources
Charts appearing in today's commentary
are courtesy of:
http://stockcharts.com/index.html

|

