![]()
![]()
![]()
![]()
- Interim Update 14th June 2017
Copyright
Reminder
The commentaries that appear at TSI
may not be distributed, in full or in part, without our written permission.
In particular, please note that the posting of extracts from TSI commentaries
at other web sites or providing links to TSI commentaries at other web
sites (for example, at discussion boards) without our written permission
is prohibited.
We reserve the right to immediately
terminate the subscription of any TSI subscriber who distributes the TSI
commentaries without our written permission.
The FOMC announcement
had minimal effect
These days the Fed is so
concerned about not doing anything to upset the financial markets that the
outcomes of FOMC meetings tend to be very predictable. This week's meeting
was not an exception. The Fed's 14th June post-meeting announcement was in
line with almost everyone's expectations and therefore had minimal effect
on market prices.
At this week's meeting the Fed implemented
another 0.25% rate hike and mentioned its plan to gradually reduce the
size of its balance sheet by not reinvesting all the proceeds received
from maturing securities. The Fed expects the balance-sheet reduction
program to begin late this year at an initial pace of US$10B/month.
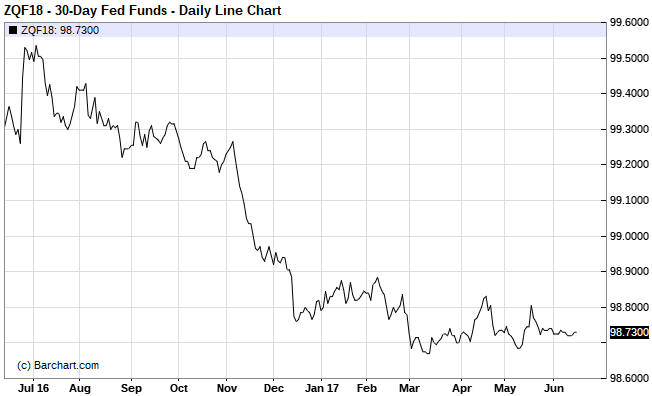
The extent to which these developments were already 'baked into the
cake' is evidenced by the following daily chart of the January-2018 Fed
Funds Futures (FFF) contract. This contract indicates the level of the Fed
Funds Rate (FFR) expected by the market near the end of this year, with
the implied interest rate being 100 minus the FFF contract price.
The chart shows that the expected FFR barely moved on Wednesday 14th June.
In fact, it has barely moved for the past three weeks. The chart also
shows that the January-2018 FFF contract has a slightly higher price now
than it did 3.5 months ago. This means that interest-rate expectations
actually edged downward during a 3.5-month period in which the Fed
implemented two rate hikes.
Before leaving this topic it's worth noting that the market's
expectations regarding the Fed's actions will have to change over the next
several months, because the current price of the January-2018 FFF contract
implies a roughly 50% chance of one more rate hike before year-end. Either
there will be a rate hike later this year or there won't be a rate hike
later this year, so at some point the market will have to move one way or
the other.
Whether or not there is one more rate hike this year
will largely be determined by the performance of the stock market. If the
stock market is strong or stable during the second half of this year then
there will definitely be another rate hike, but if the stock market
appears to be trending downward then there won't be. Furthermore, if the
stock market crashes then there not only won't be a rate hike, there will
be a rate cut.
A Fed rate hike doesn't
tighten monetary policy, but it does help the banks
As we've explained many times in
the past, a hike in the FFR no longer does anything to tighten monetary
conditions (a genuine tightening of monetary policy won't begin until the
Fed starts to shrink its balance sheet). This is because in a banking
system inundated with excess reserves there will be almost no borrowing of
Federal Funds. However, a hike in the FFR does help the commercial banks.
One reason is that the Fed now implements its rate hikes by raising
the amount of interest it pays on bank reserves. A Fed rate hike therefore
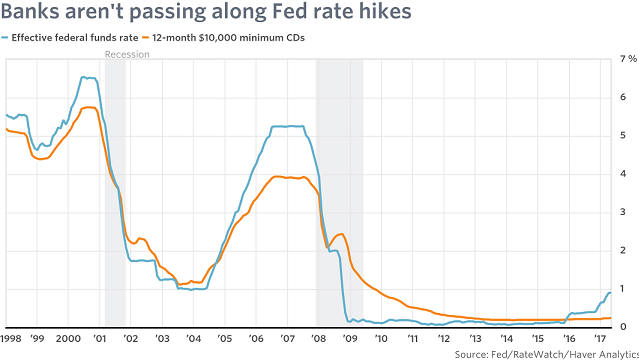
now involves the Fed pumping more money into the banks. Another reason is
illustrated by the following chart, which is from a
Steve Goldstein article at Marketwatch.com and doesn't include
Wednesday's 0.25% boost in the FFR.
The chart shows that banks have
generally not lifted the rate of interest they pay to depositors as the
Fed has lifted the FFR. In some cases the banks have, however, used the
Fed rate hikes to justify lifting the amount they charge on loans, meaning
that the Fed rate hikes have led to higher interest margins for the banks.
The Stock Market
The US
Trying to solve the sentiment conundrum
In a
blog post early this week we reiterated the potential pitfalls in
using sentiment as a market timing tool and presented a chart showing the
Investors Intelligence (II) bull/bear ratio as an example. The chart
suggests that US stock market sentiment has been consistent with a
bull-market top for the bulk of the past four years, and yet the bull
market has persisted with only one intermediate-term correction. Even
though the chart helps to make our point, further analysis is warranted
because it is very unusual for sentiment -- when used as a contrary
indicator -- to be so wrong for so long.
We've come up with a
possible -- and, we think, plausible -- explanation for why measures of US
stock-market sentiment that worked well as contrary indicators in the past
have not been useful of late. The reason relates to the third of the
potential pitfalls outlined in the above-linked blog post. We are
referring to the following:
"...regardless of what sentiment
surveys say, there will always be a lot of bears and a lot of bulls in any
financial market. It must be this way otherwise there would be no trading
and the market would cease to function. As a consequence, if a survey
shows that almost all traders are bullish or that almost all traders are
bearish then the survey must be dealing with only a small -- and possibly
not representative -- segment of the overall market."
The
explanation we've come up with is that prior to the past few years the II
sentiment survey, which is a survey of investment advisors who regularly
publish their views via newsletters, reflected the sentiment of the
investing public, but this is not so much the case anymore. Prior to the
past few years the advisors and the general public would become
increasingly bullish or increasingly bearish together, with high levels of
optimism invariably following persistent price strength and high levels of
pessimism invariably following either persistent or dramatic price
weakness. Over the past few years, however, the perceptions of these two
groups took separate paths. Investment advisors became very optimistic in
reaction to the strong upward trend in prices, but for the most part the
general public remained unenthusiastic about the stock market.
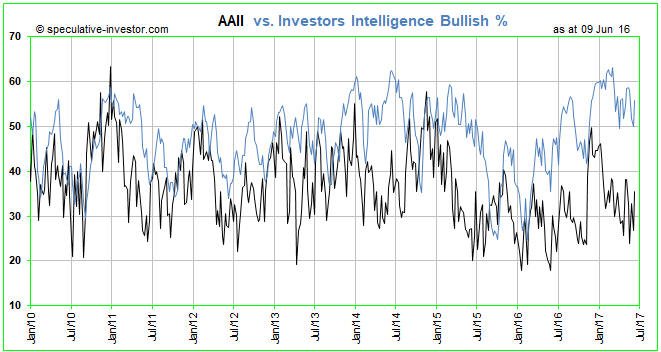
We
can illustrate the change described above by comparing the II bullish
percentage with the AAII (American Association of Individual Investors)
bullish percentage, which is what we've done on the chart displayed below.
The AAII survey is based on the opinions of retail investors, that is, the
general public.
The chart shows that prior to 2014 the II (the blue
line) and AAII (the black line) bullish percentages typically moved up and
down together within a similar range, but that from 2014 onwards the II
bullish percentage tended to be significantly higher. Furthermore, the
distance between the two survey results has increased since early this
year, with the II bullish percentage remaining above 50 and the AAII
bullish percentage spending most of its time in the 25-35 range. The most
recent results show an II bullish percent of 55.8 and an AAII bullish
percent of 35.4.
It seems that the general public's stock-market sentiment has not
reached an optimistic extreme during the current cycle. Does this mean
that there's a lot more price strength to come or does it mean that the
next major price top will happen without the general public having fully
embraced the upward trend?
We don't know, but it's definitely
possible that the public will never fully embrace the latest bullish trend
for the simple reason that it is financially incapable of doing so. Having
had its savings decimated when earlier Fed-fueled investment booms
inevitably collapsed it may not have the financial wherewithal to
enthusiastically participate in the Fed's latest venture.
Current Market Situation
There
isn't a lot happening, but what is happening is interesting and
potentially significant. In particular:
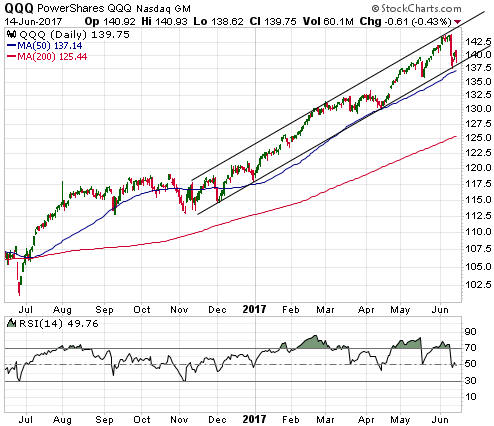
1) QQQ (the NASDAQ100 ETF),
the focal point of speculation during this year to date, has trended
upward within a well-defined channel since early-November of last year.
Last week it quickly moved from the top to the bottom of this channel, but
up until now the channel bottom has held.
If the channel bottom is
breached on a daily closing basis it will be a warning that something more
serious than a routine short-term correction is underway. We expect that
the channel bottom will soon be breached.
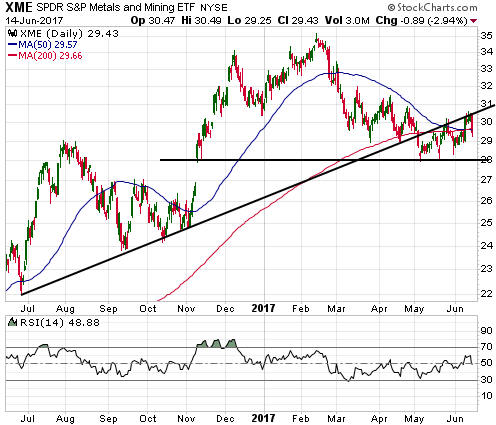
2) XME (the Metals and Mining ETF) broke out to the downside in
early-May and then almost immediately began to slowly work its way upward.
At this stage the upward drift of the past few weeks looks corrective (a
counter-trend move within a downward trend) and Wednesday's nearly-3%
decline has possibly signaled the resumption of the downward trend.
Support at $28.00 seems to be important. If this support is breached
we suspect that a quick decline to around $25 will follow, at which point
the post-election surge will have been fully retraced.
The Emerging Markets ETF (EEM)
EEM continues
to show remarkable resilience. We think that this resilience is mostly due
to US$ weakness and that EEM will begin to trend downward when the US$
begins to rally.
EEM will probably drop to support at $38 and could
fall as far as support at $34 within the next two months.
Gold and the Dollar
Gold
In
the latest Weekly Update we wrote that until there was a daily close below
$1260 there would remain a chance of gold making a short-lived move above
$1300. Gold still hasn't closed below $1260, but there is now a high
probability that it double-topped near $1300 last week.
We think
that gold's short-term risk/reward is bearish, but we don't have any
specific short-term price targets in mind at this time.
Gold Stocks
In the latest Weekly Update, we
wrote:
"Unless GDX closes above $23.86 it will be prudent to
assume that the rebound from the early-May low ended on Tuesday 6th June
and that a significant decline has begun. For those with the requisite
experience and inclination it could also be prudent to view strength in
the early part of this week as an opportunity to hedge long positions in
gold-mining stocks. The hedges (for example, GDX put options) could then
be exited at a loss if GDX subsequently closes above $23.86 or at a profit
if GDX suffers a quick and sizable decline."
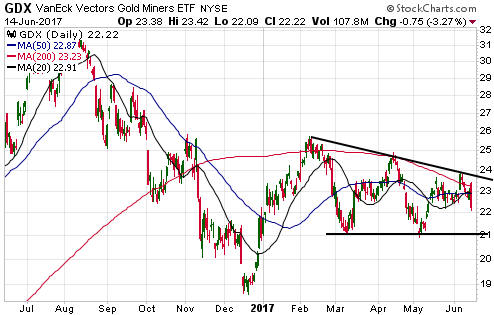
The following
charts show that GDX and the HUI fell sharply on Wednesday 14th June. The
Fed's announcement was the catalyst, but Wednesday's price action was
really just the continuation of a pattern that began months ago.
The March-May double bottom ($21 for GDX, 180 for the HUI) may soon be
tested.
The declines in the gold-mining indices and ETFs are probably not yet
close to complete, but junior gold-mining stocks that get hit hard by the
infamous GDXJ rebalance could bottom as soon as this Friday.
During
the first two trading days of this week there were no signs of the
substantial buying and selling that will have to be done by GDXJ to bring
itself into line with the index it is supposed to track, in that trading
volumes in the affected stocks were no higher than average and price
movements were generally not significant. However, the GDXJ effect started
to become apparent on Wednesday 14th June, with some gold-mining stocks
taking relatively big price hits on relatively high volumes.
The
GDXJ effect will probably increase over the final two trading days of this
week, although it's worth noting that when it comes to matching the ETF
with its underlying index the managers of the ETF have considerable
leeway. Rather than bringing the ETF into line with the associated index's
new component weightings by the close of trading this Friday, which is
when the new weightings take effect, they could, for example, decide to
gradually implement the required changes over the next several weeks.
If the required weighting changes are implemented prior to the end of
this week then we may soon be presented with good short-term buying
opportunities in individual gold stocks as outlined in the latest Weekly
Update.
The Currency Market
On a daily
closing basis the Dollar Index (DX) went nowhere during the 14th June
trading session, but the intra-day price action was significant. We are
referring to the fact that the DX spiked to a marginal new low for the
year and then recovered to be roughly unchanged on the day.
It must
now achieve a daily close above 97.5 to signal that a
potentially-important reversal has taken place.
Updates on Stock Selections
Notes: 1) To review the complete list of current TSI stock selections, logon at
http://www.speculative-investor.com/new/market_logon.asp
and then click on "Stock Selections" in the menu. When at the Stock
Selections page, click on a stock's symbol to bring-up an archive of
our comments on the stock in question. 2) The Small Stock Watch List is
located at http://www.speculative-investor.com/new/smallstockwatch.html
![]() Exiting
Cordoba Resources (CDB.V)
Exiting
Cordoba Resources (CDB.V)
Cordoba Resources (CDB.V)
announced that ownership of its San Matias copper-gold project in Colombia
will be restructured.
The current (pre-restructure) situation is
that 1) Robert Friedland's High Power Exploration (HPX) has earned a 51%
stake in the project, 2) to increase its stake to 65% HPX is obligated to
pay all costs to take the Alacran deposit (the most advanced part of the
district-scale project) through to the completion of an FS, and 3) due to
HPX's 36% ownership of CDB its total ownership of San Matias is
effectively 69% (the 51% direct stake plus an indirect stake via ownership
of CDB).
The restructuring involves CDB issuing 105M shares to HPX
in exchange for HPX's stake in the project and reimbursing HPX for
expenditure incurred since the 51% level was reached (92.7M shares for the
51% stake plus 12.3M shares for the expenditure reimbursement). This will
result in CDB owning 100% of the project and HPX owning 69% of CDB,
meaning that HPX's effective ownership of San Matias will remain the same.
The restructuring also involves CDB raising C$10M via a private placement
at C$0.81/share.
We estimate that CDB will have about 206M shares
outstanding and about C$8M of cash after the restructuring is complete.
Although this deal will have no effect on HPX's current effective
ownership of San Matias it significantly reduces HPX's future financial
commitment to the project, as the cost to HPX of taking the project
through the feasibility stage would have been high. For HPX it therefore
reduces risk while keeping most of the exposure to the upside. By the same
token, it increases the risk being borne by CDB's shareholders while not
significantly increasing their upside exposure. In other words, it's a
better deal for HPX than CDB. Furthermore, the pace of progress is likely
to slow now that CDB will be fully funding the progress.
Due to the
worsened risk/reward for CDB shareholders we are removing CDB from the TSI
Stocks List.
Just to be clear, the CDB story hasn't suddenly become
substantially less bullish, but from our perspective an important part of
the story was that project exploration/engineering would be driven and
fully funded by HPX to the point where there was a completed FS. With that
part of the story having been erased we no longer find the stock
sufficiently attractive.
CDB was added to the TSI List at C$0.77
only three weeks ago. Its most recent price was C$0.90, but it has been
halted since the HPX deal was announced on Tuesday afternoon. We don't
know when the trading halt will be removed, but when it is the stock will
likely trade well below the aforementioned C$0.90 level.
It
doesn't make sense to sell this stock at any old price, since the
potential value of the San Matias project hasn't changed. We therefore
wouldn't sell below C$0.80.
For TSI record purposes the stock will
be exited when it next trades at C$0.80 or higher.
Chart Sources
Charts appearing in today's commentary
are courtesy of:
http://stockcharts.com/index.html
http://www.barchart.com/
![]()