![]()
![]()
![]()
![]()
- Interim Update 14th December 2016
Copyright
Reminder
The commentaries that appear at TSI
may not be distributed, in full or in part, without our written permission.
In particular, please note that the posting of extracts from TSI commentaries
at other web sites or providing links to TSI commentaries at other web
sites (for example, at discussion boards) without our written permission
is prohibited.
We reserve the right to immediately
terminate the subscription of any TSI subscriber who distributes the TSI
commentaries without our written permission.
TSI Christmas and New
Year Commentary Schedule
The next Weekly Update will be
posted at the usual time on Sunday 18th December, after which we'll be
taking off on a 1-week vacation. Consequently, there will be no Interim
Update next week and no Weekly Update on Sunday 25th December. We will,
however, send out a brief market update by email on either Friday 23rd or
Saturday 24th December.
An Interim Update will be posted at the
usual time on Thursday 29th December, but there will be no Weekly Update
on Sunday 1st January. After that we'll be back to our usual
twice-per-week commentary schedule.
The nonsensical
reaction to the Fed
The Fed hiked its targeted range
for the Fed Funds Rate by 0.25% on Wednesday -- from 0.25%-0.50% to
0.50%-0.75%. It essentially had no choice in the matter, because 'the
market' had already hiked rates by a lot more than 0.25%. Furthermore,
everyone with at least an ounce of common sense and rudimentary knowledge
of what's happening in the financial world expected the rate hike. So why,
then, was there a strengthening of the US$ and sell-offs in the
already-oversold gold and T-bond markets in reaction to the Fed news?
The answer to the above question is obvious and at the same time
nonsensical. The answer is that the Fed's forecasts regarding future rate
hikes became slightly more optimistic. In particular, the Fed's economists
went from expecting two rate hikes in 2017 to expecting three rate hikes
in 2017.
The market reaction to the change in the Fed's forecasts
was nonsensical because at no time over the past 10 years has the outcome
expected by the Fed matched the actual outcome. In other words, over the
past 10 years the Fed's forecasting record is unblemished by success. For
example, at this time last year the Fed was forecasting that there would
be four rate hikes in 2016, or three more than actually occurred.
It is almost as difficult to be wrong about everything all the time as it
is to be right about everything all the time, so perhaps this time the
Fed's forecast will prove to be close to the mark. However, buying or
selling in response to a change in the Fed's forecast is just plain silly.
Why the Trump
Presidency will do down in history as a disaster
There are three reasons that the
Trump Presidency will very likely go down in history as a disaster for the
US, only the last of which has anything to do with Trump. The first two
reasons are inter-related in that they are primarily the consequences of
distortions/imbalances created by the Federal Reserve.
Due largely
to the aggressive interventions of the Fed, including the creation of
trillions of dollars via QE programs and keeping interest rates pegged
near zero for eight years, the mal-investment problem in the US economy
today is more serious than the mal-investment problem that led to the
"great recession" of 2007-2009. This means that the next recession will
probably be even more severe than the previous episode. It is possible
that the extension of ultra-easy monetary conditions combined with fiscal
'stimulus' in the form of tax cuts will delay the start of the next
recession by another 6-12 months, but for no fault of Trump it will almost
certainly happen on his watch.
Also due to the aggressive
interventions of the Fed, the US stock, bond and real-estate markets are
now valued at levels that all but guarantee terrible performance over the
coming few years. As is the case with an economic recession, it is
possible that the extension of ultra-easy monetary conditions combined
with fiscal 'stimulus' in the form of tax cuts will delay the start of the
coming period of terrible performance; however, for no fault of Trump
there will very likely be bear markets in the major US asset classes
during his first -- and almost certainly only -- Presidential term.
While the coming severe recession and the bearish trends in asset
prices were bound to occur and clearly have nothing to do with Trump, it
looks like Trump is unwittingly setting himself up to take the blame.
His one chance of avoiding blame and paving the way for a genuine
recovery to be in progress by the time of the next Presidential election
would have been to stay out of the way and allow a major liquidation of
the mal-investments to happen during the first half of 2017. This would
have enabled the blame for the debacle to be appropriately placed at the
feet of the Fed and the preceding Administration. However, having
previously (and correctly) chided the Fed for having created a "big, fat,
ugly bubble", it seems that the deadly combination of hubris and ignorance
has convinced Trump that he can set in motion a long period of strong
growth with no intervening painful purgation.
In summary, certain
bad economic and financial-market outcomes are currently set in stone.
What's not set in stone is who gets the blame. Unfortunately, Trump
appears to be positioning himself to take the blame for the economic
damage caused by others.
The Stock Market
In a
post at the TSI Blog early this week we noted that the 14-period daily
RSI (a short-term momentum oscillator) of the Dow Industrials Index had
just hit its second-highest level since 1980. The implication was that by
one measure the Dow was at its second-most 'overbought' level of the past
35 years.
However, in the same post we pointed out that this wasn't
a reason to anticipate anything more bearish over the coming few weeks
than a pullback to the 50-day MA.
The NASDAQ100 Index (NDX) confirmed the new highs achieved by most
other US stock indices by breaking out to the upside on Tuesday 13th
November. It then held the breakout on Wednesday despite the modicum of
weakness prompted by the Fed's interest-rate forecasts.
Due primarily to the speed of the recent price advances, within the
coming 6 weeks there are likely to be pullbacks in the senior US stock
indices to at least as low as their 50-day MAs and possibly as low as
their 200-day MAs. It's possible that the pullbacks began on Wednesday
14th December, but our guess is that the short-term upward trends will be
sustained into year-end and that corrections will start in early-January.
Gold and the Dollar
Gold
Even though the latest Fed news shouldn't have surprised anyone, it still
prompted another round of speculative long-liquidation in the gold market.
The overall market reaction to the Fed news also caused the already
gold-bearish fundamental backdrop to become slightly more bearish by
pushing real US interest rates upward and driving the bond/dollar ratio to
a marginal new 5-year low.
Here is a daily chart of the SPDR Gold
ETF (GLD). The chart shows Wednesday's break to a new multi-month low in
reaction to the Fed news and also shows that gold's daily RSI(14) has now
spent four weeks in 'oversold' territory (below 30). On a short-term
basis, gold is almost as 'oversold' as the Dow is 'overbought'.

Last year, the gold price bottomed on the day after the Fed's December
rate-hike announcement. There's a realistic chance that something similar
will happen this year, but due to the bearish fundamental backdrop the
rally that follows the next gold-price bottom will not be anywhere near as
long or as strong as the rally that followed the December-2015 bottom.
We think it is reasonable to expect a gold-price rebound to at least
as high as the 50-day MA ($1233 and falling quickly) and possibly as high
as the 200-day MA ($1277 and falling slowly), beginning either within the
next two days or in early-January, but not to expect anything more than
that. In other words, we think it's reasonable to expect gold to do
roughly the opposite of the senior US stock indices over the next several
weeks.
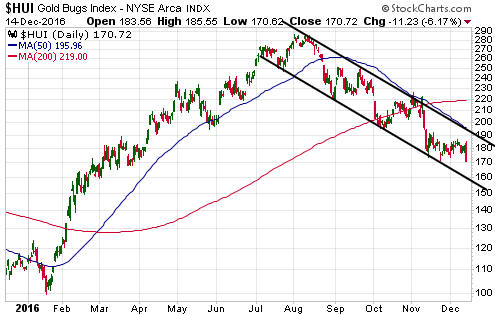
Gold Stocks
Current Market Situation
The
potentially-bullish divergence between the HUI and gold bullion was
eliminated on Wednesday 14th December. By closing at a new multi-month low
the HUI has fallen into line with the bullion market.
This week's
price action suggests that the HUI is on the way to its channel bottom,
which is currently near 160.
Will tax-loss selling create opportunities
this year?
The answer to the above question is yes; however,
in a year when all sectors of the market and most stocks have gained
ground, the opportunities will be scattered.
Despite the
gold-mining indices being well above their 2015 year-end price levels,
tax-loss selling prior to 31st December (the end of the 2016 tax year in
the US and Canada) could be a factor in the gold-mining sector. There are
two main reasons.
First, although they may well still be higher on
a year-to-date basis, many small-cap gold-mining stocks have fallen a long
way from the levels at which they traded during May-September. Second, the
public tends to become more enthusiastic about an investment as the price
of the investment rises, so it's likely that the bulk of the public's 2016
buying of gold-mining stocks occurred when prices were relatively high.
This means that many of the people who bought gold stocks this year and
haven't yet sold will now be sitting with large unrealised losses. Some of
these losses will undoubtedly be realised before year-end for tax
purposes.
Over the next two weeks we will be on the lookout for
small-cap stocks that appear to have been the victims of tax-loss selling
and have the potential to rebound strongly in January. Any good
opportunities that we find will be mentioned at TSI, most likely during
the final trading week of the year.
The Currency Market
The euro is precariously positioned
The euro has again dropped to major support near 105. As far as we are
concerned, the only question is: Will a break below the major support
happen this month or wait until the first quarter of next year?
Sorry, we don't have the answer. We have been leaning towards a multi-week
rebound prior to a breakdown, but while this is still a realistic
possibility the price action is currently not providing a reason to be
optimistic on even a near-term basis.
What could happen over the
coming few days is a spike below 105, creating the impression that a major
breakdown is in progress, followed by an immediate reversal and a move
back to at least 106. This sort of price action (a false downside
breakout) would probably set the stage for a significant euro rebound over
the ensuing few weeks.
They are called "commodity currencies" for a
reason
The first of the following charts shows the positive
correlation between the Canadian Dollar (C$) and the Goldman Sachs Spot
Commodity Index (GNX) over the past 15 years. The C$ and GNX sometimes
diverge, but divergences tend to be short-lived.
A divergence has
occurred over the past few months, with GNX rallying to a new high for the
year while the C$ trended downward. In the past, divergences have usually
been closed via GNX falling into line with the C$.
The second of
the following charts shows the positive correlation between the Australian
Dollar (A$) and GNX over the past 15 years. The correlation between the A$
and GNX is not quite as strong as the correlation between the C$ and GNX,
but it is still crystal clear that the two trend in the same direction
most of the time.
Although it is not as obvious on the long-term
chart, there has also been a significant divergence over the past few
months between GNX and the A$. Specifically, GNX has recently been
stronger than would be expected given the performance of the A$.
The bottom line is that the currency market points to weakness in
commodity prices over the next couple of months.
Updates on Stock Selections
Notes: 1) To review the complete list of current TSI stock selections, logon at
http://www.speculative-investor.com/new/market_logon.asp
and then click on "Stock Selections" in the menu. When at the Stock
Selections page, click on a stock's symbol to bring-up an archive of
our comments on the stock in question. 2) The Small Stock Watch List is
located at http://www.speculative-investor.com/new/smallstockwatch.html
![]() Adding
Adriana Resources (TSXV: ADI) to the TSI List at Wednesday's closing price
of C$0.16
Adding
Adriana Resources (TSXV: ADI) to the TSI List at Wednesday's closing price
of C$0.16
ADI.V is in the process of merging with Sprott
Resource Corp. (SCP.TO), a current member of the TSI Stocks List, to
create a new company called Sprott Resource Holdings (SRH). In our
discussion of the merger in the 5th December Weekly Update, we wrote:
"SCP is a good candidate for new buying near its current price of
C$0.54. However, ADI is possibly an even better buy near its current price
of C$0.18. The reason is that even though three new ADI shares will be
paid for each SCP share, the existing ADI shares are worth slightly more
than one-third of an SCP share due to the fact that pre-merger ADI
shareholders will receive one-quarter of a 5-year warrant with an exercise
price of 33.3c to go along with each of their shares. We calculate that
fair value for these warrants would be about C$0.05 at ADI's current price
of C$0.18, which means that they would add about 0.01 to the value of each
existing ADI share (since each existing share would be entitled to
one-quarter of a new warrant). This is obviously not much, but the warrant
value will rise exponentially, making the warrants relatively more
important, if the stock price rises. For example, if the ADI stock price
were to rise about 70% to its currently-estimated post-merger NAV of
C$0.30 then our calculated fair value for the warrants would rise 160% to
around C$0.13.
So, to get the warrants we would be inclined to
favour ADI over SCP for new buying as long as ADI is trading at one-third
of SCP or lower. Note, though, that there is slightly greater risk
associated with buying ADI rather than SCP due to the small chance of the
merger not being completed. Due to this risk it wouldn't be wise to pay
more for ADI shares than C$0.19 or one-third of the SCP share price,
whichever is lower."
In response to general market volatility,
SCP has since pulled back to C$0.52 and ADI has pulled back to C$0.16.
Considering the potential value of the warrants that will be received
by ADI shareholders assuming completion of the merger, C$0.16 is an
attractive price for the stock. Therefore, even though SCP is already part
of the List, to get the warrants we have added ADI. The two stock
positions will change to one stock position and one warrant position when
the merger is finalised.
In the current market environment there
should be no need to pay more than C$0.17 for ADI shares.
Chart Sources
Charts appearing in today's commentary
are courtesy of:
http://stockcharts.com/index.html
![]()