|
- 15 January, 2003
War and
the Markets
Our current views are that gold will
reach new highs and the US$ will reach new lows during the first quarter
(following short-lived counter-trend reactions) and that the US stock market
will fall. The potential war against Iraq represents the biggest threat
to these views.
If uncertainty was removed either by
the US attacking Iraq or by the probability of war being substantially
reduced then the US stock market would experience a decent rally (our guess
would be a gain of around 5-10%), thus prolonging the overall advance from
the 10th October bottom by at least a few weeks. However, we don't think
that the removal of this uncertainty or any sort of war-related news could
ignite a new bull market. For one thing, the high valuations would still
weigh on the market. For another thing, as far as we can tell there really
isn't much of a 'war discount' in the stock market. Put/call ratios, volatility
indices and sentiment surveys show that market sentiment is presently quite
complacent, so it isn't the case that the market is being held back by
a wall of fear and, therefore, that it is positioned to surge forward once
war-related anxiety is removed.
The market in which the removal of
any 'war discount' would have the biggest impact is, we think, the currency
market. Almost every time the US$ has fallen over the past 2 months the
financial media has blamed the brewing conflicts with Iraq and/or North
Korea. Dollar weakness has absolutely nothing to do with Iraq (the US$
has been weak because dollar-denominated investments haven't been performing
well enough to entice enough new foreign investment into the US each month
to offset the huge US current account deficit), but unlike the stock market
the US$ is extremely oversold. As such, any news that is widely perceived
to be bullish could be the catalyst for a powerful US$ rebound.
Since the gold price will almost certainly
continue to trend in the opposite direction to the US$, anything that causes
a sharp rally in the dollar is likely to cause a sharp pullback in the
gold price.
As far as the financial markets are
concerned Iraq is a major distraction. If not for the seemingly-inexorable
march toward an invasion of Iraq the markets would be focused on corporate
earnings and the economy, in which case the probability of significant
additional upside in the stock market or anything more than a 2-4 week
'dead cat bounce' in the US$ would be very low.
The US
Stock Market
The Barrons Roundtable
Every January Barrons magazine arranges
a "Roundtable" discussion involving several well-respected,
high-profile investment strategists and money managers. These investment
professionals give their views on what is likely to happen with the economy
and the financial markets over the coming 12 months. The first part of
this year's Roundtable was included in the current edition of Barrons.
Although the Roundtable participants
are professionals who usually come up with at least a few insightful comments
during the annual Roundtable discussions, the sentiment of the Roundtable
participants generally reflects the sentiment of 'the public'. That doesn't
mean that the consensus view of this group should automatically be faded.
It's just that, like most people, these 'master strategists' are either
slow to recognise, or reluctant to acknowledge, major trend changes.
All the American participants in this
year's Roundtable (9 out of the 11 attendees) were reasonably optimistic
with regard to the prospects for both the US stock market and the US economy
(as they were last year), with most expecting the stock market to gain
5-10% over the course of this year. Abby Joseph Cohen was the most bullish
on the stock market, expecting the S&P500 Index to finish the year
at 1150 (this would be a gain of 26% for the year). By the way, although
we think Ms Cohen will be proven horribly wrong for the 4th year in succession
we don't think she is a particularly useful contrary indicator. This is
because she is always bullish (she was bullish all the way up and has been
bullish all the way down). It is becoming clear that she will simply remain
bullish until she resigns from Goldman Sachs to spend more time with her
family.
Apart from the usual suspects (a strong
economy during the second half of the year and high productivity growth),
the main reasons given for being bullish on the stock market were:
a) The Fed is aggressively trying to
'reflate', thus providing the markets with enormous monetary stimulus.
In addition, the US Government is going to provide fiscal stimulus and
tax cuts. Most of the Roundtable participants seemed to believe that the
combination of these two stimuli would ensure that 2003 and 2004 would
be reasonably good years for both the economy and the stock market.
b) Believe it or not, the Iraq situation
was generally perceived as being a positive influence. After reading the
Roundtable we came away with the view that a war would be won quickly and
decisively by the US and would provide even more stimulus to the economy.
Furthermore, it would result in a sharp drop in the oil price, providing
US consumers with the equivalent of another tax cut. However, if a war
doesn't happen then that would also be positive because the resultant collapse
in the oil price would give the economy a substantial boost. In other words,
the potential war with Iraq was perceived as a 'no lose situation' for
the US economy.
For most of the Roundtable participants
(Marc Faber being a notable exception) the huge debt burdens being carried
by both US consumers and corporations didn't seem to be a major issue,
nor did the enormous US current account deficit and the US economy's unhealthy
reliance on consumer spending. It doesn't seem to have occurred to them
that if the 'reflation' that is currently being attempted has any effect
at all it will be to encourage a further increase in debt and cause a further
rise in the already-substantial current account deficit, thus creating
an even bigger problem than currently exists. And, it didn't seem to matter
that no economy has, in the past, ever transitioned from a massive credit-induced
boom to another sustainable economic expansion without first eliminating
the boom-time excesses. If only central banks during other periods or in
other countries had come up with the brilliant idea of inflating their
way out of trouble, like today's Fed is doing, the severe recessions and
depressions of the past would never have been necessary. If only other
governments had considered massive deficit spending as a way to ease the
pain during periods of economic weakness.
Each Roundtable participant is always
asked to provide a list of stocks and other investment ideas that they
think will do well over the coming 12 months. Interestingly, the gold sector
was the best performing sector of the market last year yet Marc Faber was
the only participant in last year's Roundtable to include gold stocks amongst
his selections. Even more interestingly, during this year's Roundtable
discussion Faber was the only one who mentioned gold, with the exception
of the following comment from Barton Biggs: "I've never been able to
understand it. Gold is a speculative asset, not an investment asset. There's
no criteria for measuring value or yield with gold." Fair enough, can't
really expect the Chairman of Morgan Stanley Dean Witter Investment Management
to understand something as complicated as gold.
Current Market Situation
Since the bear market began in March
of 2000 the A$ has tended to be strong relative to the euro during those
times when the US stock market has been strong, that is, during the bear
market rallies, and weak relative to the euro during those times when the
stock market's medium-term trend has been down. Also, turning points in
the euro/A$ rate have lined up quite closely with turning points in the
S&P500 Index.
Further to the above, here is a chart
showing the A$ in terms of the euro (the line on the chart rises when the
A$ is strengthening relative to the euro) with notes/arrows identifying
the important turning points in the US stock market. Anyone familiar with
the path taken by the US stock market over the past few years should quickly
recognise the strong positive correlation between the euro/A$ rate and
the S&P500 Index.
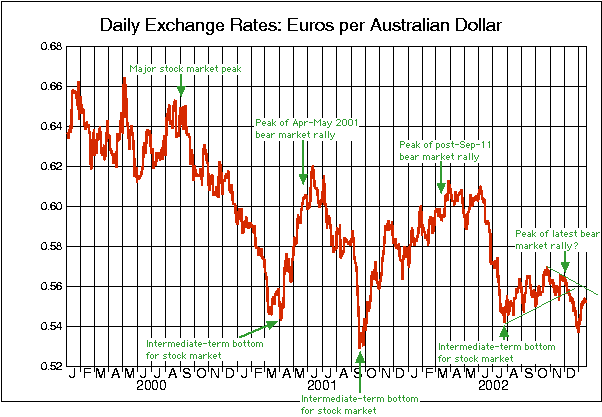
We've gleaned the following from the
above chart:
a) The recovery in the S&P500 Index
since July of last year has been the weakest rally since the bear market
began.
b) The euro/A$ rate dropped to a new
52-week low at the end of December-2002. This new low suggests that the
2nd December peak in the stock market will turn out to be THE peak of the
latest bear market rally.
c) The euro/A$ rate has recovered with
the stock market since the beginning of this year, but at this stage it
remains in a short-term downtrend. However, if the euro/A$ rate breaks
out of its short-term downtrend we will need to seriously question our
short- and medium-term bearish views on the stock market.
Based on the performance of the euro/A$
rate over the past 3 years it makes no sense to be bullish on the A$ relative
to the euro unless you are also bullish on the stock market, and vice versa.
Correspondingly, if you are bearish on the stock market you should be anticipating
weakness in the A$ relative to the euro.
We expect the A$ to be trading significantly
higher in 18 months time than it is now, relative to the euro, as a result
of persistent strength in commodity prices. However, if our medium-term
bearish view on the stock market proves to be correct then the euro will
most likely out-perform the A$ over the next 3-6 months.
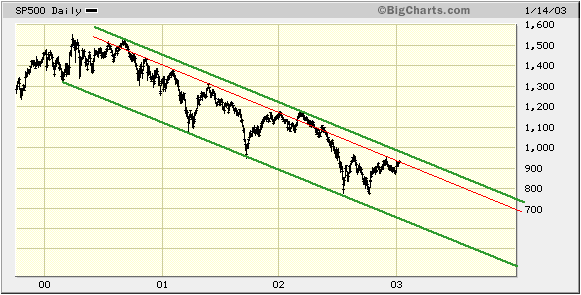
Below is a chart of the S&P500
Index showing the major downward-sloping channel in which the index has
been mired since the first quarter of 2000. Note that the two strongest
rallies during the bear market failed at the top green trend-line while
every other rally, with the exception of the July-August 2002 bounce, failed
at the red trend-line. Earlier this week the S&P500 moved right up
to the red trend-line, so if we are going to see a rally failure now would
be a logical time for it to occur. However, even if the S&P500 is able
to close above 935 (Monday's intra-day peak) it will run into formidable
resistance at around 950-970 (the major channel top, the 200-day moving
average and the December/August peaks). We will be VERY surprised if the
S&P500 Index breaks upwards out of its major bear market channel in
the near future, although as discussed earlier in today's commentary some
'good' news on the war front has the potential to create such a breakout.
The big news on the earnings front
so far this week was Intel's latest quarterly report. Intel beat the consensus
earnings and revenue estimates, but slashed its capital-spending budget
(Intel is planning to buy a lot less manufacturing equipment than the market
was previously expecting). This means that sales for the semiconductor
equipment companies (Intel's suppliers) are going to be much worse than
expected, a real problem since the stocks of the semiconductor equipment
companies sell at absurdly high multiples of their annual sales. Therefore,
huge downside risk remains in the semiconductor sector despite the large
decline that has already occurred over the past 2 years.
After the close of trading today we
get the latest financial reports from IBM and Microsoft.
Gold and
the Dollar
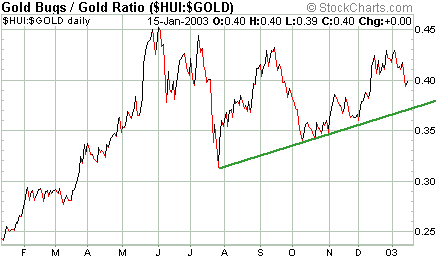
Gold Ratios
To illustrate how gold stocks are performing
relative to the bullion price we usually look at the ratio of the TSI Gold
Stock Index (TGSI) and the gold price. However, the HUI/gold ratio is almost
as good ("almost" because the TGSI does a better job than the HUI of representing
the performance of the average gold stock).
Below is a chart showing the HUI/gold
ratio over the past 12 months. Note that the ratio peaked in May, bottomed
towards the end of July, and has since been trending higher. An upward
trend in the ratio is bullish, although when the ratio moves to an extreme
it is a sign that speculation in the gold shares has become excessive and,
therefore, that an intermediate-term peak is close at hand. Our expectation
is that the HUI/gold ratio will move up to near its May peak before the
next major downturn in the gold market gets underway. Actually, based on
where the ratio traded in 1996 a move up to around 0.50 wouldn't be surprising.
In any case the ratio is currently not near an extreme and is thus consistent
with our view that higher prices for gold stocks will be seen over the
next 1-3 months.
In past commentaries we've looked at
the performance of Harmony Gold (HMY) relative to Goldcorp (GG) to check
how the gold stocks that have high leverage to the gold price (represented
by HMY) were doing relative to the gold stocks with much lower leverage
to the spot gold price (represented by GG). Since the stock prices of HMY
and the other SA gold stocks appear to have recently been held back by
strength in the SA Rand (over the past few months Rand strength has offset
any benefit the SA gold miners would otherwise have received as a result
of gains in the US$ gold price), we'll now use Kinross Gold (KGC) instead
of HMY in our comparison.
Further to the above, below is a chart
showing the KGC/GG ratio over the past 12 months. Because KGC has greater
leverage to changes in the spot gold price than GG it should out-perform
GG in a rising gold market and under-perform GG in a falling gold market.
This is, in fact, what has happened. KGC moved sharply higher relative
to GG between February and May of 2002, then fell sharply between June
and October of 2002. Since the bottom in both gold stocks and gold during
October of 2002 KGC has been moving higher relative to GG, thus confirming
the bullish trend in the gold market. Note, though, that the KGC/GG ratio
is still a long way below its May-2002 peak. As is the case with the HUI/gold
ratio, the performance of the KGC/GG ratio strongly suggests that bullish
sentiment towards the gold sector is not yet close to a dangerous extreme
(there hasn't yet been a pronounced shift into the highly-leveraged stocks
at the expense of the safer stocks).

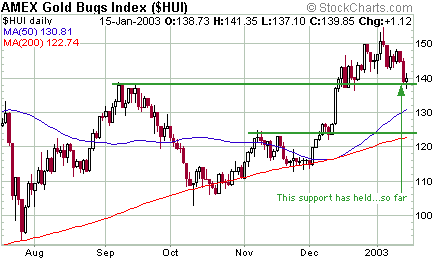
Current Market Situation
In yesterday's E-mail Alert we said
that a 2-4 week correction in the gold market was probably underway, but
"with most gold (and silver) stocks having already experienced significant
pullbacks from their recent highs it is likely that additional time, more
so than additional price weakness, will be needed to set the stage for
the next advance." The below chart of the HUI shows that support defined
by the September peak has held thus far, so it is possible that the price
lows for most of the major stocks have already been seen. If support at
around 137 gives way then the next most likely levels for the HUI to find
support would be at the 50-day moving average (currently at around 131)
and the November peak (around 124). Note that we do not expect the HUI
to fall anywhere near as low as 124.
None of the sell-stops recently placed
on the major gold/silver stocks included in the TSI Stocks List have yet
been hit, although any significant additional weakness in the gold sector
would almost certainly result in one of more of the stocks being stopped
out. If this happens we will replace the stopped-out majors with more juniors,
probably not immediately but as soon as we see some evidence that the correction
has ended. Placing under-the-market bids for some of the high-potential
juniors such as Desert Sun Mining (TSXV: DSM) and American Bonanza (TSXV:
BZA) is a reasonable approach at the present time.
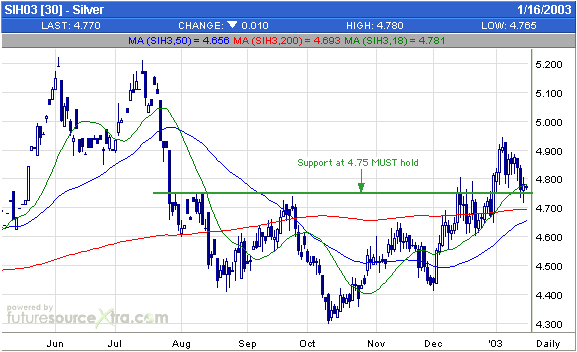
Below is a daily chart of March silver
futures. While the gold price has plenty of room to 'correct' without doing
any technical damage to the bullish case, the silver price is now poised
right at important support. If silver closes below 4.75 then the recent
rally was yet another false breakout. At this stage, though, what we have
is an upside breakout and what looks like a typical breakout pullback.
In summary, there is no evidence at
this time that we have seen anything more significant than short-term peaks
in the gold/silver prices and the prices of gold/silver stocks. We continue
to expect the prices of most gold stocks to hit new highs during the first
quarter of this year before an intermediate-term peak in the gold sector
is reached.
Chart Sources
Charts appearing in today's commentary
are courtesy of:
http://stockcharts.com/index.html
http://www.futuresource.com/
http://bigcharts.marketwatch.com/
http://pacific.commerce.ubc.ca/xr/plot.html

|
