![]()
![]()
![]()
![]()
- Interim Update 15th February 2017
Copyright
Reminder
The commentaries that appear at TSI
may not be distributed, in full or in part, without our written permission.
In particular, please note that the posting of extracts from TSI commentaries
at other web sites or providing links to TSI commentaries at other web
sites (for example, at discussion boards) without our written permission
is prohibited.
We reserve the right to immediately
terminate the subscription of any TSI subscriber who distributes the TSI
commentaries without our written permission.
The Philippines is off
limits to mining investors
Strict environmental regulations
shouldn't be a major problem/risk for mining companies provided that the
regulations are very clear and are consistently applied. Unfortunately,
the regulations are often not clear and/or not applied with consistency.
Instead, whether a mine or a proposed mine is deemed to comply with the
government's environmental requirements often comes down to the subjective
or arbitrary assessment of a bureaucrat or politician. This has certainly
been the case of late in the Philippines, with Regina Lopez, the
Environment and Natural Resources Secretary, ordering the closure of 23 of
the country's 41 mines and halting the development of many other mines.
Some of the mines that have recently been shut down in the
Philippines probably deserved it, but the Secretary appears to be an
environmental crusader who has adopted a 'shut down first ask questions
later' approach to the mining industry. The result is that for the time
being there is far too much uncertainty regarding the ability to obtain
and maintain the necessary environmental permits to warrant making any
mining-related investments in the Philippines.
Therefore and with
one exception, until/unless there is a substantial change in the political
situation we will not consider buying the shares of any mining company
focused on the Philippines. The one exception will be when we can
effectively get a company's Philippine assets for free, meaning that the
company is being valued by the stock market for less than its cash.
The Stock Market
The US
Sentiment Extreme
Market Vane's
bullish percentage for the NASDAQ100 (the percentage of traders surveyed
by Market Vane who describe themselves as bullish on the NASDAQ100 Index)
has reached 90. Our Market Vane data only go back 13 years, so it's
possible that higher readings were achieved in the lead-up to the
March-2000 bubble top. However, 90% is the highest reading of the past 13
years. It is most definitely 'extreme'.
The following chart is
based on the Investors Intelligence sentiment survey and shows that the
bull/bear ratio (the percentage of bullish advisors divided by the
percentage of bearish advisors) is now also at an extreme. It got a little
higher during 2014 and the first half of 2015, but apart from that it
hasn't been above its current level since 1987.
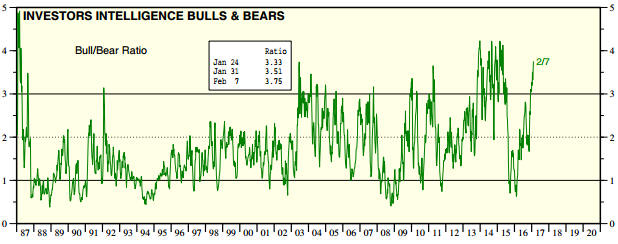
Chart Source: Yardeni.com
After the bull/bear ratio reached its current extreme level in 2014,
nothing dramatically bearish happened to the stock market. There were
pullbacks of a few percent in the S&P500 Index (SPX), but the
intermediate-term upward trend continued. However, when the bull/bear
ratio reached its current level during the first half of 2015 the market
was close to an intermediate-term peak.
The most important
difference between the bull/bear extremes of 2014 and the bull/bear
extreme of 2015 is that market internals were weaker during the latter
period. The bearish divergence between the SPX and market internals that
began to develop in early-December of last year makes the current
situation more like the second quarter of 2015 (within three months of the
start of an intermediate-term decline) than any time in 2014.
Also
worth mentioning is that the average valuation is higher today than it was
at the intermediate-term peak of 2015 and the bull market is now about 18
months older.
Does this mean that the downside potential is at
least as high today as it was during the months just prior to the dramatic
decline of July-August 2015?
Yes, it does. It won't surprise us if
the market maintains an upward bias into March, perhaps spurred on by the
anticipation of and reaction to Trump's "phenomenal" tax plan. There's
even a chance of an upside blow-off, or, to put it more accurately, an
extension to the current upside blow-off, within the next few weeks. But
with or without an additional near-term surge to the upside, we suspect
that the SPX will trade 10% below its current level before the middle of
the year.
In recognition of the sentiment extreme, the
bearishly-diverging market internals, the absurdly high average valuation
and the unusually-low volatility, we are now intermediate-term bearish on
the US stock market.
Despite their more attractive valuations, due
to the US stock market's global influence we are also becoming
increasingly concerned about downside risk in most other stock markets
around the world. We would like to buy into some of these other markets
(the Japanese market, for example) but expect that opportunities to do so
at significantly lower prices will arrive during the second and/or third
quarters of this year.
Current Market
Situation
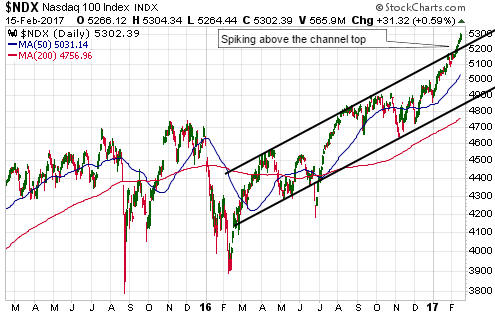
The following daily chart shows that the current
short-term rally in the NASDAQ100 Index (NDX) has accelerated to a
sufficient degree to take the index above the top of the channel that
capped last year's short-term rallies. This suggests that an upside
blow-off is in progress.
The next chart shows the performance of the Volatility Index (VIX)
over the past 20 years. The VIX probably bottomed near a 20-year low at
the beginning of this month and greater volatility probably lies in store
regardless of whether the senior indices are close to important peaks.
Risk-tolerant speculators could reasonably consider buying VIX call
options expiring in April or May in anticipation of the VIX spiking up to
at least 15-20 within the coming two months.
It's possible that the senior US stock indices will make
intermediate-term tops (highs that hold for more than 6 months) as early
as this week. Be aware, however, that important tops in the US stock
market almost always involve at least one test of the high and often
encompass a sequence of marginal new highs separated by pullbacks of a few
percent. Therefore, rather than an intermediate-term decline beginning
from whatever high is made over the next few days there's a higher
probability of a pullback followed by a rise to test or marginally exceed
whatever high is made in the near future.
Our new bearish outlook
reflects the perception that intermediate-term downside risk is now much
greater than any remaining upside potential and that an intermediate-term
top will probably be put in place within the coming two months.
Gold and the Dollar
Gold
At
this time last week the gold price had broken solidly above resistance at
$1220 and was within about $20 of its 200-day MA (our short-term upside
target). The market was also slightly 'overbought', suggesting that some
sort of price peak would soon be put in place -- possibly after a quick
move up to the 200-day MA.
Since then, very little has happened.
The gold price hasn't been able to extend its advance, but on a daily
closing basis it has remained above the $1220 short-term breakout level.
It therefore still stands a decent chance of reaching its 200-day MA
before a significant correction gets underway.
Based on the price
action of the past three weeks we think that the 20-day MA (the black line
on the following chart), which is presently at $1216, can now be used as a
short-term demarcation level. We are referring to the fact that this
moving average has been acting as support.
What we mean by
"demarcation level" in this case is that the benefit of the doubt should
be given to the short-term bullish scenario as long as the gold price does
not close below its 20-day MA. If the gold price does close below its
20-day MA then it will be prudent to assume that a significant downward
correction has begun.
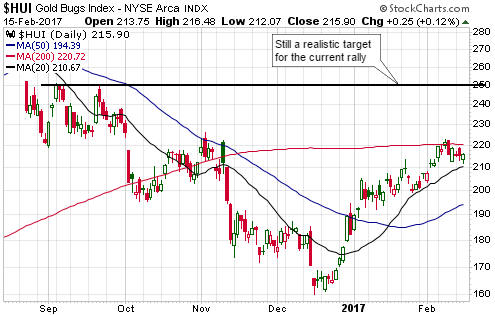
Gold Stocks
Like gold bullion, the HUI has
essentially marked time over the past 5 trading days and appears to be
'respecting' its 20-day MA (the black line on the following chart).
Consequently, as is the case with gold it makes sense at this time to use
the 20-day MA as a short-term demarcation level for the HUI.
The
HUI's 20-day MA is slightly above 210, a level where there is also some
lateral support. Therefore, the benefit of the doubt should be given to
the short-term bullish scenario as long as the HUI does not close below
210.
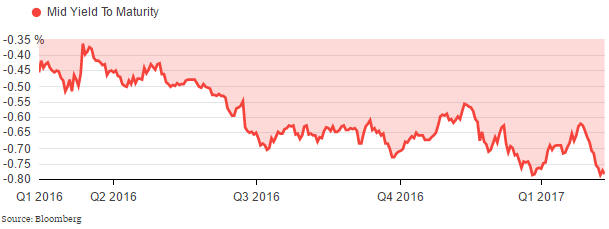
The Currency Market
The current annual rate of
increase in Germany's CPI is 1.9% and the trend is up. The rate of
increase will probably rise above 2% this quarter. At the same time, the
following chart shows that the yield-to-maturity on the 2-year bonds
issued by the German government has recently plunged to negative 0.8%. The
implication is that the real yield on German 2-year government bonds is
presently about MINUS 2.7%. Who would buy such a bond?
The answer is the Bundesbank (Germany's central bank). As part of the
ECB's brilliant strategy the Bundesbank is obligated to buy a certain
quantity of 2-year German government bonds each month, regardless of
price. The price is now so high (the yield is now so low) because previous
official-sector buying has created a shortage.
The plunge in German
interest rates over the past couple of weeks is the main source of the
recent downward pressure on the euro. The euro has been pushed a little
below its 50-day MA, but Wednesday's upward reversal keeps alive the
possibility of a rise to 109.5-110.0 before the bear market resumes.

While the euro closed slightly below its 50-day MA on both Tuesday and
Wednesday of this week, the Dollar Index has not yet been able to close
above its 50-day MA. In early trading on Wednesday it looked almost
certain that a daily close by the Dollar Index above its 50-day MA was
going to happen, but a reversal occurred and the moving-average resistance
held.
This keeps alive the possibility of a fall to 97.5 before the
bull market resumes.
Updates on Stock Selections
Notes: 1) To review the complete list of current TSI stock selections, logon at
http://www.speculative-investor.com/new/market_logon.asp
and then click on "Stock Selections" in the menu. When at the Stock
Selections page, click on a stock's symbol to bring-up an archive of
our comments on the stock in question. 2) The Small Stock Watch List is
located at http://www.speculative-investor.com/new/smallstockwatch.html
![]() Exiting
the Global X Uranium ETF (URA). Recent price: US$18.43
Exiting
the Global X Uranium ETF (URA). Recent price: US$18.43
URA
is an ETF that holds uranium-mining stocks and has been in the TSI Stocks
List since July-2015.
A few weeks ago we wrote that URA would be
removed from the TSI List if it moved up to US$19.00, mainly due to our
concern that the uranium-mining sector was a long way ahead of the
underlying commodity market. It traded above $19 on both Tuesday and
Wednesday of this week before reversing downward on Wednesday. It has now
been removed from the TSI List, using Wednesday's closing price of $18.43
for record purposes.
URA is only up by about 10% since its addition
to the List but is up by about 40% since the beginning of this year and
almost 70% since its November-2016 bottom.
Chart Sources
Charts appearing in today's commentary
are courtesy of:
http://stockcharts.com/index.html
http://www.bloomberg.com/
![]()