![]()
![]()
![]()
![]()
- Interim Update 15th March 2017
Copyright
Reminder
The commentaries that appear at TSI
may not be distributed, in full or in part, without our written permission.
In particular, please note that the posting of extracts from TSI commentaries
at other web sites or providing links to TSI commentaries at other web
sites (for example, at discussion boards) without our written permission
is prohibited.
We reserve the right to immediately
terminate the subscription of any TSI subscriber who distributes the TSI
commentaries without our written permission.
Erratum
It seems that nobody noticed the
deliberate mistake in the latest TSI Weekly Update. We wrote, under
"Drunken sailors have taken over the US Treasury":
"...a few
days after Team Trump took over the Executive Branch of the US Government
there was about $390B in the TGA. At last count (on 8th March) there was
only $66B in the account. This means that $224B has been drawn out of the
account over the past 6 weeks."
$390B minus $66B is, of
course, $324B not $224B. Team Trump drew down the US government's cash
buffer by an incredible $324B within the space of only 6 weeks.
The
13th March Weekly Update has been corrected.
The Fed meets
expectations
The Fed did what 'everyone' was
expecting on Wednesday 15th March, which is announce a 25 basis-point
(0.25%) increase in its targeted overnight interest rates. The interest
rates it directly targets are the Fed Funds Rate (FFR) and the interest
rate paid on bank reserves held at the Fed. If the financial markets were
completely rational then doing something that everyone expects would have
no effect on price, but what actually happened in reaction to the Fed's
widely anticipated move was a decline in the US$ and a rise in almost
everything priced in US dollars, including stocks, bonds, commodities and
gold. A Fed rate hike must therefore be bullish for everything except the
US$!
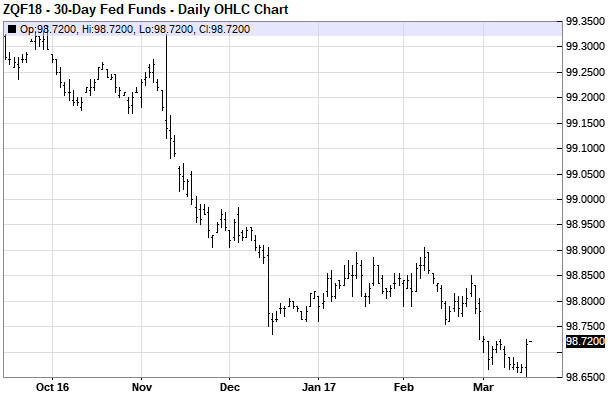
The following daily chart of the January-2018 Fed Funds
Futures (FFF) contract, which reflects the expected level of the FFR at
the end of this year, goes a long way towards explaining the general
financial-market reaction to both this week's rate-hike announcement and
the recent telegraphing by the Fed of its intention to do a rate hike in
March. (Note: The level of the FFR implied by a FFF contract is 100 minus
the price of the contract, so, for example, a rise in the FFF price from
99.60 to 99.80 would imply a decline in the expected interest rate from
0.40% to 0.20%.) The chart shows that the expected level of the FFR at the
end of this year:
1) Actually fell by a small amount in reaction to
Wednesday's rate-hike announcement.
2) Is almost identical now to
what it was at the beginning of this month, which means that all the
recent 'jawboning' by Fed representatives had no effect on what the
'market' expects the Fed to do over the course of 2017.
3) Is now
only 3 basis-points higher than it was in mid-December of last year.
The fact that there has been minimal change in the market's
expectations of what the Fed will do doesn't mean that noteworthy market
moves didn't happen on Wednesday 15th March. The most significant was the
rebound in the T-Bond futures price from critical support defined by its
December-2016 low.
Here's a daily chart of the March-2017 T-Bond
futures contract.
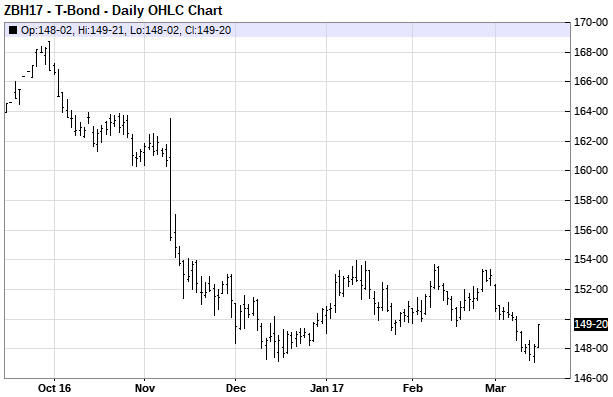
When the T-Bond price decisively takes out its December-2016 low it
will be a very important event for the entire financial world. In
particular, it will be ominous for the stock market.
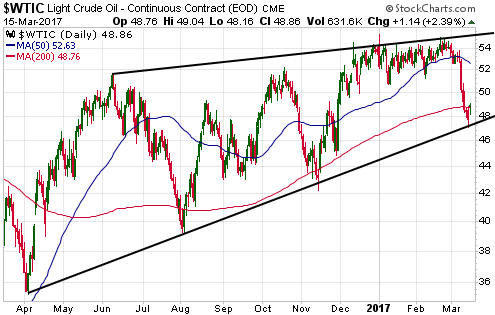
The oil price is rebounding
from support
In the latest Weekly Update, we wrote:
"Oil broke out to the
downside last week and will probably trade below $40 before reaching a
sustainable low, but it is now 'oversold' on a short-term basis and in the
midst of support extending from a trend-line near $47.50 to the 200-day MA
at $48.78. It therefore won't be a surprise to us if the oil price soon
begins to rebound.
A routine counter-trend rebound would take the
price back to the low-$50s and probably create a good opportunity for a
bearish oil speculation..."
After testing the aforementioned
trend-line support near $47.50 early this week, the oil price began to
rebound. If this is a routine counter-trend rebound (we think it is) then
it will probably end at or below the 50-day MA (the blue line on the
following chart).
Taking out this week's low near $47.50 would
suggest that a decline to below $40 was in progress.
The recent sharp drop in the oil price to an important chart-related
support level pushed some energy-related ETFs and equities down to near
important support levels of their own.
For example, the First
Trust Natural Gas ETF (FCG) rebounded from intermediate-term lateral
support at US$23.00 over the past two days. FCG stands a good chance of
rebounding as far as the $25.00-$25.50 range and could rebound as far as
lateral resistance at $27.00 within the context of an on-going
intermediate-term decline.
For another example, the US-traded shares (ADRs, actually) of Russian
company Gazprom (USOTC: OGZPY) are within about 5% of intermediate-term
lateral support at US$4.00, having traded as high as $5.30 in January.
Gazprom interests us as a potential intermediate-term speculation. It
is a massive company (it owns an incredible 17% of the world's natural gas
reserves and has annual revenue of more than US$80B), but it has the
risk/reward profile of a junior. The risk is high due to the business
being based in Russia and the US$19B of net debt, while the reward is high
due to the low valuation. With regard to the valuation, at the current
stock price the P/E ratio is less than 4 and the dividend yield is about
6%.
Despite our expectation that the oil price will trade below
$40 within the coming few months, we'll add OGZPY to the TSI List if it
trades at US$4.10.
Bitcoin
We have been observing Bitcoin's evolution from afar and admittedly don't
know a lot about it, so please take that into account when reading the
following comments on the subject.
First, here's what Bitcoin is
not:
1) A reliable long-term store of purchasing power
2) A
viable means of saving
3) A safe haven
4) Money
Next,
here's what Bitcoin is:
1) A free-market solution that wouldn't
exist in a free market. By this we mean that Bitcoin could only have
appeal in a world where the money is imposed by government and is not a
physical thing of value or a claim to a physical thing of value. In such a
world, people become accustomed to money having no perceived value outside
of its role as a medium of exchange, which results in most people having
no conceptual problem with a medium of exchange that doesn't exist outside
the memory bank of a computer. In the sort of monetary system that would
exist in a free market, Bitcoin would have no appeal, although there would
almost certainly be applications for the blockchain technology on which
Bitcoin is based.
2) A medium of exchange that has no chance of
ever becoming money (the GENERAL medium of exchange). Bitcoin will never
become money because the only way that something with no value outside of
its role as a medium of exchange can ever become money is via government
command. The government is never going to command the use of Bitcoin,
although there's a reasonable chance that the government will end up
creating its own Bitcoin-like currency.
3) A speculative plaything.
We get the impression that the enthusiasm of many Bitcoin holders is due
mostly to its upside price potential, which is why they seem to view the
extreme price volatility as more of a plus than a minus.
4) A way
for Chinese citizens to circumvent capital controls. This aspect has been
the main driver of Bitcoin's price over the past 12 months due to many
people in China figuring out that they could use Bitcoin to get around
their government's restrictions on international money transfers. Our
guess is that the control freaks in the Chinese government won't put up
with this for much longer.
5) A way of transporting wealth across
borders. It is becoming very difficult to transport more than a few
thousand dollars in physical notes from one country to another, and
electronic transfers of money within the banking system tend to be closely
monitored by the government. It is also difficult to transport gold and
silver coins or bars with sizable monetary value from one country to
another. Bitcoin, however, is a way of doing the transfer with relative
ease and minimal risk, but only because speculative and Chinese demand is
underpinning the price.
One of the biggest threats to Bitcoin is
that it is essentially a "greater fool" speculation, meaning that people
are prepared to pay a high price today for something of no real value
based on the belief that someone else will be foolish enough to pay a
higher price in the future. In this respect, although Bitcoin has been
compared to gold it has a lot more in common with shares of Northern
Dynasty Mining.
Another big threat is a government clampdown.
There's a high probability that this is coming (governments hate
competition with the official money), the only real question being when.
We think that Bitcoin's ultimate price will be zero, but we have no
clue regarding how high its price will go before reality sets in.
The Stock Market
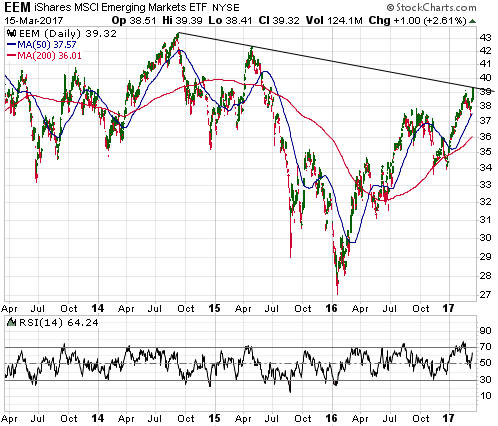
The Emerging Markets
Wednesday's weakness in the US$ and strength in commodity prices was
enough to push the Emerging Markets Equity ETF (EEM) to a new high for the
year. It's certainly possible that it won't move significantly higher
before turning back down, but the risk for anyone speculating bearishly is
the outside chance that it will surge to long-term resistance at $42-$43
before peaking.
If we had a short position in EEM or had purchased a leveraged
emerging-markets bear fund such as EEV then we would exit immediately to
mitigate the risk of loss. However, we haven't yet decided what we will do
with the EEM put options that we are holding in our own account for
insurance purposes or the EEM put-option speculation that was recently
added to the TSI List. A decision will be made before the end of the week.
We continue to suspect that an important stock-market peak will be put
in place this month, but there's no sensible reason to attempt to sell the
exact peak. Selling the peak would involve a lot more luck than good
judgment.
Gold and the Dollar
Gold
The
US$ gold price moved higher along with the prices of almost everything
else on Wednesday 15th March. Prior to Wednesday it was possible that a
rebound would be capped by resistance at $1220 (equivalent to resistance
near $116 for GLD, a chart of which is displayed below), but Wednesday's
price action paves the way for additional near-term strength.
Stepping back to see the whole picture, the overall pattern remains the
same and there has been no significant change in the fundamental
influences. We therefore expect that the rally from this week's low will
make a lower high and be followed by a decline to the December-2016 low.

Gold Stocks
In the latest Weekly Update we
wrote that the HUI could rebound as high as the low-200s within the
context of an on-going longer-term downward trend. We also wrote that
nimble traders could reasonably attempt to profit from this near-term
possibility by purchasing a gold-mining ETF and placing an initial sell
stop slightly below last week's low. If you are involved in this trade (we
aren't) you should probably switch to a trailing stop and/or take profits
if the HUI reaches its 50-day MA (202-203) within the next few days.
Considering the size of Wednesday's gain it's likely that the HUI will
move at least as high as its 50-day MA before the downward trend resumes.
Is it possible that the downward trend is over? Putting it another
way, is it possible that the low of the past week marked the end of a
correction and that a rally to well above the early-February high has
begun?
It's possible, just very unlikely given the overall
financial-market backdrop. Unless the facts change, our plan is to view
significant additional strength over the coming 1-2 weeks as an
opportunity to sell and/or put on additional hedges.
The
Currency Market
The Dollar Index fell by 1% on Wednesday
15th March. This is not a lot, but it's still a significant move for an
index of the world's major currencies. Just imagine what would have
happened if the Fed had not hiked its targeted interest rates.
In
the latest Weekly Update, we wrote:
"Despite a strong
employment report, the Dollar Index fell on Friday and failed to end the
week above 102. This means that a decline to the 200-day MA prior to a
correction low is a realistic possibility. In fact, last week's reversal
from resistance and the decline in the face of superficially bullish news
on Friday 10th March suggests that it is now an even-money bet."
We still think that a decline to the vicinity of the 200-day MA prior
to a correction low is an even-money bet. In other words, from our
perspective the 15th March price action didn't change anything.
Something to be wary of is that even though the Fed has already hiked
once in 2017 and is hinting that it expects to hike at least three times
over the course of the year, the financial markets have only discounted
two Fed rate hikes. If the stock market performs the way we think it will
over the next several months then this week's Fed rate hike might be "all
she wrote" for 2017, but that's a big if. Based on the way the US economy
and stock market are performing right now it is strange that the financial
markets aren't anticipating more rate-hiking from the Fed. This creates a
risk for US$ bears, in that if the US stock market holds up then the
currency market could be forced to hurriedly factor-in one or two
additional Fed rate hikes.
Updates on Stock Selections
Notes: 1) To review the complete list of current TSI stock selections, logon at
http://www.speculative-investor.com/new/market_logon.asp
and then click on "Stock Selections" in the menu. When at the Stock
Selections page, click on a stock's symbol to bring-up an archive of
our comments on the stock in question. 2) The Small Stock Watch List is
located at http://www.speculative-investor.com/new/smallstockwatch.html
Chart Sources
Charts appearing in today's commentary
are courtesy of:
http://stockcharts.com/index.html
http://www.barchart.com/
![]()