![]()
![]()
![]()
![]()
- Interim Update 15th July 2020
Copyright
Reminder
The commentaries that appear at TSI
may not be distributed, in full or in part, without our written permission.
In particular, please note that the posting of extracts from TSI commentaries
at other web sites or providing links to TSI commentaries at other web
sites (for example, at discussion boards) without our written permission
is prohibited.
We reserve the right to immediately
terminate the subscription of any TSI subscriber who distributes the TSI
commentaries without our written permission.
Commodities
Oil is still threatening
to break out
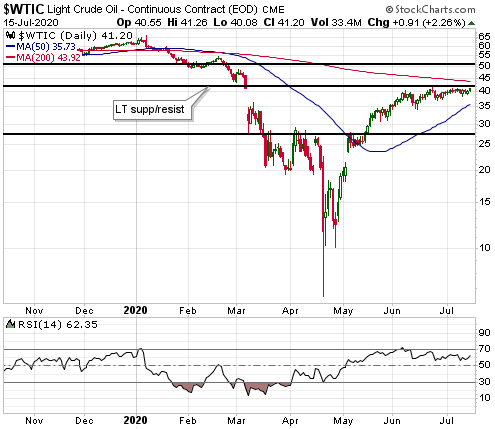
To date, the post-crash rebound high for the
S&P500 Index (SPX) occurred in early-June. Since then the SPX has 'chopped
around' within a narrow range bounded on the upper side by its early-June
high. Not coincidentally (since the markets are linked), it has been a
similar story for the oil price. As illustrated below, the oil price
essentially has traded sideways since hitting a post-crash rebound high in
early-June. Furthermore, the six weeks of sideways trading has taken place
slightly below long-term resistance/support at $42.
Despite the big rebound in the oil price from its April trough, the
following chart shows that the number of operating oil rigs in the US has
continued to shrink and made a new 10-year low last week. We've shown this
rig-count chart numerous times over the past two months, because it is an
important piece of the intermediate-term oil market puzzle.
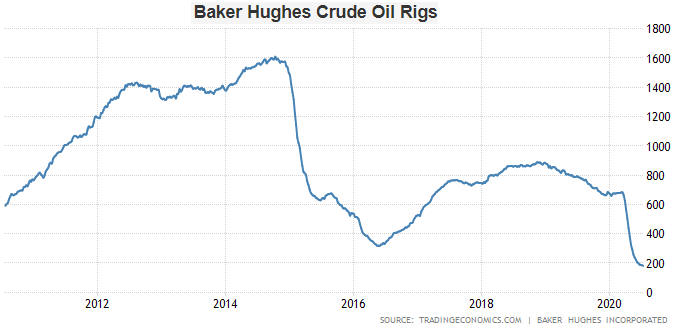
The on-going decline in the US rig count reflects the fact that even
though the oil price is a long way above where it was 2-4 months ago, it
is still too low to cover the costs of most US-based oil producers. The
implications are that the downward trend in production will continue and
that there will have to be a significant additional gain in the oil price.
We have been expecting that the "significant additional gain" would
wait until the final quarter of this year or the first half of next year
(we have written that the oil price probably will trade at least as high
as the $60s during the first half of 2021). Also, we have been expecting
that the next $5-$10 move in the oil price would be to the downside.
However, to get an oil price correction of that magnitude there probably
will have to be a decline in the SPX to well below 3000. If there isn't a
meaningful SPX correction within the next few weeks, then it's likely that
the oil price will make a sustained break above resistance at $42 a few
months sooner than expected.
The uranium correction is
complete
A week ago, we wrote: "There will be room for
uncertainty until CCJ [Cameco] makes a solid break above US$11.00, but
over the first two days of this week the probability increased that the
correction is complete. If it is complete then resistance at US$13 is a
logical short-term target."
On Wednesday 15th July CCJ made a
solid break above US$11.00. Therefore, we pronounce the correction
"complete".
If Wednesday's upside breakout is genuine then over
the next few weeks CCJ should either move directly to resistance at
US$13.00 or pull back to test this week's breakout before moving up to
resistance at US$13.00.
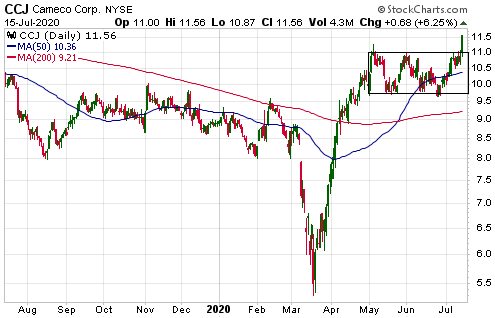
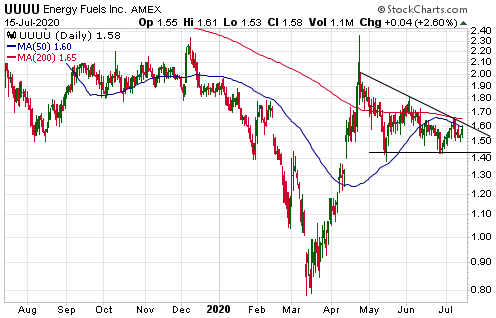
CCJ is the lead dog in the uranium mining sector, so if CCJ has
resumed its bull market then most other uranium stocks should follow. This
includes Energy Fuels (UUUU, EFR.TO), the US-based junior uranium producer
that was added to the TSI List last week. UUUU is yet to move and remains
at a reasonable level for new buying.
For UUUU, a daily close above
US$1.70 would signal the resumption of the intermediate-term bullish
trend.
T-Bond Update
The following chart shows that
the T-Bond price has drifted sideways-to-lower since peaking in March. We
suspect that the March-2020 high will prove to be the long-term variety,
but the price action leaves the door open to a final surge to a new high.
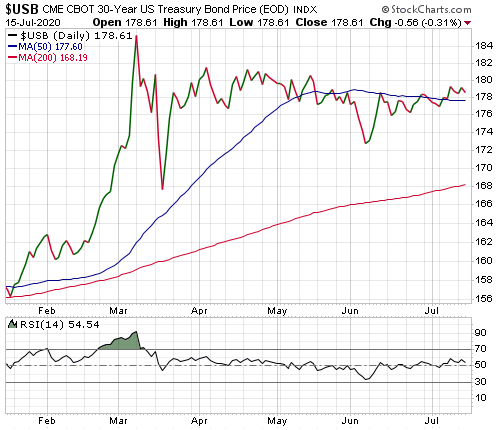
If a final surge to a new high is going to happen it will have to
happen soon. The reasons are:
1) The lockdowns did substantial
long-term damage to the goods-and-services supply side, while massive
government spending programs are preventing an equivalent fall-off in
demand. As a result, for many 'things' the monetary demand will increase
relative to the supply, leading to higher consumer prices and the
emergence of a general "inflation" problem. We doubt that the "inflation"
problem will become obvious prior to 2021, but the bond market should
begin to 'sniff out' the problem well before it becomes obvious.
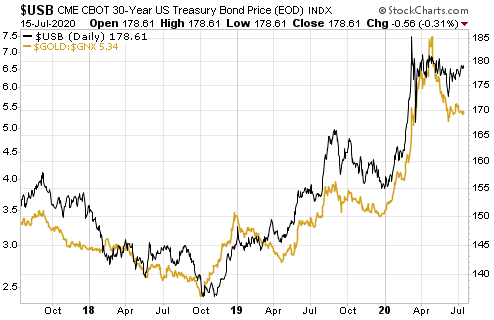
2)
The following chart shows that there is a positive correlation between the
T-Bond price and the gold/commodity ratio, with commodities represented on
the chart by GNX. It very much looks like the gold/commodity ratio made an
intermediate-term peak in April-2020, so the time is running out for the
T-Bond to make an equivalent peak if it hasn't done so already.
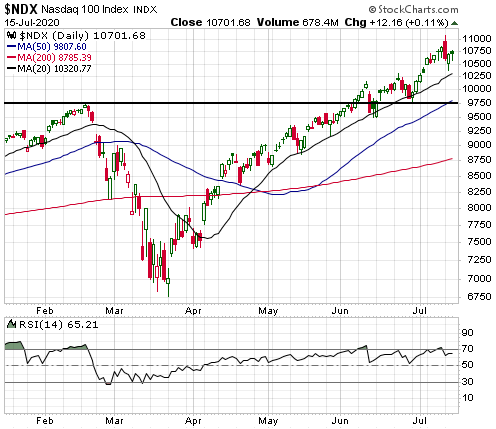
The Stock Market
The stock market was given a
boost over the past two trading days by a vaccine story. Getting a
COVID-19 vaccine is important for the economy, but even if one or more of
the companies that is trying to develop a vaccine is successful in the
near future the widespread distribution of the drug won't happen until
next year. Moreover, when it does happen the businesses and jobs that were
destroyed by the lockdowns won't magically return. Many of these business
and jobs are gone for good. This is a reality that the US stock market
will have to deal with at some point, but probably not until 2021. In the
meantime, there is an uncomfortably high risk of a sizable correction in
the 'market darlings', but not a major broad-based decline.
The
'market darlings' are represented by the NASDAQ100 Index (NDX), a daily
chart of which is displayed below. The chart shows that there was a
potentially significant reversal on Monday of this week, with the index
first surging to a new all-time high and then ending the day with a loss.
At this stage there is no evidence that anything more than a multi-day top
was set on Monday, but a daily close below the 20-day MA before the end of
this week would be evidence that at least a multi-week top is in place.
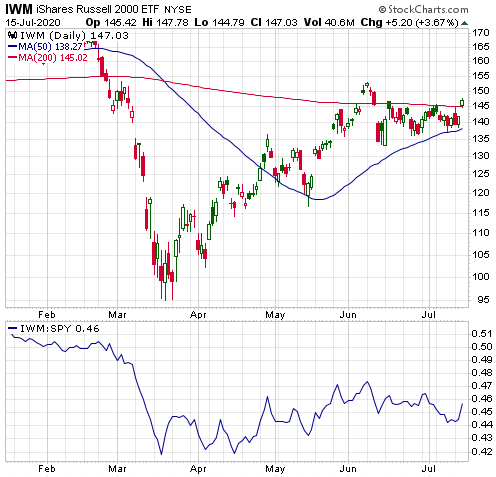
Interestingly, some of the more depressed parts of the market
benefited from the NDX's downward reversal. Two examples are shown below.
The first example is the small-cap end of the market as represented by the
Russell2000 ETF (IWM). IWM successfully tested its 50-day MA last week and
has just closed above its 200-day MA for the first time in more than one
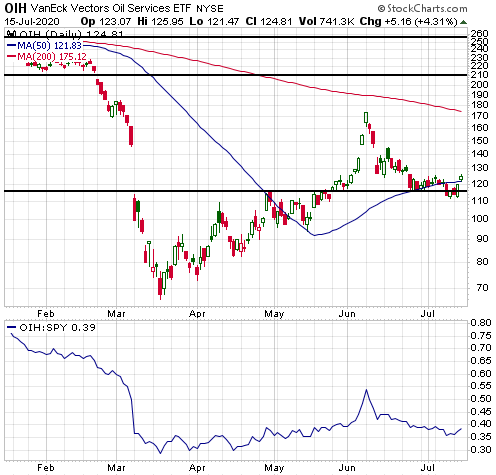
month. The second example is the oil services sector, as represented by
OIH. OIH fell by about 35% from its early-June high to last week's low,
but on Wednesday of this week it closed above its 50-day MA and at a
3-week high.
It's too soon to know, but what we've witnessed over the past three
trading days could be the start of a rotation from the recent focal points
of speculation (TSLA, AMZN, etc.) to sectors/stocks that have experienced
meaningful corrections over the past six weeks.
A rotation within
the market over the next several weeks is the most plausible bullish
alternative to the market-wide short-term correction we've been expecting.
Such an outcome would be a ramification of the hugely-disparate
performances of different parts of the market over the past month.
The upshot is that IF the NDX elevates the significance of Monday's
downward reversal by closing below its 20-day MA within the coming few
days, it will signal that either 1) a general market downturn has begun,
with the relatively strong stocks/sectors joining the relatively weak
stocks/sectors in correction mode, or 2) investment/speculative demand is
shifting from the stocks/sectors that have been relatively strong to those
that have been relatively weak. In both cases the S&P500 Index wouldn't
make much headway over the weeks ahead and in the first case the S&P500
Index probably would lose more than 10%.
The potential for an
intra-market rotation has prompted us to add a trading position to the TSI
List (refer to the "Updates on Stock Selections" section below), but this
is not a time to be aggressive from either the long side or the short
side. The market could prove challenging for both bulls and bears in the
lead-up to the election in November, with a tradable rally getting
underway after the election -- regardless of the election result -- due to
the expectation that a multi-trillion-dollar infrastructure spending
program will be approved early next year.
Gold and the Dollar
Gold
The
US$ gold price spent the past five trading days consolidating slightly
below last week's high.
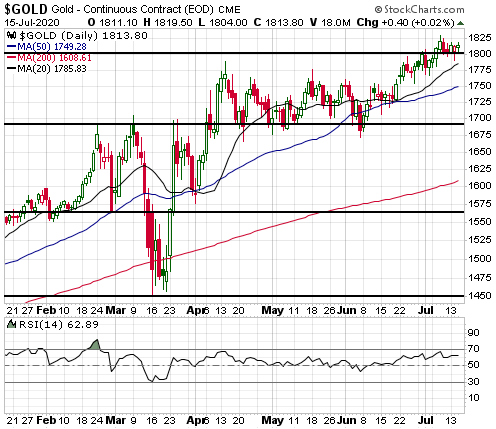
Although it would negate the recent breaks above the April high and
$1800, a pullback to the mid-$1700s would be perfectly normal at this
point and would not signal an end to the short-term upward trend. We are
not saying that we expect such a pullback, only that it could happen and
would not indicate a trend reversal. A solid weekly close below $1750
would, however, warn that a short-term trend reversal (from up to down)
had occurred.
Our view is that gold's short-term upward trend is
intact and that a multi-month top is not yet in place.
Gold
Stocks
The September Cycle
Over the past five years the gold mining sector has shown a strong
tendency to make its high or its low for the year in early-September.
Specifically, early-September ushered in the low for the year in 2015, the
high for the year in 2017, the low for the year in 2018 and the high for
the year in 2019. Moreover, the 2016 high is consistent with this cyclical
tendency if we widen the turning point window to cover the period from
early-August to early-September. In other words, the period from
early-August through to early-September ushered in the annual high or the
annual low in each of the past five years.
Using GDX as our proxy
for the gold mining sector, the vertical red lines on the following weekly
chart mark the aforementioned August-September turning points.
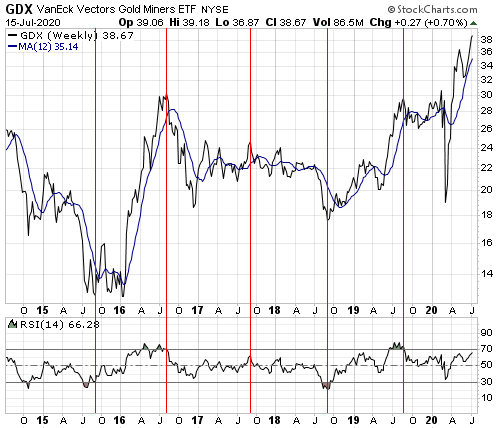
If we are going to get another August-September turning point this
year it almost certainly will be a turn from up to down.
The
cyclicality outlined above is something to be aware of IF the gold stock
indices/ETFs extend their short-term upward trends into August. Something
else to be aware of is that a minor correction over the coming 1-2 weeks,
with "minor" meaning a decline that holds at/above the 50-day MA, probably
would extend the short-term upward trend to early-September, whereas a
straight-up move from here would increase the probability of an important
turning point (from up to down) in August.
Note that even if the
August-September cycle works again this year and GDX makes its high for
the year within the next two months, in the absence of a major fundamental
shift we will continue to anticipate new multi-year highs during the first
half of 2021.
Current Market Situation
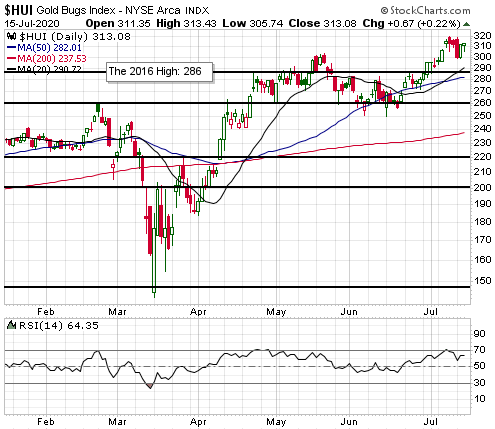
In the latest Weekly Update and last week's Interim Update we guessed
that the HUI was close to a top that would be followed by a pullback to
either the 20-day MA or the 50-day MA, after which the upward trend would
resume.
The following daily chart shows that the HUI made its most
recent peak 5-6 trading days ago, so a pullback to as low as the 50-day MA
could be underway. As mentioned above in the "September Cycle" discussion,
a correction at this point that holds at/above the 50-day MA should have
the effect of extending the short-term upward trend to early-September.
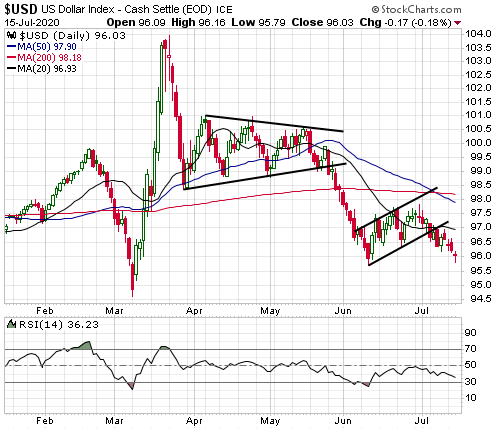
The Currency Market
The weakening trend for
the US$ that began in March-2020 probably will extend well into next year.
The drivers will be an exploding US budget deficit, massive US monetary
inflation, the combination of supply disruptions and aggressive government
efforts to prop-up demand resulting in much higher traditional "inflation"
than has been seen over the past few decades, and the US stock market
becoming a global laggard. However, it won't weaken in a straight line.
Major currency trends take a long time to get going, but once they
begin they are relentless. Confirmation that the Dollar Index (DX) has
commenced a major downward trend requires a monthly close below the
March-2020 low of 94.5, but before that happens there could be at least a
few months of choppy trading in the 94.5-98.5 range.
The DX
currently is testing its early-June low. It is not yet 'oversold' and
therefore the current decline could extend to the March low, but, as
mentioned above, we expect the March low to hold for now.
Updates on Stock Selections
Notes: 1) To review the complete list of current TSI stock selections, logon at
http://www.speculative-investor.com/new/market_logon.asp
and then click on "Stock Selections" in the menu. When at the Stock
Selections page, click on a stock's symbol to bring-up an archive of
our comments on the stock in question. 2) The Small Stock Watch List is
located at http://www.speculative-investor.com/new/smallstockwatch.html
![]() New
trading position: Enable Midstream Partners (ENBL). Recent price: US$4.38
New
trading position: Enable Midstream Partners (ENBL). Recent price: US$4.38
ENBL builds and operates natural gas (NG) processing facilities and
pipelines in the US. It is a Master Limited Partnership (MLP), which
means, in effect, that almost all pre-tax income is transferred to
unitholders in the form of distributions and only taxed at the unitholder
level.
ENBL was a successful TSI trade from around the middle of
March until it was stopped out during the first half of June. At the time
it was stopped out we wrote that we would look for an opportunity to
return it to the List. That opportunity has arrived. Although there is no
evidence that the stock has ended its correction, the pullback from the
early-June high near US$7.00 to this week's low near US$4.00 has
substantially reduced the risk.
The stock is supported by a
US$0.16525/quarter distribution, giving it a current yield of about 15%.
Furthermore, there's a good chance that the quarterly distribution will be
increased within the next 12 months, although we are not viewing ENBL as a
long-term position.
For TSI record purposes we will set a 20%
trailing stop loss on this position.

Chart Sources
Charts appearing in today's commentary
are courtesy of:
https://stockcharts.com/
https://tradingeconomics.com/
![]()