|
- Interim Update 15th August 2007
Copyright
Reminder
The commentaries that appear at TSI
may not be distributed, in full or in part, without our written permission.
In particular, please note that the posting of extracts from TSI commentaries
at other web sites or providing links to TSI commentaries at other web
sites (for example, at discussion boards) without our written permission
is prohibited.
We reserve the right to immediately
terminate the subscription of any TSI subscriber who distributes the TSI
commentaries without our written permission.
The main problem lies in the leverage
...the $500B of US sub-prime mortgage debt was simply the weakest block
in a huge debt-based pyramid with total value in the tens of trillions
of dollars.
Here is an excerpt from an article entitled "Subprime Geopolitics" posted at www.stratfor.com on 14th August:
"There currently are
three possibilities. One is that the subprime crisis is an overblown
event that will not even represent the culmination of a business cycle.
The second is that we are about to enter a normal cyclical recession.
The third, and the one that interests us, is that this crisis could
result in a fundamental shift in how the U.S. or the international
system works.
We need to benchmark the
subprime crisis against other economic crises, and the one that most
readily comes to mind is the savings and loan crisis of the 1980s. The
two are not identical, but each involved careless lending practices
that affected the economy while devastating individuals. But looking at
it in a geopolitical sense, the S&L crisis was a nonevent. It
affected nothing. Bearing in mind the difficulty of quantifying such
things because of definitions, let's look for an order of magnitude
comparison to see whether the subprime crisis is smaller or larger than
the S&L crisis before it.
Not knowing the size of
the ultimate loss after workout, we try to measure the magnitude of the
problem from the size of the asset class at risk. But we work from the
assumption that proved true in the S&L crisis: Financial
instruments collateralized against real estate, in the long run, limit
losses dramatically, although the impact on individual investors and
homeowners can be devastating. We have no idea of the final workout
numbers on subprime. That will depend on the final total of defaults,
the ability to refinance, the ability to sell the houses and the price
received. The final rectification of the subprime will be a small
fraction of the total size of the pool.
Therefore, we look at the
size of the at-risk pool, compared to the size of the economy as a
whole, to get a sense of the order of magnitude we are dealing with. In
looking at the assets involved and comparing them to the gross domestic
product (GDP), the overall size of the economy, the Federal Deposit
Insurance Corp. estimates that the total amount of assets involved in
that crisis was $519 billion. Note that these are assets in the at-risk
class, not failed loans. The size of the economy from 1986 to 1989 (the
period of greatest turmoil) was between $4.5 trillion and $5.5
trillion. So the S&L crisis involved assets of between 8 percent
and 10 percent of GDP. The final losses incurred amounted to about 3
percent of GDP, incurred over time.
The size of the total
subprime market is estimated by Reuters to be about $500 billion.
Again, this is the total asset pool, not nonperforming loans. The GDP
of the United States today is about $14 trillion. That means this
crisis represents about 3.5 percent of GDP, compared to between 9
percent and 10 percent of GDP in the S&L crisis. If history repeats
itself -- which it won't precisely -- for the subprime crisis to equal
the S&L crisis, the entire asset base would have to be written off,
and that is unlikely."
While interesting, the stratfor.com analysis misses a very important
point. The total size of the US sub-prime market may 'only' be about
$500B; however, the losses could potentially be at least an order of
magnitude greater than this due to the debt-related leverage that has
been employed. For example, in the low-interest-rate/low-credit-spread
environment of the past few years, generating good returns has
necessitated the use of substantial leverage and in many cases the
leverage has taken the form of debt. As a result, there will
undoubtedly be many hedge funds that have used one dollar of subprime
mortgage-related securities as collateral for ten or more dollars of
loans. The proceeds of these loans will then have been used to purchase
other investments.
As we understand the situation, the $500B of US sub-prime mortgage debt
was simply the weakest block in a huge debt-based pyramid with total
value in the tens of trillions of dollars. When the weakest block began
to crumble the entire structure became unstable, which is why the
senior central banks of the world have reacted so aggressively over the
past week. Obviously, if the likely worst-case were that $500B of US
subprime debt would have to be written off then the central banking
community would not have felt the need to inject almost $500B of
liquidity into the global banking system over just the past several
days.
The potential scope of the problem is enormous, but we think it's the
sort of problem that the central banks of the world will be able to
'solve' over the coming 2 months in the usual way (by creating money
'out of thin air'). This type of solution will, of course, have
longer-term adverse ramifications for the inflated currencies and will
therefore buttress our long-term bullish outlook for gold.
Quick update on the bond market
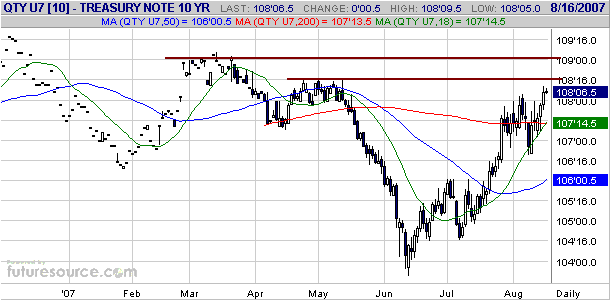
Below is a daily chart of September T-Note futures.
We suspect that the bond market will peak shortly after the stock
market bottoms, meaning that we see September-October as a likely time
for a peak in T-Note futures. However, we no longer think that the
short-term upside potential in the bond market is greater than the
short-term downside risk. Our reasons are:
1. It is taking relentless stock market weakness to maintain upward
pressure on bond prices, but a stock market rebound is likely to begin
within the next few days.
2. Commercial traders now have a substantial net-short position in T-Note futures.
3. T-Note futures are now within spitting distance of important resistance.
We are therefore changing our short-term outlook for bonds from "bullish" to "neutral".
The Stock Market
Current Market Situation
Sentiment usually follows price, so when sentiment becomes very
optimistic following a large price rise or very pessimistic following a
large price decline it tells us nothing of real value. However,
mismatches sometimes arise between sentiment and price action, and in
such cases sentiment indicators can be useful.
A mismatch currently exists between sentiment towards the US stock
market and the market's price action in that the amount of
pessimism/fear is much greater than the price action would appear to
warrant. To be specific, the S&P500 Index has only dropped by about
10% from last month's all-time high and yet this fairly normal decline
has caused extreme sentiment readings as noted below:
1. During Tuesday and Wednesday of this week the CBOE equity put/call
ratio was greater than 1, meaning that the volume of put options traded
was greater than the volume of call options traded on both days. Prior
to this week the daily equity put/call ratio had not been greater than
1 since July of 2004.
2. The 10-day moving average of the equity put/call ratio usually peaks
at 0.80-0.85 near the ends of major corrections. At Wednesday's reading
of 0.78 it hasn't reached the aforementioned range, but it is getting
close.
3. The bullish consensus reported by Market Vane just hit a 2-year low.
4. The number of NYSE-traded shares sold short by the public had
already moved well into all-time high territory prior to this week.
This week's short selling total, when reported by the NYSE in about two
weeks time, will probably reveal even higher levels.
5. The Volatility Index, a measure of the volatility implied by option
prices, ended Wednesday's trading session at its highest level since
March of 2003.
We also note, with reference to the following chart, that:
1. The percentage of S&P500 stocks trading above their 200-day
moving averages (the purple line on the chart) just reached its lowest
level since April of 2003.
2. The percentage of S&P500 stocks trading above their 50-day
moving averages (the green line on the chart) is presently as low as it
was at the end of the dramatic 5-day selling squall that followed the
September-2001 attacks by terrorists. In fact, the only time over the
past 8 years that this indicator was more oversold than it is today was
during the major bear-market capitulation of July-2002.
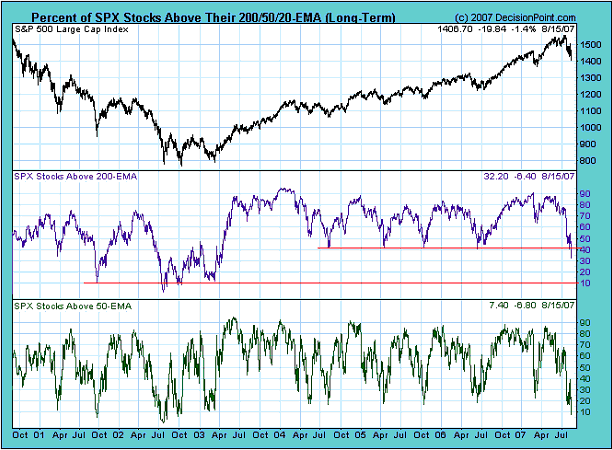
Our guess is that the
US stock market will bottom during September or October and that the
ultimate correction low won't be far below the current level.
Gold and
the Dollar
Gold Stocks
Intermediate-Term Outlook
The financial backdrop is becoming increasingly bullish for gold and
gold stocks, and yet many junior gold stocks are in free-fall and the
gold-stock indices are breaking down. While we didn't predict such a
short-term outcome it is not uncommon to see a market -- especially the
market for gold stocks since so few people understand what is and isn't
bullish for this market -- move in the opposite direction to the
fundamentals for a considerable period. For example, we noted in a TSI
commentary a few weeks ago that the gold sector trended relentlessly
lower for a few months during the second half of 2000 at the same time
as the underlying fundamentals were very bullish and becoming more so
by the day.
The current situation is that a dramatic widening of yield and credit
spreads is underway due to sharp declines in short-term interest rates
relative to long-term interest rates and sharp declines in the prices
of high-risk debt relative to low-risk debt. Also, by injecting large
amounts of newly-created money into the global financial system the
central banks are effectively reducing REAL interest rates even though
they haven't yet begun to reduce their official targets for nominal
interest rates. This interest-rate-related action is, in turn, setting
the stage for major advances in gold and gold stocks. Furthermore, gold
has begun to trend higher relative to industrial commodities, thus
putting in place the conditions that will lead to the widening of
profit margins in the gold mining industry.
At the same time and as noted in the first paragraph, the prices of most gold stocks are falling.
We therefore have the situation where the fundamentals are bullish (and
becoming increasingly so) while the price action is now decidedly
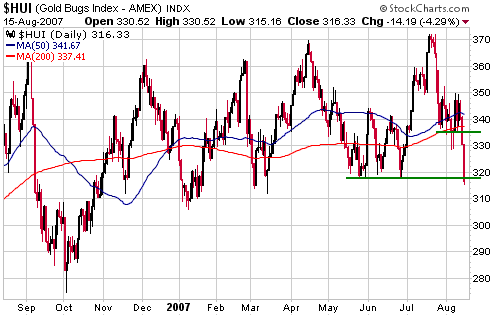
bearish. Wednesday's breach of support by the HUI could, of course,
prove to be another 'head fake', but we won't make that assumption.
On account of the bullish fundamentals and the offsetting bearish price
action we have downgraded our intermediate-term gold stock outlook from
"bullish" to "neutral".
Short-Term Outlook
Yesterday's break below support by the HUI (see chart below) suggests
that the June-2006 and October-2006 lows in the 270-280 range will be
tested within the next three months, which is exactly what we were
anticipating before the July surge in the HUI/gold ratio (discussed
below) faked us out. Ugh!
Note, though, that yesterday's break below support doesn't suggest that
lower levels will be seen in the immediate future. If the HUI continues
to decline without an intervening multi-day rebound then an important
low could eventuate as early as the first half of next week. Although
another 2-4 down-days in succession would create considerable
short-term pain for those who are substantially 'long' the gold sector,
such a wash-out would probably lead to a sustainable low and would thus
represent the more bullish of the two most likely outcomes. The
alternative is that the current phase of the decline ends immediately
and that the HUI rebounds to around 330 before returning to its
downward path.
The price action is suggesting that we should downgrade our short-term
view from "bullish" to "bearish", but the term "neutral" is a better
reflection of how we see the current situation. An extension of the
current decline that takes the HUI down to the 280s would almost
certainly take us back to a bullish stance because at that point the
short-term downside risk would, given the favourable fundamentals, be
significantly less than the upside potential. On the other hand, a
rebound over the coming 1-2 weeks that alleviated the oversold
condition would most likely shift us to a short-term bearish stance.
The financial markets
are very good at making it seem like they are about to do one thing
before doing the exact opposite. For example, it is not uncommon to see
a market breakout decisively in one direction and then quickly reverse
course.
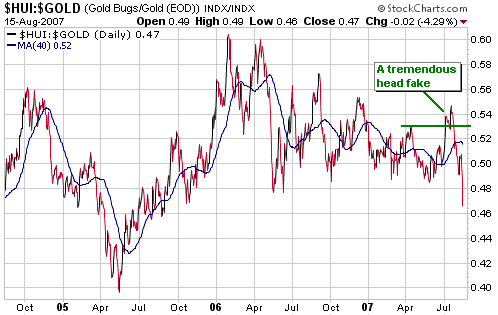
We've seen countless false breakouts in the past, which is why we
generally don't put a lot of emphasis on such occurrences. However, the
markets still manage to 'fake us out' from time to time, the most
recent example involving last month's break in a sequence of declining
tops by the HUI/gold ratio (chart included below). The bad news is that
the HUI/gold ratio reversed sharply lower after breaking out to the
upside. The good news is that the BEST buying opportunities for both
gold bullion and gold stocks occur when the HUI/gold ratio drops well
below its 40-day moving average (the blue line on the following chart),
which is ALMOST where we are right now.
Significant additional weakness in gold stocks relative to gold bullion
over the next few days would take the HUI/gold ratio to a level,
relative to its 40-day moving average, that normally only occurs near
the beginnings of major multi-month rallies. That's why a brief (2-4
day) extension of the decline would potentially be more bullish than an
immediate rebound.
Actions to take
The e-mail that we sent to subscribers after the close of trading on Tuesday contained the following comments:
"We are no less positive
on the gold sector now than we were at the end of last week, but this
week's price action does not mesh with our outlook (the price action is
a warning that we might be wrong). We haven't yet decided what, if any,
changes will be made to the TSI Stocks List, but we will be doing a
modicum of selling in our own account today (Wednesday). We hate
selling into weakness, but risk management considerations dictate that
we increase our cash position at this time. We could be selling at a
short-term bottom, but so be it.
Note that we would do
some more selling if the HUI were to close below 328 and would retreat
to our "core exposure" to gold stocks if the HUI were to close below
317."
The problem with the idea of retreating to "core exposure" now that the
HUI has closed below 317 is that panicked liquidation is currently
underway at the junior end of the market. The gold-stock indices have
fallen by less than 10% over the past two weeks, but the prices of many
junior mining stocks have collapsed in response to "get me out at any
price" selling by retail investors. As a result, any selling of the
juniors in the current environment would necessarily be done at
ultra-depressed levels. In fact, it would be done at prices that are
bound to look extremely low 18 months from now, and perhaps even 6
months from now.
It is therefore unlikely that we will significantly scale back on our
exposure to junior gold stocks at this time. Instead, most of the cash
building will be done in the more liquid positions we own.
The performance of the overall market doesn't usually give us much
cause for concern and in this regard the current situation is no
exception. This is because we can confidently predict how the story is
going to end and have seen enough in the past to realise that severe
shake-outs are part and parcel of every long-term bull market. What we
can't predict with anywhere near as much confidence is the long-term
future of any individual stock, so stock-specific negative surprises
usually bother us a lot more than general market surprises.
More JS Scare-Mongering
In addition to all the fear stemming from the general market turmoil,
the junior gold stocks have had to contend with the fear inspired by
Jim Sinclair's relentless warnings to the effect that many of these
companies -- his own company being a notable exception -- will be badly
hurt in a RISING gold price environment due to derivatives built into
the project loans taken-out by the juniors or their major
mining-company partners. JS's writings give the impression that MOST
junior gold mining companies are at risk, and many shareholders in such
companies have undoubtedly taken his words to heart and headed for the
exits without first checking if the companies they own really are
exposed to such a risk. Had they checked, by reviewing the annual
and/or quarterly reports issued by the companies, they would probably
have discovered that there was no reason to panic because, as far as we
can tell, very few companies actually face the risk Mr. Sinclair is
warning about (we don't specifically know of any, but there are almost
certainly a few that we don't know about).
To back-up his opinion that a sharp rise in the gold price will send
much of the gold sector to 'hell in a hand-basket', JS cites the recent
US$2B quarterly loss reported by Newmont Mining (NEM). The thing is,
the bulk of this huge quarterly loss was associated with the NON-CASH
write-off of US$1.7B of goodwill in preparation for the sale of the
company's merchant banking business unit. This goodwill write-off
should allow NEM to report a large one-off profit when the merchant
banking division is eventually sold and clearly has nothing to do with
derivatives. NEM also incurred a CASH cost of $500M to close out gold
forward sales contracts, which, of course, was a short-of-gold
derivative-related loss. However, this liability had been clearly
evident on NEM's balance sheet for years, so it wasn't exactly a
'skeleton in the closet'.
Very few gold mining companies will run into trouble due to a higher
gold price, but over the past few years many have run into trouble as a
result of having their profit margins squeezed due to the gold price
being too LOW. Gold has fared reasonably well relative to paper money
and most financial assets, but it has barely kept pace with the inputs
to the gold mining process (energy, steel, copper, machinery, truck
tires, labour, etc.).
In other words, the pressure on the gold mining industry and on the
prices of gold mining stocks stems from a low gold price and will be
removed by gold gaining ground relative to other commodities as well as
relative to paper money. The risk is that the gold price doesn't rise;
not that it does rise.
Gold
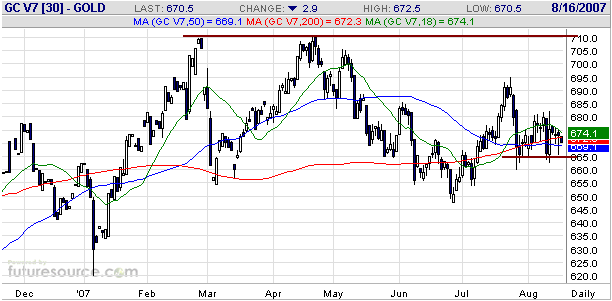
A daily chart of October gold futures is presented below.
While gold stocks were getting dumped over the past two weeks, gold
bullion hardly moved at all. However, when gold stocks diverge from
gold bullion and begin to trend strongly in one direction or the other,
the divergence is usually eliminated by gold bullion coming into line
with the stocks. This week's price action in the gold sector of the
stock market has therefore prompted us to downgrade our short- and
intermediate-term gold bullion views to "neutral".
Currency Market Update
As evidenced by the following weekly chart, this week's decline has
taken euro futures to trend-line support. More important support is,
however, defined by the June bottom (just below 1.33) because a close
below the June bottom would break a lengthy sequence of rising lows
dating back to November of 2005.
Our expectation is that euro futures, driven by the realisation that
the European currency is, at best, no better than the US currency, will
break below the aforementioned support within the next two months and
will test the November-2005 bottom during 2008. However, a rebound to
test last month's peak is a likely prospect prior to the commencement
of a large decline. If such a rebound eventuates it will probably
coincide with the temporary removal of downward pressure from the
markets that have been hit hard over the past few weeks, especially if
the euro rebounds relative to the Yen as well as the US$.

Outright Panic in the Uranium Sector
Many junior gold and base-metal stocks have been beaten-up over the
past few weeks, but almost every stock in the uranium sector has been
taken out back and shot. The uranium sector has recently provided a
good example of just how quickly manic enthusiasm can transform into
desperate fear in the stock market.
We are following two uranium stocks: Uranium One (TSX: SXR) and Energy
Fuels (TSX: EFR). In the latest Weekly Update we said that SXR had
probably bottomed last Friday when it spiked below C$10, but that we
could envisage EFR trading as low as C$1.50 at some point over the
ensuing weeks. Well, we might have been right about SXR having bottomed
but we were certainly wrong about EFR. When panicked liquidation takes
place amongst junior resource stocks, technical support and valuation
mean nothing. This indiscriminate selling creates great opportunities
for future profits, but it's important not to under-estimate just how
stupid the public can be when it stampedes for the exits. In other
words, it's important to pace yourself when buying during a sell-off.
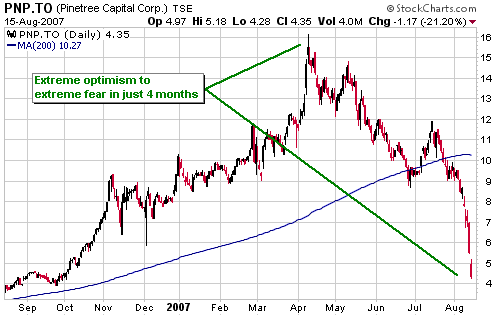
The following chart of Pinetree Capital (TSX: PNP) provides a good
illustration of the rapid transformation from irrational exuberance to
blind fear within the uranium sector. PNP invests in junior resource
companies, a significant number of which are involved with uranium
exploration/mining. Due to its focus on small companies involved in
uranium mining PNP became something of a proxy for the speculative end
of the uranium sector.
The chart shows the stock's spectacular rise from $4 to $16 and its
spectacular decline from $16 back to $4. And some people claim that the
stock market is efficient?
To give you an indication of just how manic the uranium sector was
earlier this year we note that when PNP was trading at $16 in April its
net asset value (NAV) was only around $5. That is, PNP was trading at a
200% premium to NAV earlier this year. Now, investment companies like
PNP normally trade at DISCOUNTS to NAV, meaning that PNP was at least
200% over-valued at its April high. Furthermore, the company's NAV was
at an elevated level due to the large unrealised gains in its
investment portfolio. In other words, prior to its spectacular decline
PNP was trading at a 200% premium to an artificially-elevated NAV while
similar companies outside the uranium sector were trading at
significant discounts to non-elevated NAVs.
Even at yesterday's closing price of C$4.35, PNP would still be trading
at a significant premium to NAV because its NAV would have fallen over
the past several weeks. However, the gap between the share price and
the per-share NAV would now be far more reasonable. In any case, the
waterfall decline of the past few weeks should soon lead to a vigorous
rebound.
Update
on Stock Selections
(Note: To review the complete list of current TSI stock selections, logon at http://www.speculative-investor.com/new/market_logon.asp
and then click on "Stock Selections" in the menu. When at the Stock
Selections page, click on a stock's symbol to bring-up an archive of our comments on the stock in question)
Chart Sources
Charts appearing in today's commentary
are courtesy of:
http://stockcharts.com/index.html
http://www.futuresource.com/
http://www.decisionpoint.com/

|

