![]()
![]()
![]()
![]()
- Interim Update 15th August 2018
Copyright
Reminder
The commentaries that appear at TSI
may not be distributed, in full or in part, without our written permission.
In particular, please note that the posting of extracts from TSI commentaries
at other web sites or providing links to TSI commentaries at other web
sites (for example, at discussion boards) without our written permission
is prohibited.
We reserve the right to immediately
terminate the subscription of any TSI subscriber who distributes the TSI
commentaries without our written permission.
Brief comment on oil
In the latest Weekly Update we
explained why it was time to bet against the oil price. We concluded:
"...it could make sense for speculators to take a bearish oil
position. As mentioned at the start of this discussion a better entry
point would be established by a near-term rebound to $70-$71, but if the
position is being averaged into the timing of the initial foray won't be
critical.
We caution that it is always risky to bet against oil by
purchasing a leveraged bear fund or shorting the futures. The reason is
that this is a market that can always rocket higher in reaction to 'out of
the blue' news such as a 'blow-up' in the Middle East. A protective stop
may not help in such a situation.
We will be making the bet in our
own account by purchasing USO January-2019 put options, and we possibly
will add a USO January-2019 put option to the TSI List if the oil price
rebounds to around $70 in the near future."
We have taken an
initial position (no more than half the planned full position) in the
aforementioned USO puts in our own account and are hoping that a rebound
will provide a good opportunity to add to the position. Even though the
oil price broke below its channel bottom on Wednesday 15th August (see
below) there is a decent chance that the 200-day MA, which is only $0.20
from Wednesday's low, will limit the initial decline and that the price
will rebound to near the 50-day MA (currently at $68.77) before a larger
decline gets underway.
Another potential
cobalt speculation
An interesting article about
cobalt and a particular cobalt stock was
posted at Stock Gumshoe early this week. The article delves into a
recent cobalt promotion by Casey Research -- a promotion in which cobalt
is seductively referred to as a miracle energy source called "Brandt Oil".
Here are a couple of excerpts from the above-linked article:
"..."Brandt
Oil" must be cobalt... a relatively rare metal that is used, among other
things, as a cathode in lithium-ion batteries, mostly to make them safer
(controlling oxygen production, which is a fire hazard) and more durable
while degrading relatively slowly.
There are lots of different
battery chemistries, and plenty of materials science work is being done to
make it possible to use something other than cobalt (or to use less
cobalt) in vehicle batteries, but breakthroughs appear to be fairly slow
in this space. If you want a fairly plain-language explanation of why
cobalt is important in a lithium ion battery, I found
this one pretty useful."
And:
"...Cobalt is
not a miracle fuel, but it is an essential component in modern
rechargeable batteries, and (arguably) will remain so for a long time...
and it's in relatively short supply. Most cobalt comes from nickel and
copper mines, so if nickel or copper see low prices the production of
cobalt also slumps, and almost 2/3 of the current global cobalt supply
comes from one of the countries that most multinational companies don't
particularly want to be associated with, at least in the public eye: The
Democratic Republic of the Congo (DRC).
So that's the situation,
just to catch you up -- most electric vehicle forecasters believe that we
need a much larger supply of cobalt than is currently being mined, and a
lot of production comes from a place that brings to mind the "conflict
diamonds" of Angola a decade or two ago."
Stock Gumshoe
concludes that eCobalt Solutions (ECS.TO) is the cobalt stock being teased
in the Casey promotion.
We took a cursory look at ECS late last
year and decided that it didn't offer sufficient value to warrant a
mention at TSI or the addition to our own account. We then watched with
amazement and a little annoyance as the price of this stock rapidly
doubled.
As illustrated by the chart displayed below, ECS has since
come back to earth. This and the likelihood that the stock will continue
to receive more than its fair share of newsletter promotion encouraged us
to take another look.
ECS owns the Idaho Cobalt Project (ICP), which it describes as the
only environmentally permitted, primary cobalt project in the United
States. The project is construction ready and some construction activities
have commenced, although financing for the pre-production capex is not yet
in place.
The Feasibility Study (FS) completed in September-2017
reveals that at a cobalt price of US$26.65/pound (a few percent below the
current market price) the project could be developed into a 2.4M
pounds/year underground mine with an after-tax NPV(7.5%) of US$136M and an
after-tax IRR of 21.3%. The estimated pre-production capex is US$187M.
Taking into account the financing and execution risk, for stock
valuation purposes it is appropriate to apply a 50% discount to the
above-mentioned NPV. We therefore reckon that ICP's fair value is around
US$68M at the current cobalt price.
ECS has 160M shares
outstanding and about US$20M of working capital. Adding the working
capital to the 'guesstimated' fair value for the ICP gives us a rough
valuation of US$88M, or C$116M, for the company's equity. This equates to
C$0.73/share.
Based on the above rough estimate of underlying value
we think that ECS would be a reasonable speculation at around C$0.50, or
not far below Wednesday's closing price of C$0.57. At current prices ECS
does not offer as much value as Cobalt 27 Capital (KBLT.V), but for those
who already own KBLT and are looking for additional cobalt exposure it
could make sense to buy some ECS shares near C$0.50.
The Stock Market
There was drama in the commodity
world on Wednesday 15th August, but nothing of significance happened to
the senior US stock indices.
Based on current positioning relative
to support, the NASDAQ100 (NDX) probably will be the first of the senior
US stock indices to signal a downward reversal. The signal would be a
daily close below the 50-day MA, which is slightly below both Wednesday's
low and the bottom of the channel drawn on the following chart.
Despite the recent sharp declines in some European bank stocks and all
the chatter about major banking-industry losses stemming from Turkey's
economic crisis, there is no evidence, yet, that a widespread banking
crisis is brewing.
One of the places that the evidence would appear
is in the spread between 3-month LIBOR (the short-term interest rate that
banks charge each other) and the yield on the 3-month T-Bill (the
short-term interest rate that the US government pays). When some banks
begin to worry about the financial situations of other banks, this spread
widens.
As the following chart shows, the LIBOR-UST3M spread rose
to near an 8-year high early this year. However, as we explained at the
time, this was due primarily to changes in US taxes and secondarily to a
surge in T-Bill supply. It wasn't due to declining confidence within the
banking system.
Currently, the spread is near the bottom of its
long-term range and there has been no increase in response to the recent
goings-on in Turkey.
Gold and the Dollar
Gold and Silver
The Turkey Effect
How
important will be the downward spirals in Turkey's economy and currency?
Very important, according to financial-market strategist Russell Napier in
a
recent article. He expects a near-total default on the roughly US$500B
of foreign-currency-denominated Turkish debt, with major global
ramifications.
Here are some excerpts from the afore-linked
article:
"It is the nature of EM lending that there is little
in the way of liquid assets to realize; they are predominantly denominated
in a currency different from the liability, and also title has to be
pursued through the local legal system. Turkey will almost certainly be
the largest EM default of all time, should it resort to capital controls
as your analyst expects, but it could also be the largest bankruptcy of
all time given the difficulty of its creditors in recovering any assets.
So the events of last Friday represent only the end of the beginning for
Turkey. The true nature of the scale of its default and the global impacts
of that default are very much still to come.
Strong form capital
controls produce a de facto debt moratorium, and very rapidly investors
realize just how little their credit assets are worth. A de jure debt
moratorium at the outbreak of The Great War in 1914 bankrupted almost the
entire European banking system - it was saved by mass government
intervention. While the imposition of capital controls in recent years has
hit selected investors hard, in Iceland, Cyprus, Greece and key emerging
markets, there has been nothing of this size and it is to be fully borne
by financial institutions who believe they hold not just valuable credit
assets but actually liquid credit assets! The loss of hundreds of billions
of assets recently considered liquid by global financial institutions,
through the de facto debt moratorium of capital controls, will be a huge
shock to the global financial system. This is a different type of default
and its nature, as well as its magnitude, will blindside financial
institutions."
And:
"One wonders why investors
expect President Erdogan, a man who has referred to them as like the loan
sharks who enslaved the Ottoman Empire, to choose to repay the foreigner
and accept the crushing socio-political cost on the local population of
doing so? Even if Turkish institutions have the ability to pay, something
your analyst has long doubted, the President will forbid them from doing
so. This is a large default and it will prove to be almost a total
default.
It matters and, of course, it may be politically expedient
for others to follow the advice of Paul Krugman and the IMF and choose not
to repay their debt obligations to foreigners. This is the new normal. In
a world where ten years of extreme monetary policy has failed to inflate
away debts, it will become increasingly common to repudiate those debts.
Those under the most pressure will be those with the highest levels of
foreign currency debt where inflation can play no role in reducing
increasingly crushing debt burdens - almost exclusively emerging markets."
When there's a currency and debt crisis in an emerging market it sets
off a scramble for the foreign currency in which the bulk of the debt is
denominated, which is generally the US dollar. Furthermore, if there is
fear of contagion then the scramble for dollars will be global and can be
dramatic. Therefore, a short-term effect of the crisis will be US$
strength in the FX market, regardless of what's happening in the US.
The crisis can also lead to increased demand for gold, but since none
of the debt is gold-denominated there will be less urgency to obtain gold
than to obtain dollars. Also, for there to be substantial strength in the
US$ gold price there must be declining confidence in the US economy and
financial system. Such a decline in confidence could be a knock-on effect
of a large-scale debt default centred on an emerging-market economy, but
it rarely will be the initial effect.
At the moment there is no
sign that the Turkey crisis is having a significant negative effect on
confidence in the US economy and financial system. Furthermore, as
discussed in the stock market section of today's report there is no
evidence, yet, that the Turkey crisis is having a significant negative
effect on confidence within the global banking industry. Consequently, it
is not surprising that up until now gold hasn't benefited from the crisis.
Current Market Situation
In
the latest Weekly Update we wrote that both gold and silver probably would
drop below their 19th July lows prior to tradable rallies getting
underway. Plunges to new 2018 lows occurred during the first three days of
this week.
The following daily chart shows that December gold
traded as low as $1180 on Wednesday. What's not shown is that it has since
traded as low as $1167. So, have we hit the bottom?
At this time there is no way of knowing and no solid basis for a
guess. The price could have bottomed at $1240 near the beginning of July,
but the rebound that followed the decline to $1240 failed to move quickly
above the 20-day MA (the thin black line on the above chart). This was a
sign that the short-term downward trend wasn't over. Then, the price could
have bottomed on 19th July when it traded at $1210, but again the ensuing
rebound was weak and failed to get above the 20-day MA in quick time. This
left the door wide open to new price lows.
What we have is a market
that is now very 'oversold' with the sort of sentiment that is often
associated with an important price low, but also a market that is yet to
provide any evidence that a low is in place. The first sign would be a
daily close above $1210 or the 20-day MA, whichever is lower.
Turning to the silver market, on the following daily chart we see that
there was a mini-collapse over the first three days of this week and that
the price tested its July-2017 spike low of $14.34 on Wednesday 15th
August. The market is very 'oversold' on a short-term basis and
potentially will rebound over the days ahead, but long-term support at
$13.60-$14.00 now beckons.
We didn't expect that long-term support
would be tested this year, but such a test now looks likely.
Gold Stocks
Current
Market Situation
The gold-sector capitulation that we've
been warning about at least once per week for the past several weeks is
now in progress. We couldn't be certain that it was going to happen and it
didn't have to happen prior to the start of a tradable rally, but the
set-up for such an outcome was clearly in place and, therefore, the
short-term risk was high.
Now that a capitulation has begun, it
must play out. Given that Wednesday 15th August was the first high-volume
day for GDX (the most important gold-mining ETF) in the decline that got
started in early-July (daily trading volume is shown in the middle section
of the following chart), it's unlikely that Wednesday's plunge marked the
end of the capitulation. However, given that GDX's daily RSI (refer to the
bottom section of the following chart) has fallen to only 16, it's highly
probable that the decline's momentum extreme will occur this week.
Based on what tends to happen when a sell-off generates the sort of
momentum extreme achieved by the gold-mining indices and ETFs on Wednesday
15th August, here's a likely short-term scenario for GDX:
1) A
multi-week price low within the next two weeks, probably not far below the
15th August low.
2) A sharp rebound to the 50-day MA or lateral
resistance (former support) at $21.00, whichever is the lower.
3) A
decline that tests and possibly breaches the August price low, with a
positive RSI divergence.
4) A stronger and longer rebound.
That's the most likely outcome, but there are other realistic
possibilities. One is that we get additional downward acceleration over
the next few days and then jump straight to the stronger/longer rebound
mentioned in step 4) above.
Hedging
In each of the past three Weekly Updates we mentioned that we had
hedged against the short-term risk of a speculative capitulation in the
gold-mining sector via the purchase of GDX put options. Here's what we
wrote on this topic in the 30th July Weekly Update:
"With
regard to our own accounts, over the past couple of months we have taken
some opportunities to raise cash. However, we have also done some buying
when our favourite stocks became 'too cheap'. As a result, we are not as
'cashed up' as we would like to be (we are about 30% in cash at the
moment). Due to having less cash than we would like, late last week we
purchased insurance (against a short-term gold-mining capitulation) in the
form of GDX $20 September put options. These options will quickly lose
most of their current market value if support holds and the gold-mining
sector begins to recover, but they will gain a lot of value if a near-term
breach of support leads to panicked selling of gold stocks."
The 'insurance' GDX put options mentioned less than three weeks ago have
since gained about 1,000% in value, so they proved to be a very effective
hedge. However, it didn't have to be that way, as a rebound or an
extension of the sideways drift would have resulted in these options
losing all or most of their value. If that had happened then the options
would have been like the home fire insurance that results in a small loss
every year that the house doesn't burn down.
A difference between
home fire insurance and portfolio put-option insurance is that in the
latter case you are continually being quoted a price at which the
insurance provider will buy the insurance back. You therefore have to make
a decision on when to sell and take the risk that the timing of the sale
will prove to be far from optimal.
We exited all of our gold-stock
put-option insurance during Wednesday's plunge. Except for a cash reserve
of more than 35%, we are now unhedged.
Depending on the overall
market situation at the time, we may re-establish a GDX put-option
insurance position if there is a rebound to around $21 within the next few
weeks.
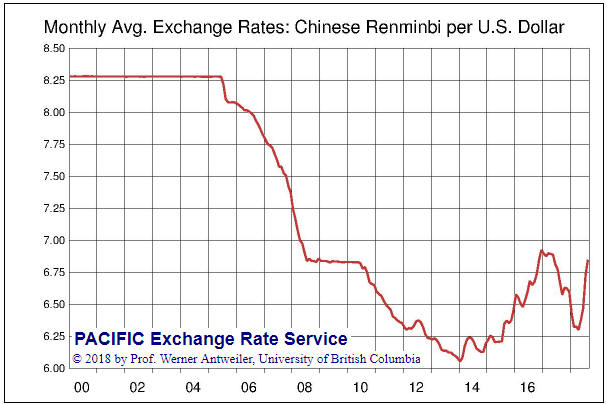
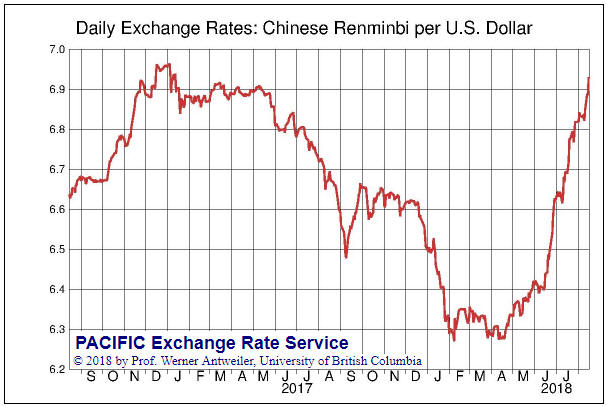
The Currency Market
Yuan Update
For the major
financial markets, the US$/Yuan rate is the world's most important
currency exchange rate at the moment. It is vastly more important than the
US$/Turkish-lira rate and even more important than the US$/euro rate. The
reason is that if the Yuan continues to depreciate against the US$ at its
current pace then US$/Yuan will break to a new 10-year high within the
next few weeks, likely leading to a frenetic sell-off in risk assets,
including equities, around the world.
Here is a long-term chart
using monthly averages of the US$/Yuan exchange rate.
And here is a daily chart covering the past two years. The daily chart
suggests that critical resistance is at 6.90-7.00. As we write, this
resistance is being tested.
The Swiss franc (SF) vs the euro
As illustrated by the following daily chart, the SF/euro exchange rate
bottomed near the end of April, broke upward from a declining channel in
mid-May and made a new 12-month high during the first half of this week.
0.91 is the short-term target implied by the chart pattern.
Relative to the US$ the SF possibly bottomed for the year in
early-May, although it is not yet known if the price action of the past
few months is a base (a reversal pattern) or a consolidation (a
continuation pattern).
Updates on Stock Selections
Notes: 1) To review the complete list of current TSI stock selections, logon at
http://www.speculative-investor.com/new/market_logon.asp
and then click on "Stock Selections" in the menu. When at the Stock
Selections page, click on a stock's symbol to bring-up an archive of
our comments on the stock in question. 2) The Small Stock Watch List is
located at http://www.speculative-investor.com/new/smallstockwatch.html
![]() A
trading position in the Physical Platinum ETF (PPLT) was added to the TSI
List on 18th July with a daily-closing stop at $795. The nearest platinum
futures price closed below $795 on Wednesday so the position has been
removed. The result was a loss of about 6%.
A
trading position in the Physical Platinum ETF (PPLT) was added to the TSI
List on 18th July with a daily-closing stop at $795. The nearest platinum
futures price closed below $795 on Wednesday so the position has been
removed. The result was a loss of about 6%.
Note that platinum came
very close to its 2008 Global Financial Crisis low in the $750s on
Wednesday before bouncing, so it may well have just bottomed. However, a
new position can always be added after more evidence of a bottom emerges.
Chart Sources
Charts appearing in today's commentary
are courtesy of:
https://stockcharts.com/
Pacific
Exchange Rate Service
![]()