|
- Interim Update 15th October 2008
Copyright
Reminder
The commentaries that appear at TSI
may not be distributed, in full or in part, without our written permission.
In particular, please note that the posting of extracts from TSI commentaries
at other web sites or providing links to TSI commentaries at other web
sites (for example, at discussion boards) without our written permission
is prohibited.
We reserve the right to immediately
terminate the subscription of any TSI subscriber who distributes the TSI
commentaries without our written permission.
Curing the symptoms while ignoring the disease
As if Paul Krugman winning the Nobel Prize in economics isn't reason
enough for us to be less-than-sanguine about the future, everywhere we
look we see well-respected analysts advocating increased government
regulation and spending -- effectively the same policies that
transformed a financial crisis into a drawn-out depression during the
1930s -- while completely ignoring the root of today's problems.
The current predicament was not caused by insufficient government
regulation and the risk of future disruptions will not be mitigated by
increased government regulation. The mortgage market was already
heavily regulated prior to the crisis, but had it been even more
regulated and had the regulations severely crimped, rather than
boosted, the abilities and desires of financial corporations to expand
the supply of mortgage-related instruments, then the focal point of the
boom would have shifted; however, bubbles would still have formed
somewhere and these bubbles would subsequently have burst, leaving
financial wreckage and major economic dislocations in their wake (the
bust is always and everywhere a consequence of the preceding boom). The
reason is that the boom was caused by the central bank fixing the price
of short-term credit at an artificially low level for a prolonged
period, thus encouraging trillions of dollars of investments and new
business ventures that should never have seen the light of day. In
effect, the central bank created an environment in which prudent
lending practices were punished and reckless lending practices were
rewarded.
With the central bank making it very cheap and easy for financial
corporations to expand the supply of money and credit,
investing/lending bubbles became inevitable. The only real question
was: where will the bubbles form? That one of the biggest bubbles
formed in the housing market set the scene for a more disastrous
outcome because so few people ever view rising property prices as
evidence of an inflation PROBLEM. Instead, a powerful upward trend in
property prices is invariably viewed by the masses and by the monetary
authorities as a sign of increasing real wealth. As a result,
policy-makers will tend to let investment booms in the property market
get further out of hand than, say, investment booms in the commodity
market. This, in turn, is one of many reasons why the price of credit
should not be set by a central planning agency.
Now that the investment boom has gone bust and the necessary adjustment
process has begun, we are being told incessantly that the solution to
the problems caused by massive increases in the supplies of money and
credit is additional massive increases in the supplies of money and
credit. And given that the private banking industry is no longer
capable of driving the monetary expansion, we are being told that the
central bank and the government must become even more involved.
The latest in a long line of policy moves designed to curtail the
necessary adjustment process is the government's plan to provide
capital directly to the banks. It seems that almost everyone is in
favour of this idea, which suggests, to us, that few people appreciate
the basic economic truth that the government has no capital. Any
capital provided by the government to the banks will first have to be
extracted from other parts of the economy via taxation or inflation or
borrowing. In other words, the government's provision of additional
capital to sick businesses can only happen at the expense of the more
healthy parts of the economy.
Whether the advocates of increased government spending and the various
other re-inflation policies realise it or not, at the root of their
proposed 'solutions' to the crisis is the idea that it is possible to
get something for nothing. It is axiomatic that an increase in
production must precede a sustained increase in consumption; that
saving is the basis of long-term economic growth; that no individual
can become rich by spending more than he earns; and that no country can
become wealthy, or recover from a recession, by consuming more than it
produces. And yet, most commentators have deluded themselves into
believing that you can get around the problem of inadequate real
savings by simply increasing the supply of the medium of exchange, and
that you can bypass the need for increased consumption to be funded by
increased production by simply getting the government to spend like a
drunken sailor.
Quick update on oil
The powerful advance in the oil price from August-2007 through to
July-2008 was more closely related to monetary factors and speculation
than to the oil market's underlying supply/demand fundamentals. It was
therefore reasonable to expect that once a correction began it wouldn't
end until the price was back in the $70s (the price level of
August-2007). The $70s is the downside target we've had in mind over
the past several months.
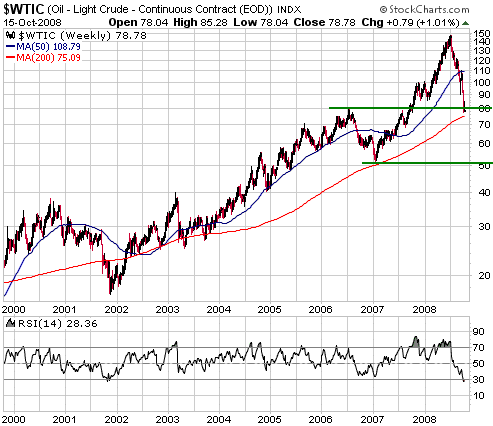
The following weekly chart shows that a 50% price decline to the $70s
has already occurred. It also shows that the oil price is now at
roughly the same level relative to its 200-week moving average (the red
line on the chart) as it was at the 2003 and January-2007
intermediate-term bottoms, and that the RSI (Relative Strength Index)
is now as low as it was at the 2001 bottom. In other words, there are
signs that an intermediate-term low is close at hand.
The oil price will probably rebound over the coming 3-6 months, but we
expect this rebound to be followed by a decline to new lows. There are
two main reasons for this: First, the demand for oil is likely to fall
further over the coming 1-2 years due to slower global growth. Second,
oil is still expensive relative to most other commodities.
Our thinking, now, is that oil's ultimate correction low will more likely be in the $50s than the $70s.
We expect oil stocks to rebound strongly with the broad stock market over the next several months.
The Stock Market
In the latest Weekly Update we wrote: "There's
a good chance that the initial rally following the bottom will be
explosive, with the S&P500 Index gaining 15-20% within the space of
two weeks. However, there's also a good chance that the bottom will be
tested before a multi-month advance gets underway."
Things are now happening at warp speed. The initial rally would
normally last about two weeks and be followed by a 2-4 week pullback to
test the low, but it seems as if weeks are being compressed into days.
For example, the S&P500 gained 24% from Friday's low to Tuesday's
high, and then fell 13% from Tuesday's high to Wednesday's low. This
amazing instability reflects the effects of forced selling and the
'stabilising' efforts of policy-makers.
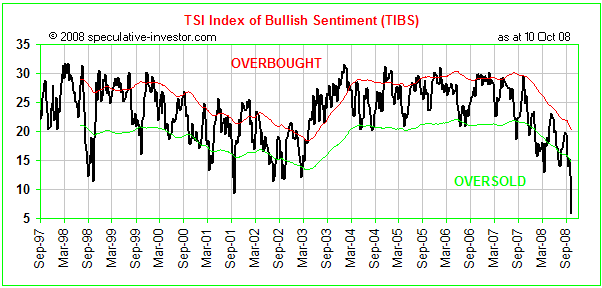
The TSI Index of Bullish Sentiment (TIBS), a chart of which is
displayed below, is a weighted average of six different short-term
sentiment indicators. Not surprisingly, TIBS has dropped to the lowest
level in its 11-year history. Note that extreme lows for TIBS reflect
extreme highs for fear.
Hope and expectations
regarding the stock market's long-term prospects are probably not close
to bottoming out, but even if the stock market's ultimate price low
lies well into the future we suspect that fear is now at, or very close
to, its ultimate peak.
In addition to the volatility and sentiment extremes currently evident
in the stock market, a blatant sign of the continuing stress in the
financial world is the relatively high level of LIBOR (the interest
rate that banks charge each other for short-term funding in the London
money market). 3-month LIBOR is presently about 4.5%, which compares to
a Fed Funds rate of 1.5% and a 3-month Treasury Bill yield of 0.2%.
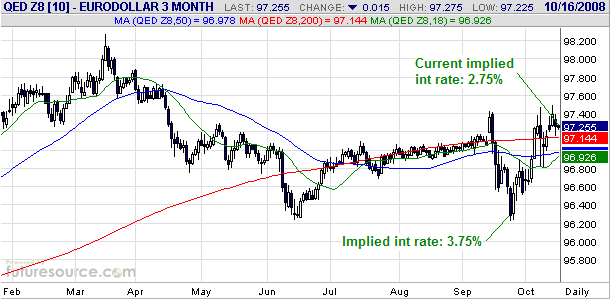
Interestingly, though, the following daily chart shows that the
interest rate implied by the December-2008 eurodollar futures contract
has FALLEN from 3.75% to 2.75% over the past three weeks (the implied
interest rate is 100 minus the futures price). In other words, the
eurodollar futures market currently expects 3-month LIBOR to be at
2.75% by December.
The eurodollar futures market confirms the common-sense notion that the
current panic will not be sustained beyond the immediate future.
Our view is that the
stock market is in the process of forming an intermediate-term bottom
that will be followed by a rally lasting about 6 months.
Gold and
the Dollar
Gold and Gold Stocks
The 1930s
There are some important similarities between the present and the
1930s. For example, we've recently discussed the similarities between
1937-1938 and 2007-2008, both with regard to the economic situation and
the performance of the US stock market. It is therefore apropos to
review how the gold sector of the stock market performed during the
1930s.
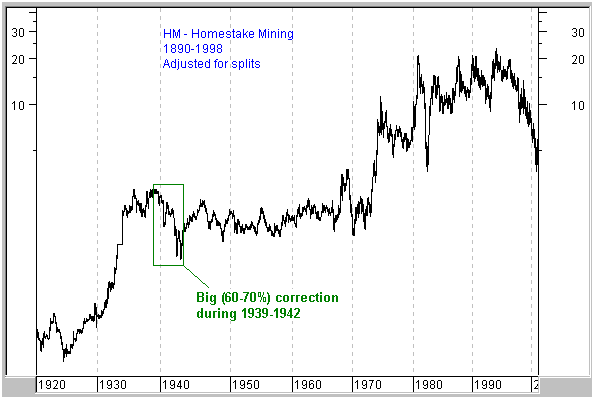
Unfortunately, we don't have much information on how gold stocks
performed during the Great Depression of the 1930s. In fact, all we
have to go on is the following long-term chart of Homestake Mining (HM)
from the excellent sharelynx.com
web site. If we make the assumption that HM's performance was
representative of the entire gold sector then this chart's message is
that the gold sector trended upward in relentless fashion until 1939.
In other words, there was nothing resembling the huge correction of
2008, or, for that matter, the huge corrections of 2002 and 2004-2005.
According to the HM chart, the largest correction of 1930-1939 occurred
during 1935-1937. This was a peak-to-trough decline of about 30% and
coincided with the final 1-2 years of the Roosevelt boom. The 1935-1937
correction was followed by a rally that peaked in mid-1939.
Interestingly, but not surprisingly for the reason mentioned below, a
large (60-70%) decline in HM's share price occurred during 1939-1942 --
in parallel with acceleration in the rates of government spending and
monetary inflation as the Roosevelt Administration provided
arms/supplies to its allies and prepared for America's entry into the
Second World War.
When the gold price
was fixed, as it was during the 1930s, gold-related investments
naturally performed well during periods of deflation or periods when
the fear of deflation was rising, and performed poorly during periods
when the fear of inflation was rising. The reason is that under the
monetary system of that era the purchasing power of gold would rise and
fall with the purchasing power of the US$. In other words, gold and the
US$ were effectively at the same end of the seesaw -- if investors
expected the dollar to lose purchasing power then they would expect
gold to lose the same amount of purchasing power provided that they
also expected the gold-US$ link to remain in place. This, we think,
explains why the stock price of HM was relentlessly strong during much
of the 1930s, with the only significant correction occurring during the
inflation-fueled boom of 1935-1937, and why it then tanked as
war-related inflation fears began to build.
Under today's (post-1971) monetary system gold and the dollar are
effectively at opposite ends of the seesaw, meaning that gold will tend
to do well when the general fear of US$ inflation is rising and poorly
when the general fear of US$ inflation is falling. It will also tend to
do well during times of financial panic, although panics are always
short-lived and in most cases such gains will be quickly given back. As
a result, we would currently NOT be intermediate-term or long-term
bullish on gold if we thought that a lengthy period of genuine
deflation lay in store.
Due to the large differences between today's monetary system and the
one that was in operation during the 1930s we don't think HM's
performance during the late 1930s can be directly applied to the
present. In particular, whereas the acceleration in monetary inflation
during 1938-1942 proved to be a major negative for HM, we think the
acceleration in monetary inflation that has recently begun will prove
to be a major positive for gold stocks over the years ahead.
Also, we no longer think that the 1970s are a useful model as far as
the gold sector's likely performance is concerned because the
differences between the current situation and the 1970s are now far
greater than the similarities. There was a 60-70% decline in the gold
sector in the middle of the 1970s bull market, but this decline
occurred in parallel with a rebound in the broad stock market.
To use a hackneyed phrase: we are in uncharted waters.
Current Market Situation
Gold bullion continues to do roughly what it should be doing given the
current financial conditions, which is trend sharply higher in terms of
most commodities, currencies and equities. We get the impression that
many gold investors are disappointed with the performance of the US$
gold price, but in this regard two things should be borne in mind:
First, almost regardless of the financial backdrop the US$ gold price
was always likely to take a hit during the initial 2-3 months of a US$
rally, simply because so many speculators had accumulated long
positions in gold as part of an anti-US$/pro-euro play. Second, it was
likely that factors other than the US dollar's exchange value would
start to dominate the gold market following the initial 2-3 months of a
US$ rally, meaning that gold would then be capable of rallying with the
US$ provided that other factors -- Federal Reserve actions, credit
spreads and the yield curve, for example -- were gold-bullish. This has
transpired, in that since bottoming on 11th September the US$ gold
price has gained more than $100 while the Dollar Index has gained 2
points.
The gold sector of the stock market is a very different story in that
it continues to perform in a way that defies rational expectations. By
this we mean that the share prices of gold mining companies continue to
trend lower even while their earnings outlooks improve at a rapid rate,
leading to a divergence of monumental proportions. The shares of oil
and base-metal producers are generally cheaper than the shares of gold
miners, but the producers of industrial commodities are facing large
declines in profit margins whereas the producers of gold are facing
large increases.
The huge divergence mentioned above is almost certainly due to the
effects of forced selling, which is, in turn, related to what's
happening throughout the stock market. People are being forced to sell
whatever they can sell with no consideration for current value or
future earnings.
If you want a reason to be optimistic, here's one: Selling pressure is climaxing during the month when bear markets tend to end.
Gold versus Silver
In many TSI commentaries over the years we've noted that silver tends
to do better than gold when confidence in the financial system is
rising and to fare poorly relative to gold during periods when
confidence is falling. This won't always mean that intermediate-term
trends in the silver/gold ratio will be the same as intermediate-term
trends in the broad US stock market, but as evidenced by the following
chart comparison of the silver/gold ratio and the S&P500 Index
that's the way it has generally worked since 1990.
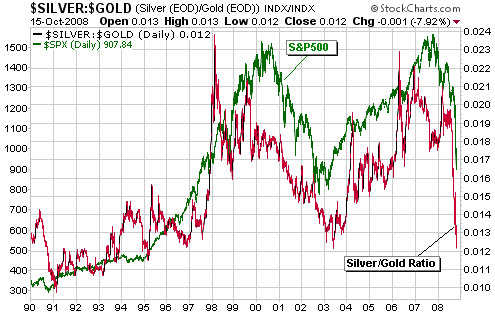
Not coincidentally,
as the stock market and confidence in the financial system plunged over
the past couple of months, so did the silver/gold ratio. As a result,
like the stock market the silver/gold ratio is now extremely oversold.
If the stock market rebounds over the coming 6 months then so should
the silver/gold ratio; that is, silver should soon begin to trend
upward relative to gold.
Update
on Stock Selections
(Note: To review the complete list of current TSI stock selections, logon at http://www.speculative-investor.com/new/market_logon.asp
and then click on "Stock Selections" in the menu. When at the Stock
Selections page, click on a stock's symbol to bring-up an archive of our comments on the stock in question)
 Lion Selection (ASX: LST). Shares: 190M issued, 196M fully diluted. Recent price: A$1.30 Lion Selection (ASX: LST). Shares: 190M issued, 196M fully diluted. Recent price: A$1.30
In the latest Weekly Update we explained why we didn't agree with the
decision of LST's management to return money to shareholders via an
off-market buy-back, our preference being that the money be returned
via a simple cash distribution. However, if the off-market buy-back
option is approved at the 31st October shareholders meeting it will be
important to participate in this buy-back to the fullest extent
possible. We'll explain why using a hypothetical example. Let's say
that: a) you own 100,000 shares of LST, b) the buy-back price is set at
A$1.70, c) the market price at the time of the buy-back is A$1.40, and
d) the company ends up buying back 50% of the shares submitted to it
under the offer. In this case, participation in the buy-back would
result in 50,000 of your shares being purchased by the company at
A$1.70/share. If you wished to do so you could then go back into the
market and replace, at a cost $70,000 ($1.40/share), the shares just
sold to the company for $85,000 ($1.70/share). Alternatively, you could
decide to use the cash liberated by the LST sale to purchase gold
shares that now offer better value than LST.
Chart Sources
Charts appearing in today's commentary
are courtesy of:
http://stockcharts.com/index.html
http://www.futuresource.com/

|
