![]()
![]()
![]()
![]()
- Interim Update 15th November 2017
Copyright
Reminder
The commentaries that appear at TSI
may not be distributed, in full or in part, without our written permission.
In particular, please note that the posting of extracts from TSI commentaries
at other web sites or providing links to TSI commentaries at other web
sites (for example, at discussion boards) without our written permission
is prohibited.
We reserve the right to immediately
terminate the subscription of any TSI subscriber who distributes the TSI
commentaries without our written permission.
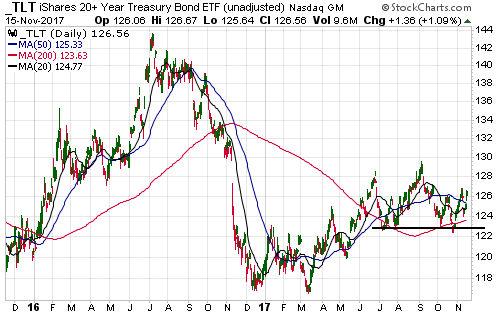
The T-Bond extends its
rebound
A week ago we wrote:
"The
iShares 20+ Year Treasury Fund (TLT) tested important support near $123 in
late-October and has since rebounded. We suspect that this rebound is
forming the 'right shoulder' of a 'head and shoulders' topping pattern. If
so, the rebound should end at or below $128.
Although the rebound
is probably almost complete in terms of price, we won't be surprised if it
takes TLT a few weeks to roll over into its next downward trend."
TLT subsequently pulled back and then returned to last week's high. As
a result, it is roughly unchanged over the past week. However, there's now
a higher probability of a rise to $128 prior to a rebound peak.
Quote of the Week
On Wednesday of this week
Chicago Fed President Charles Evans said things that rival the stupidest
statements ever made by a senior central banker. As outlined in the
Bloomberg article posted
HERE, Evans expressed concerns Wednesday that the public was losing
faith in policy makers' commitment to bring inflation back up to their 2
percent target. In particular, he said: "I...worry that giving too
much prominence to financial stability considerations in discussions of
monetary policy could erode the public's confidence in our commitment to
our 2 percent inflation objective."
Is even a single member of
the US public worried that the Fed will not be able to cause enough
"inflation"? To put it another way, is there anyone out there who is
worried that their cost of living is not increasing fast enough?
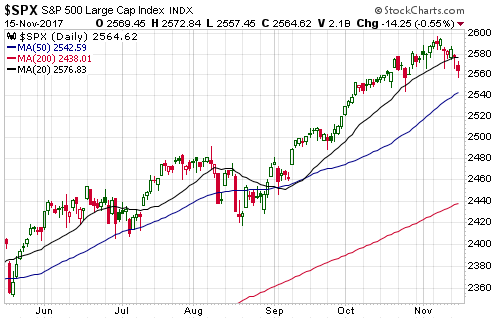
The Stock Market
Over the past three weeks we've
been anticipating the start of a correction in the US stock market. Based
on historical performance following the sort of upside momentum extreme
achieved during the second half of October the most likely outcome was a
routine 1-3 month pullback or sideways consolidation followed by another
surge to new highs. However, the historical record also indicated the
possibility -- with a less than 20% probability -- that a crash pattern
would develop once a short-term high was in place. Note that if a crash
pattern were to develop then early next year would be the most likely time
for the actual crash.
The correction appears to have begun. The
evidence is that on Wednesday 15th November the SPX closed below its
20-day MA (the black line on the following chart) for the first time since
late-August.
If a meaningful downward correction has, indeed,
begun, then the 20-day MA should act as resistance during any attempted
rebounds over the coming few days.
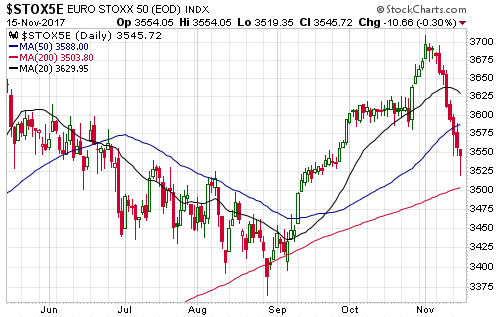
The EURO STOXX 50 Index (STOX5E), the European equivalent of the Dow
Industrials Index, has just dropped for 8 days in a row and suffered a
quick peak-to-trough decline of about 5%. There's a good chance of a
rebound over the next few days, but it's likely that the 2017 peak is in
place and that a 1-3 month (or longer) correction is underway.
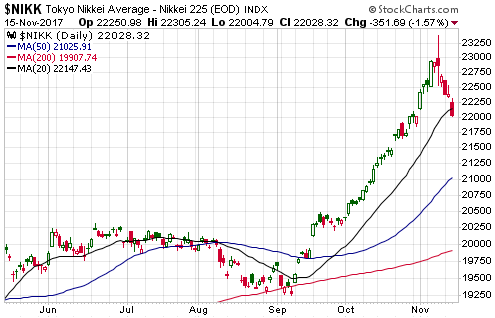
Over the past few days Japan's Nikkei225 Index also signaled that it
has entered correction mode and has most likely topped for the year. We
expect the Nikkei to do no worse than drop to around 21,000 to test its
long-term upside breakout before resuming its bullish trend.
Gold and the Dollar
Gold
Due
to a federal holiday the COT numbers for last week weren't published until
Monday of this week. We covered these numbers for gold, silver, the C$ and
the Yen in a
blog post on Tuesday, although there was no significant change. In
particular, the COT numbers for gold and silver suggest that the flushing
out of leveraged speculators that usually precedes a strong rally has not
yet happened. This is currently our biggest concern about gold's
short-term prospects.
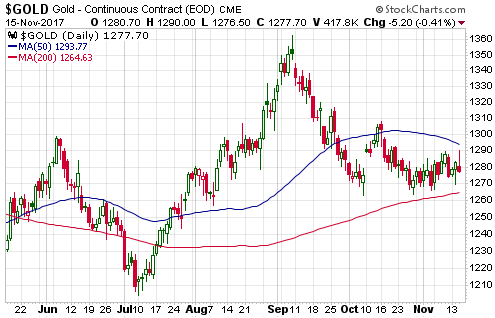
On Wednesday 15th November the gold price
initially gained about $8 to $1290 before reversing course and ending the
day with a $5 loss. This could be viewed as slightly bearish price action,
although such intra-day reversals are unreliable indicators of the future.
For example, the opposite happened a day earlier and it meant nothing.
All we can really say about Wednesday's price action is that it
continued the pattern of the past three weeks. More specifically, over the
past 14 trading days the US$ gold price has drifted in a narrow range with
a slight upward bias. This pattern leaves open the possibility of a spike
below support near $1260 prior to a short-term bottom.
Gold Stocks
Current
Market Situation
The HUI tested its 3rd November intra-day
low on Tuesday of this week without closing below it. Consequently, the
possibility remains that a 2-month cycle low was put in place almost two
weeks ago.
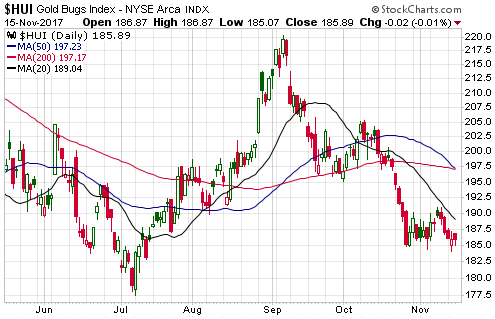
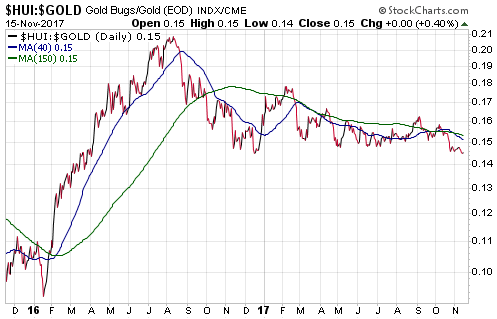
However, there have been no signs of strength since the 3rd November
low. On the contrary, the HUI/gold ratio made a new low for the year on
Tuesday of this week and is now testing its December-2016 low.
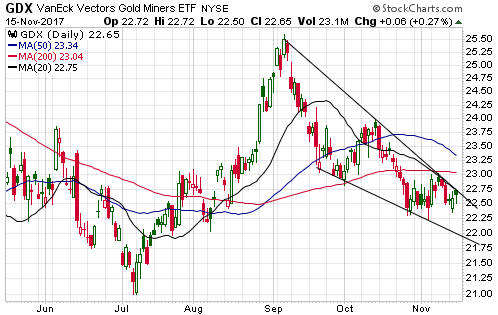
GDX (the Gold Miners ETF) is positioned to be the first gold-mining
ETF or index to signal an upward reversal. This is firstly because GDX has
been relatively strong of late and secondly because nearby resistance is
defined more clearly for GDX than for any of the other important
gold-mining ETFs/indices.
GDX could generate a definitive signal of
an upward reversal by closing above its 200-day MA (the red line on the
following chart, presently at $23.04), which is only 1.7% above the
current price. Also, it would take only a daily close above $22.75 to
generate a preliminary warning of an upward reversal. The reason is that a
daily close above $22.75 would break GDX above its 20-day MA and the top
of the downward-sloping 'wedge' in which it has traded since the
early-September peak.
On the downside, the support levels that
could come into play if the 3rd November low is breached are the bottom of
the 'wedge' at around $21.90 and the July low at $21.00.
Eldorado Gold (EGO) and the boom-bust cycle
EGO is a mid-tier gold producer with current production of around 300K
ounces/year. Its balance sheet is in reasonable shape, with $593M of
long-term debt more than offset by $700M of working capital. It also has
undrawn credit of $250M, so the company will not run short of cash anytime
soon. However, with the stock having lost about two-thirds of its value
over the past 6 months and about 95% of its value over the past 6 years
(the stock price peaked near $22 in 2011) the shares are trading as if the
company is on its way to bankruptcy. Is it a bargain and therefore worth a
punt near its current price?
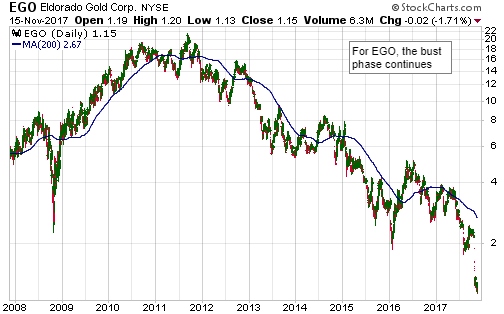
Sorry, we don't know. It isn't an obvious bargain, because the market
is still assigning it a sizable enterprise value of around US$700M. If it
were an obvious bargain it would be trading near cash value, meaning that
new buyers would be effectively getting the mining assets for free.
US$700M, however, is not unusually cheap in the current market for a
300K-oz/year gold producer. To know whether it is a bargain we would
therefore have to spend considerable time assessing the values of the
company's various assets and quantifying the risks it faces, which we
aren't inclined to do.
Since it isn't an obvious bargain we aren't
interested in buying it, but we wanted to highlight it as an excellent
example of wealth destruction stemming from the boom-bust cycle in the
mining sector. An exploration-stage junior could potentially lose 95% of
its value due solely to negative stock-market sentiment, but a mid-tier
producer losing 95% of its value requires some major strategic errors by
the company's management. In the inflation-fueled boom-bust cycle, the bad
investments are made during the boom phase in response to misleading price
signals (price signals that make the future seem much brighter than is
actually the case) and exposed for what they are during the ensuing bust
phase.
The gold-mining sector tends to suffer the wealth
destruction wrought by the boom-bust cycle to a greater extent than any
other part of the economy. It's just that the gold-mining cycle tends to
be 180-degrees out of phase with the cycle of the broad economy, meaning
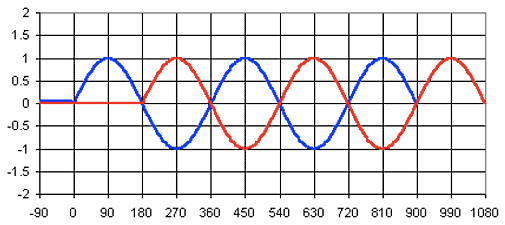
that peaks in one coincide with troughs in the other, and vice versa. Here
is a picture of two waves that are 180-degrees out of phase.
For most gold-mining companies the 'troughing' part of the cycle began
in 2015, but for some, including EGO, the declining/bust phase hasn't yet
ended.
The Currency Market
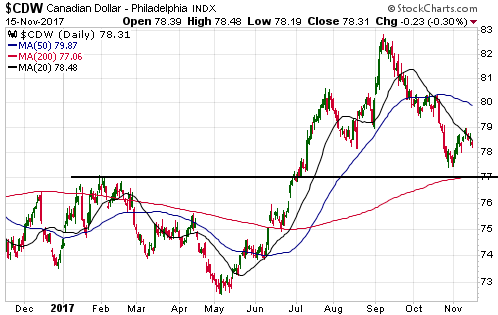
The Canadian
dollar (C$) made a multi-week bottom in late-October. It is currently in
the midst of a rebound that could extend as far as 80, but there's a good
chance that it hasn't completed its downward correction. The main reason
is sentiment, as indicated by the COT data. As is the case with the gold
and silver markets, up until now the C$'s decline from its early-September
peak hasn't prompted enough bullish speculators to 'throw in the towel'.
The C$ has both lateral support and moving-average support at 77,
which is only half a point below the late-October low. This support could
limit the downside, but a final bottom at 75-76 now looks more likely.
Updates on Stock Selections
Notes: 1) To review the complete list of current TSI stock selections, logon at
http://www.speculative-investor.com/new/market_logon.asp
and then click on "Stock Selections" in the menu. When at the Stock
Selections page, click on a stock's symbol to bring-up an archive of
our comments on the stock in question. 2) The Small Stock Watch List is
located at http://www.speculative-investor.com/new/smallstockwatch.html
![]() Updates
to the TSI Small Stocks Watch List (SSWL)
Updates
to the TSI Small Stocks Watch List (SSWL)
The SSWL is a
list of stocks that are too risky and/or illiquid to be considered for the
TSI Stocks List. We don't track these stocks closely in the TSI
commentaries, but they have favourable risk/reward ratios (high risk
versus much higher potential reward) and could be of interest to
speculators who are able to do their own due diligence. Brief updates on
the progress of two members of this list were included in our latest
weekly report. Here are updates on two others:
1) Cassini
Resources (CZI.AX). Shares: 277M. Recent price: A$0.075. Cash: about A$3M
(including upcoming $1.9M payment from OZL). Current enterprise value:
about A$18M
CZI's flagship asset is the West Musgrave
Project (WMP) in Western Australia, a project that contains a large,
low-grade nickel-copper resource. The WMP is a JV between CZI and Oz
Minerals (OZL.AX), a mid-tier copper producer. OZL can earn up to 70% of
the project by spending A$36M in stages and advancing the project to the
point where there is a completed FS.
On Tuesday of this week CZI
reported the results of a Scoping Study (that is, a PEA) for the WMP. The
Scoping Study (SS) was done by OZL as part of its earn-in obligations.
The SS is based on the development of a mine with average annual
production of 44M-55M pounds of nickel plus 55M-66M pounds of copper plus
1.5M-2.2M pounds of cobalt over an initial mine life of 8 years. The
pre-production capex is estimated to be A$730M-$800M.
The headline
economics indicated in the SS look good. In particular, the post-tax IRR
is estimated to be 20%-25%. These headline numbers prompted a flurry of
buying in the immediate aftermath of the news and pushed CZI's stock price
up 25% to A$0.125, but when a closer look was taken at the SS details it
became apparent that the robust IRR was based on very aggressive
assumptions and the stock sold off.
The 20%-25% IRR was calculated
assuming a copper price of US$2.95/pound, a nickel price of US$7.13/pound
and an A$/US$ rate of 0.74. The copper price assumption is justifiable
given that the current price is around US$3.00, but the nickel price
assumption is unreasonably high given that the price is currently around
US$5.20 and hasn't been above $7.00 since 2014. Also, the assumed A$/US$
rate is unreasonably low given that the current rate is around 0.76 (the
lower the assumed A$/US$ rate, the better the economics will appear to
be).
Unfortunately, CZI hasn't yet provided information on what
the economics would be under more conservative/realistic price
assumptions, but we suspect that the project would look economically
marginal at today's metal prices and exchange rate.
That's the bad
news. The good news is that OZL has committed to continue with its
earn-in. The larger company could have 'pulled the plug' having spent only
A$3M, but it has opted to spend another $19M over the next 18 months to
boost its stake in the WMP to 51%. It wouldn't be doing this if it didn't
believe that the WMP could be developed into a profitable mining
operation.
Given that the forecast production costs are low (bottom
1/3 for nickel and bottom 1/4 for copper), the marginal-economics problem
is most likely caused by the pre-production capex being too high relative
to the mine size or mine life. It may be possible to resolve this problem
by expanding the mineable resource.
The bottom line is that CZI is
still an interesting speculation. The keys are that its market cap is very
low and that it is being free-carried by OZL to the point where a decision
is made to build a mine.
2) Emmerson Resources (ERM.AX).
Shares: 402M. Recent price: A$0.081. Cash: about A$5M. Current enterprise
value: about A$27M
ERM's flagship asset is the Tenant
Creek Mineral Field (TCMF) in Australia's Northern Territory. The TCMF is
being explored/developed as part of a JV with Evolution Mining (EVN.AX), a
mid-tier gold producer and a member of the TSI Stocks List.
At the
end of next month (December-2017) EVN will have earned 65% of the TCMF by
spending A$15M and will have to make a decision to either remain at 65% or
increase its stake to 75% by sole funding an additional A$10M of work by
December-2019. EVN could also opt to make a takeover bid for ERM and thus
gain 100% ownership of the TCMF.
Our speculation has been that EVN
would make a takeover bid for ERM rather than pay $10M to obtain an
additional 10% of the TCMF, but up until now there probably hasn't been a
discovery of sufficient magnitude at the TCMF to interest a company of
EVN's size. The odds are therefore against a takeover happening in the
near future, but ERM should have positive news flow over the next several
months due to the start of small-scale mining and a new drilling program
at the TCMF, as well as a drilling program at a prospect that the company
owns in NSW.
Chart Sources
Charts appearing in today's commentary
are courtesy of:
http://stockcharts.com/index.html
![]()