|
- 16 January, 2002
The Strong
Dollar
By the second quarter of 1995 the US
Dollar Index had fallen by around 50% from its 1985 peak. It then reversed
course and began moving higher, establishing an up-trend that continues
to this day.
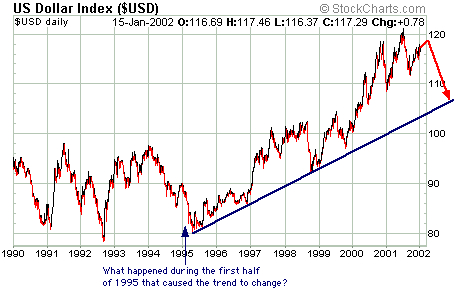
Below is a chart of the Dollar Index
showing the major upward trend that has been in place since 1995 and also
our projection as outlined in previous commentaries (we expect the Dollar
to remain firm during the first quarter of this year and to decline sharply
thereafter). What happened during the first half of 1995 that led to such
a pronounced trend change?
In our view, one significant reason
for the Dollar's reversal of fortune is the change in US policy towards
the Dollar that occurred in 1995. In January of 1995 Robert Rubin was made
Secretary of the Treasury and thus became the primary architect and spokesman
for the US Government's Dollar policy. Rubin introduced an official "Strong
Dollar Policy" that superceded the unofficial "weak Dollar policy" that
had been in effect since the 1970s.
Prior to 1995 the US had often sought
a weaker Dollar in order to offset the declining competitiveness of goods
manufactured in the US versus goods manufactured overseas (primarily Japan).
Dollar policy, to the extent that it existed, was therefore designed to
cover-up a weakness (the inability to compete with foreign-based manufacturers).
From 1995 onwards, however, Dollar policy was designed to focus on the
strengths of the US - areas where the US had a competitive advantage. These
competitive advantages included a) having the authority to print the world's
reserve currency (the currency in which all commodities are priced and
in which more than 50% of international trade is transacted), b) having
a central bank prepared to guarantee unlimited liquidity, c) having a population
that is predisposed towards consuming rather than saving (this can be a
strength or a weakness depending on the circumstances), d) having deep
and relatively-unregulated financial markets, and e) having effective control
of the International Monetary Fund. Note that when we refer to the US financial
markets as being "deep" we mean that a lot of alternatives are provided
and the markets are big-enough/liquid-enough to handle very large bets.
For example, when the market for US Government bonds became insufficient
to satisfy the foreign demand for 'riskless' US securities, the Government
Sponsored Enterprises (Fannie Mae, etc.) stepped up to the plate (see http://biz.yahoo.com/rf/020116/n15280498_2.html
for an example of what we are talking about).
Once the Dollar's upward trend became
widely-recognised it also became self-reinforcing. For example, a strengthening
Dollar made US assets and debt more attractive to foreign investors. Furthermore,
with the Dollar seemingly in an unstoppable up-trend it made sense for
US corporations to take advantage of lower interest rates in Japan and
Europe by doing a large portion of their borrowing overseas (when a US
corporation takes out some form of foreign currency loan and then converts
the proceeds to US Dollars, it is effectively 'shorting' the foreign currency
against the Dollar). With the US Dollar's foreign exchange value trending
higher, the loan amount in US Dollar terms would be expected to drop by
the time repayment came due.
Another reason for the Dollar's continuing
up-trend - one that has increased in importance over the past few years
- is the drive by export-oriented nations to boost the amount of product
they can sell into the lucrative US market by devaluing their currencies
against the Dollar. For example, over the past several months we've seen
the Japanese monetary authorities doing whatever was needed to be done
in order to dramatically weaken the Yen. The plan, we assume, is to allow
the Japanese economy to export its way out of recession. If the Yen continues
to decline then other exporters to the US will act to devalue their own
currencies to avoid losing market share to the Japanese. This process of
competitive devaluation probably constitutes the biggest risk to our medium-term
bearish view on the Dollar.
So, with the Dollar having been particularly
strong over the past 4 months and the long-term up-trend in no immediate
danger of being broken, why do we expect the Dollar to plunge later this
year? Here are the main reasons:
1. By the middle of this year some
of the effects of last year's massive increase in Dollar supply will become
clear, sparking fears of inflation. The Fed is likely to hold short-term
interest rates at very low levels for at least the next 6 months, so evidence
of a growing inflation problem could have a pronounced effect on the perceived
real returns on US investments (foreign investors would be forced to factor
in a higher inflation rate and, hence, lower real returns). Alternatively,
if the Fed does raise short-term interest rates to keep real returns constant
in the face of a growing inflation problem it runs the risk of cutting-short
the economic recovery. Either way, the emergence of inflationary pressures
(something we expect) in the US would dampen the enthusiasm of foreigners
for US-based investments.
2. Even if the US economy recovers,
the unemployment rate will almost certainly continue to rise over the coming
6-12 months. It is going to be very difficult for the current US administration
to remain committed to the "Strong Dollar Policy" when the US jobless rate
is increasing and when the consensus is that an excessively strong Dollar
is partly to blame for the job losses. Political expediency is likely to
overwhelm the commitment to a strong Dollar.
3. The US$ is the largest "Ponzi scheme"
ever attempted, meaning that it can continue its rise and provide profits
to earlier investors for only as long as new investment can be drawn-in
at an ever-increasing rate. With neither US stocks nor US bonds likely
to provide positive returns this year, the ability to attract new investment
at an ever-increasing rate is questionable to say the least.
4. The long-term chart shown above
suggests that a topping process is occurring that should lead, as a minimum,
to a test of the long-term up-trend. Note that the Dollar Index tested
its long-term up-trend during the final quarters of 1996 and 1998. If this
2-year cycle had continued then another test would have occurred during
the final quarter of 2000. However, rather than a low the Dollar appears
to have made a major high in the final quarter of 2000 (the Dollar Index
went on to exceed its 2000 peak in July of 2001, but the Dollar's peak
versus the euro and the SF occurred in October of 2000). A cycle inversion
(a high where a low would normally be expected, or vice versa) often occurs
at a major turning point. Our view is that the Dollar's post-1995 up-trend
has been topping for the past 2 years, a view that is supported by the
price action as reflected in the above chart.
5. In the past we've used a Cisco analogy
to describe the Dollar's valuation problem. Cisco was a great company in
March of 2000 and still is today, but it is now trading almost 80% below
its March 2000 peak. The Dollar could remain 'king of the fiat currencies'
and still experience a substantial decline due to a removal of the enormous
premium it currently enjoys.
Our target for the Dollar Index this
year is 105 (10-15% below the current level), which would represent a fall
to the long-term up-trend. This target will probably turn out to be overly
bullish since a widespread change in perception regarding the Dollar's
trend would dramatically slow the rate at which investment capital flowed
into the US. As previously discussed, we expect the Dollar to remain firm
during the first quarter primarily because the Yen appears to be headed
lower.
The US
Stock Market
What does the start of a new bull
market look like?
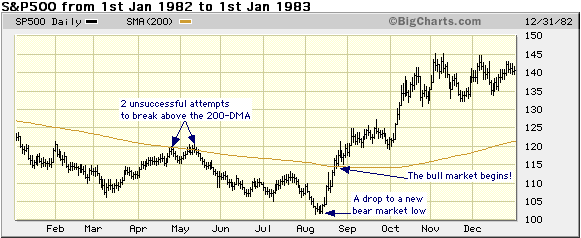
Below is a chart showing the performance
of the S&P500 Index during 1982 (the orange line on the chart is the
S&P500's 200-day moving-average). The S&P500 made 2 unsuccessful
attempts to break above its 200-day moving-average during the first half
of 1982, but a decisive move above the 200-DMA in August signaled the start
of a new bull market.
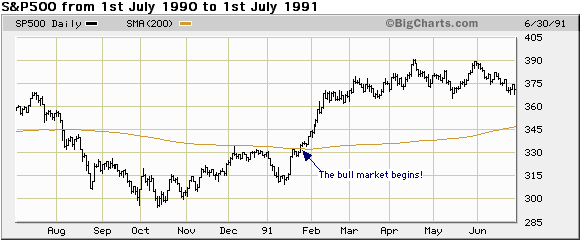
Below is a chart showing the S&P500
from mid-1990 to mid-1991. The break of the 200-DMA in early-1991 signaled
the start of a new bull market.
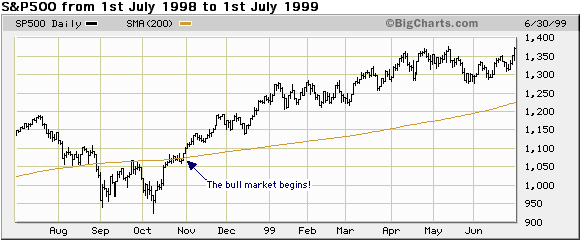
Below is a chart showing the S&P500
from mid-1998 to mid-1999. The break of the 200-DMA in October of 1998
signaled the start of a new bull market.
In the early stages of a new bull market
the S&P500 Index typically moves above its 200-DMA and keeps going.
For example, in the 3 cases illustrated above the market rallied an additional
20-30% during the 3 month period immediately following the break above
the 200-DMA.
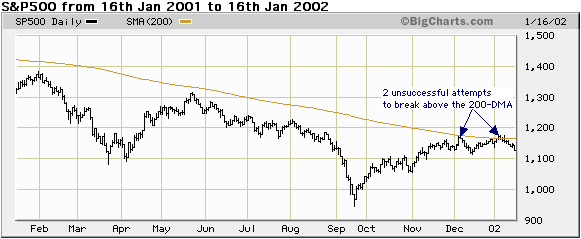
The following chart shows the current
situation. The S&P500 broke above its 200-DMA earlier this month, but
there was no follow-through. This chart doesn't invalidate the popular
idea that a new bull market began in September of last year, but it does
mean that one important piece of the technical puzzle is yet to fall into
place. After the current pullback runs its course the market could surge
well above its 200-DMA, thus providing technical confirmation of a bull
market. However, something akin to the April-August 1982 experience (a
drop to a new bear market low prior to the start of a bull market) seems
more likely.
Current Market Situation
The stock market pullback is continuing
as expected and is probably not yet complete, although we expect it to
end during the coming 2-3 sessions.
Over the past few weeks we've warned
that the stock market was close to a short-term peak, but argued that the
ultimate peak of this post-September recovery wouldn't be seen until March-May.
Our reason for expecting further upside was that the level of fear, as
measured by short-term sentiment indicators such as put/call ratios, was
ramping-up substantially every time the market dipped for a couple of days.
The consensus view of the market's medium-term prospects appears to be
very bullish, but there also seems to be a great deal of nervousness regarding
the short-term. As such, traders have been very quick to panic or, at least,
to take a bearish short-term stance. We doubt that a normal pullback will
turn into a major decline with so many traders trying to anticipate a major
decline.
The current predisposition of 'the
herd' to panic at the first sign of trouble has been evident during this
latest pullback. The equity put/call ratio has averaged 0.78 over the past
2 days and the 10-day moving-average of the Arms Index was 1.53 at the
close of trading on Wednesday (readings over 1.5 for the Arms Index's 10-DMA
are rare and only occur as a result of widespread panic). Sentiment indicators
suggest that we are close to a short-term bottom in terms of time, but
perhaps not in terms of price (a spike down to around 1100 on the S&P500
Index over the next few days would not surprise us).
In expecting the market to hold together
until at least March there is a chance that we are not bearish enough.
The strength of the next rally (the one that will likely begin within the
next few days) should give us a big clue as to whether we are or aren't.
Gold and
Silver
Gold
Wednesday was one of the most positive
days in the gold market in quite a while. The Bank of England auctioned-off
another 20 tonnes of its gold at a price that was about $4 below where
gold had been trading just prior to the auction. Furthermore, the auction
was only 1.4-times oversubscribed versus expectations that it would be
about 3-times oversubscribed. As we've noted in the past the results of
these auctions do not provide any indication whatsoever of underlying gold
demand. This is because only a small group of insiders are permitted to
make bids and most of the bidders have a vested interest in ensuring that
the gold price remains low. However, whenever the auction results have
deviated markedly from expectations in the past they have had a significant
effect on the gold price. As such, yesterday's lousy auction results would
normally (based on past experience) have led to $3-$4 drop in the gold
price by the close of trading in New York. The fact that the market shrugged-off
the poor auction results and pushed the gold price $3 higher by the end
of the day really was a big change from what we've become accustomed to
over the past few years.
Does Wednesday's positive action change
our view that gold and gold stocks are approaching short-term peaks? The
short answer is no, particularly with respect to gold stocks.
One of the reasons we were enthusiastic
about gold stocks in October/November 2000, even though there was no reason
to be enthusiastic based on the price action at that time, was that gold
stocks had reached their lowest levels of the past 20 years (perhaps even
their lowest levels ever) relative to the gold price. Gold stocks at that
time appeared to be discounting a drop in the gold price to around $200,
something we were confident would not happen. Sentiment towards gold stocks
at that time was as negative as sentiment towards any sector of the stock
market ever gets.
Since November-2000 the gold price
has moved up by 8% while gold stocks, as represented by the TSI Gold Stock
Index (TGSI), have moved up by 91%. The value of the TGSI relative to the
gold price has thus undergone a dramatic change. From being severely under-priced
14 months ago, the stock price of the average large gold producer is now
high relative to today's gold price.
The TGSI's break above its 14-month
upward-sloping channel (see chart below) also highlights the bullish enthusiasm
that is currently being built into gold stock prices.
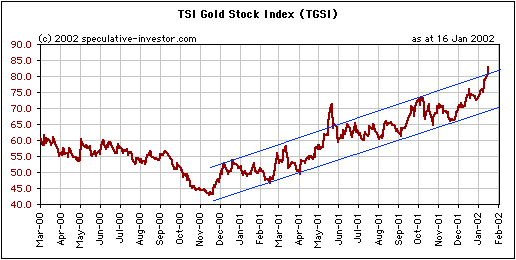
The TGSI could quite conceivably spike
another 10% higher before a correction begins, but the risk/reward ratio
for the stocks of the major producers is no longer attractive. Gold bullion,
however, still represents excellent value at $287.
Silver
From last week's Interim Update: "We
expect the silver price to move MUCH higher over the coming 6-12 months
and are holding an investment position in Corner Bay Silver as a means
of profiting from the incipient silver bull. However, if we were long silver
futures (we're not) we'd be buying put options now to hedge the position
whilst maintaining exposure to any further upside. Silver could move through
resistance at $4.80 and explode higher, but the more likely outcome over
the next 1-2 months is a pullback to the 4.30s."
Silver has since commenced a pullback
and a drop to the 4.30s or lower is likely over the next 1-2 months. This
pullback, assuming it unfolds as expected, should create a lower-high and
provide another (perhaps final) opportunity to purchase the stocks of some
of the silver producers/explorers at bargain-basement prices (although
they will still probably be a lot higher than they were 2 months ago).
Update
on Stock Selections
Chesapeake Energy (NYSE: CHK) has spiked
below support in the $5.90-$6.00 area twice over the past few days, but
has held support on a closing basis. Investors with a 12-month time frame
should continue to buy this stock on weakness.
Normandy Mining announced today that
it recently bought back 1.3M ounces of forward contracts. Robert de Crespigny,
CEO of NDY, said:
"The change to gold hedging policy
and restructuring of the hedge
book both enhance the value of
Normandy. We have a prudent level of
downside protection but have 70%
of reserves and 87% of resources
fully exposed to higher gold prices,
and we will continue to reduce
fixed price hedging as debt is
reduced."
NDY is no longer one of our holdings,
but we are still involved through Franco Nevada and the NEM-NDY-FN merger.
Also, NDY's announcement has positive implications for the gold market
because it shows that one significant source of gold supply is being removed.
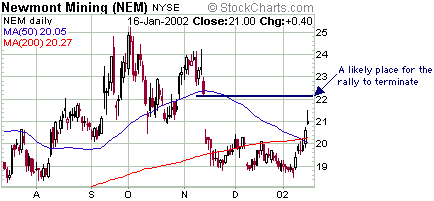
NEM's chances of taking-over NDY, and
hence FN, have been given a boost this week by strength in the NEM stock
price. In the absence of a major rally in the gold price NEM's upside from
current levels is probably limited to about $1, but it may have strengthened
enough already to ensure victory in the NDY takeover battle. We'll know
for sure at the end of this week when the competing Anglogold bid closes.
We are going to sell our trading position
in Harmony Gold Mining today (our investment position in Harmony will be
retained).

|

