|
- Interim Update 16th January 2008
Copyright
Reminder
The commentaries that appear at TSI
may not be distributed, in full or in part, without our written permission.
In particular, please note that the posting of extracts from TSI commentaries
at other web sites or providing links to TSI commentaries at other web
sites (for example, at discussion boards) without our written permission
is prohibited.
We reserve the right to immediately
terminate the subscription of any TSI subscriber who distributes the TSI
commentaries without our written permission.
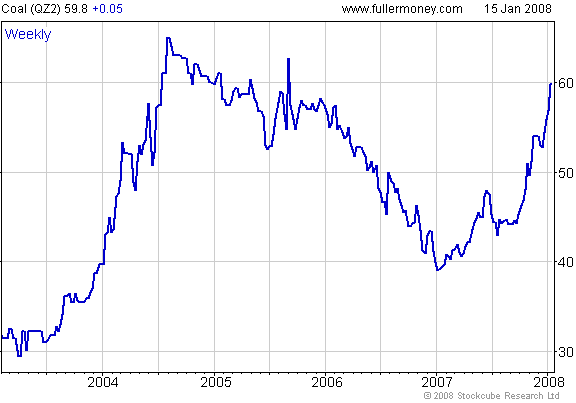
Coal Update
The following weekly chart shows that the price of coal is continuing
to trend upward. Furthermore, substantial upward revisions over the
past week to the 12-month coal-price forecasts of Macquarie Bank and UBS suggest that there is a lot more to come.
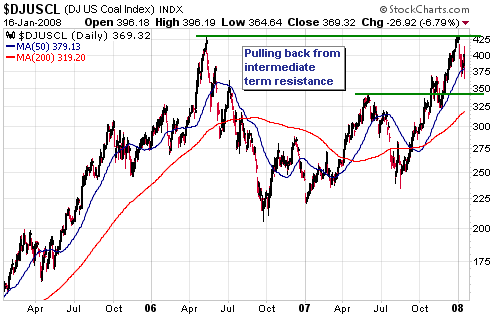
The coal sector of
the stock market, as represented on the following chart by the Dow
Jones US Coal Index (DJUSCL), has begun to consolidate the large gain
it made during the final 4.5 months of 2007. Assuming the broad stock
market doesn't collapse the DJUSCL will probably hold above support at
340-350 during this consolidation and then move to new highs.
The Stock Market
Current Market Situation
Our experience has been that the most reliable bullish signals relating
to put/call ratios are generated when the 10-day moving average of the
equity put/call ratio moves up to near a multi-year high at the same
time as the 10-day moving average of the OEX put/call ratio moves down
to near a multi-year low. Such occurrences indicate that the 'dumb
money' is far more worried than the 'smart money' about the market's
short-term downside risk, since the trading of equity options is
dominated by the public (the 'dumb money') while the trading of OEX
options is dominated by professional money managers (the 'smart
money').
The following chart shows that a bullish signal as described above has
just been generated, meaning that the put/call ratio has joined a
number of other indicators in suggesting that the US stock market is
close to a bottom of at least short-term significance.

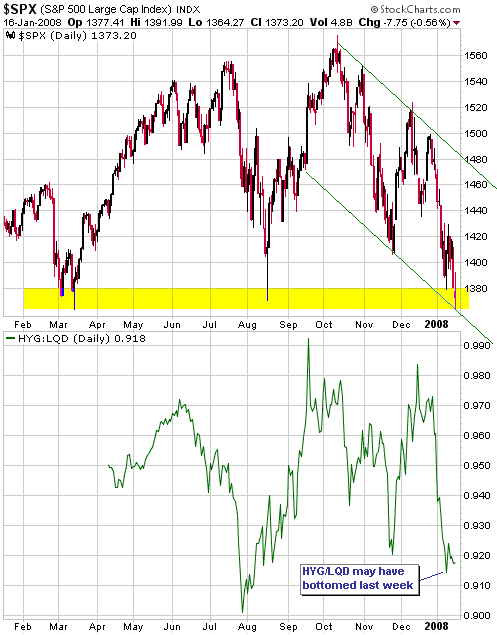
The next chart
compares the S&P500 Index with the HYG/LQD ratio (an indicator of
how high-yield corporate debt is performing relative to
investment-grade corporate debt). The HYG/LQD ratio has been leading
the S&P500 Index at important turning points during the debt crisis
and, interestingly, did not move to new lows this week. This could be a
warning that the stock market's current downward leg is close to an end.
Our expectation is
that a multi-week rebound will soon begin. This rebound will probably
be followed by a drop to new lows, but bearish sentiment has become so
pervasive that we are seriously considering the possibility that the
ultimate low for the 'choppy' stock market downturn that got underway
last July won't be far below the current level.
The Hong Kong Market
Our most recent mention of the Hong Kong stock market was in the 26th November Weekly Update, when we wrote:
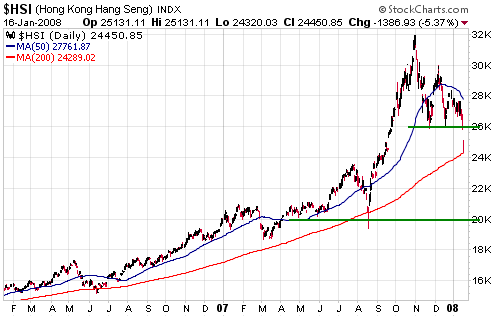
"Hong Kong's Hang Seng
Index (HSI) has pulled back sharply over the past few weeks, but a
correction low is probably not yet in place. As evidenced by the
following chart, at last week's low the HSI was still about 13% above
its 200-day moving average and none of the previous corrections over
the past three years ended until after this moving average was reached.
Putting it another way: despite its recent sharp decline the HSI is
still too high for this to be a low-risk buying point."
As the result of a mini-collapse on Tuesday and Wednesday of this week
the HSI has just reached its 200-day moving average. Refer to the
following chart for details.
It is possible that the HSI's correction is complete and very probable that it is at least two-thirds complete.
Gold and
the Dollar
The Dollar
2008 Outlook for the US$
In the 11th January edition
of his "Thoughts From The Frontline" letter, John Mauldin makes the
point that forcing China to upwardly re-value its currency cannot
possibly make a significant dent in the US trade imbalance. The reason
is that the large US trade deficit has been caused by the combination
of increased US consumer spending and reduced US saving, not by the
incorrect pricing of currencies in the foreign exchange market. As he
puts it:
"Want to see the real
problem at the root cause of the trade deficit? The one that candidates
absolutely cannot mention from the debate podiums? Look at the next
chart:
No,
the simple answer is that the trade deficit is not going to come down
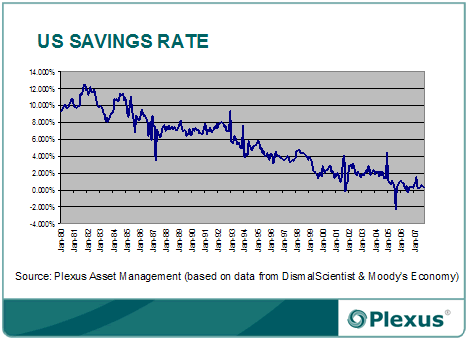
until the US starts to save more and spend less. In 1992, consumer
spending was a little over 65% of GDP. It is now closer to 72%. Savings
are down from 8% in that time, to barely above zero. If US consumers
simply saved 5%, as we did 10 years ago, the trade deficit would come
down by a lot."
Unfortunately, Mr. Mauldin stops short of identifying the "real problem
at the root cause of the trade deficit". To identify the real problem
you have to go a step further and ask the question: Why has there been
a long-term trend towards more spending and less saving? After all, the
average American didn't set out, in 1992, with the goal of whittling
down his/her savings to zero over the ensuing 15 years. The reduction
in savings has, instead, been a RATIONAL response to the economic
stimuli of the times.
All you have to do is dig a small distance beneath the surface to
discover that the reduction in the savings rate has been a natural
reaction to inflation. The crux of the matter is that it makes no sense
to keep much of one's wealth in the form of monetary savings if one is
very confident that money will be worth a lot less in the future than
it is today.
As we've explained in many previous commentaries, a trade deficit is
not, in and of itself, a problem. It can, however, be a symptom of an
inflation problem. In the US case, the large slide in the savings rate
that has occurred alongside the large increase in the trade deficit
strongly suggests that the trade deficit is, indeed, symptomatic of
such a problem.
An inflation problem caused the bear market in the Dollar Index, but
the bear market might either be over or about to go into hibernation
for an extended period. This is not because the US no longer has an
inflation problem; it's because the market has taken the US$ too low
relative to other currencies, most notably the euro, that have major
problems of their own. The euro now trades at a 20-30% purchasing-power
premium to the US$, and yet: a) the euro-zone has developed its own
inflation problem thanks to double-digit growth in money supply, b) the
unfunded government liabilities of countries such as Germany and France
are every bit as problematical as those of the US, and c) there is a
significant risk that the European Monetary Union (EMU) will start
coming apart at the seams due to economic distress in countries such as
Italy and Spain.
Which brings us to our 2008 outlook for the Dollar Index:
Our view is that the Dollar Index commenced a bottoming process last
November -- a process that will probably entail at least one test of
the November low and be complete by March of this year. We expect that
an intermediate-term US$ rally, driven initially by the realisation
that the ECB will have to cut interest rates almost as much as the Fed,
will then begin.
Current Market Situation
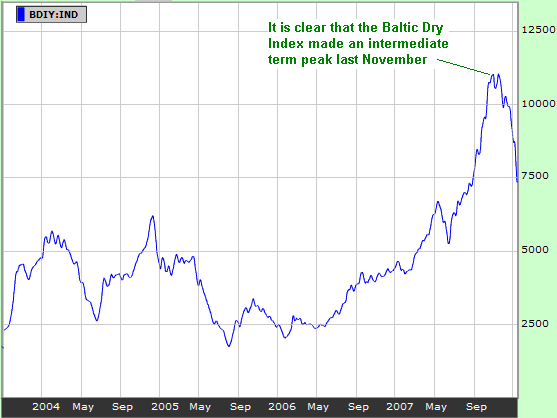
Over the past 20 years, important turning points in ocean freight rates
-- as measured by the Baltic Dry Index (BDI) -- have usually coincided
with important turning points in the currency market, with peaks in
freight rates coinciding with bottoms in the Dollar Index and bottoms
in freight rates coinciding with peaks in the Dollar Index. We
therefore consider the sharp decline evident on the following BDI chart
to be a significant piece of the currency market puzzle. It is now
clear that the BDI made an intermediate-term peak last November, which
adds weight to our view that the US$ is in the process of bottoming.
The BDI's downward reversal could also be construed as a bearish omen
for global economic growth, although its record as an indicator of
currency-market trends is much better than its record as an indicator
of economic-growth trends.
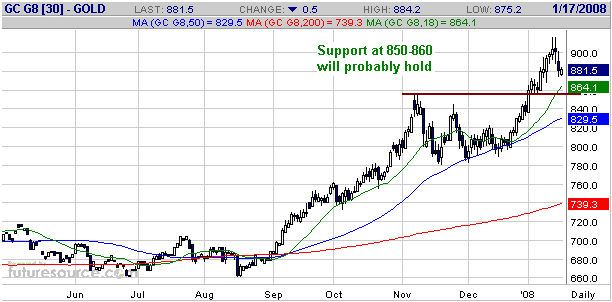
Gold
The gold market has entered correction mode, but the current correction
probably won't be as long or as deep as the one that occurred during
November-December. The reason is that it has been less than three weeks
since gold broke to new highs and the market does not look overly
extended. Our guess is that the nearest futures contract will find
support at, or above, $850-$860 and then manage another multi-week
advance before reaching a more important peak.
Although we expect
the current pullback to be fairly brief and shallow, the recent flood
of forecasts calling for gold to reach $1000, combined with the
record-high speculative net-long position in COMEX gold futures and the
return of Market Vane's bullish percentage to the high-80s, indicates
that sentiment has become overtly optimistic. At least, sentiment
appears to have become overtly optimistic within the ranks of
professional speculators. We get the impression, however, that the
general public remains unenthusiastic about gold.
The public's continuing lack of enthusiasm is a reliable sign that the
gold market is a very long way from a major peak, but the sentiment of
gold traders is consistent with what we'd expect to find near an
intermediate-term top. We therefore see no reason to change our view
that gold will reach an intermediate-term top during the first two
months of the year.
Gold Stocks
Using history as a guide...
The gold sector has spent so much time moving in the same direction as
the broad stock market over the past four years that most people have
probably forgotten that gold stocks are, first and foremost,
counter-cyclical investments (by "counter-cyclical" we mean that they
tend to do best during periods when real economic growth is weakest).
However, there are signs that the gold sector's traditional
counter-cyclical nature is returning to the fore.
As noted in the latest Weekly Update, the gold sector's performance
during the 1973-1974 equity bear market -- the most severe bear market
in the Dow Industrials Index since the 1930s -- provides us with a good
example of the gold sector's counter-cyclical nature. The example is
illustrated by the following chart-based comparison of the Dow and the
Barrons Gold Mining Index (BGMI). With reference to this chart, notice
that the BGMI trended relentlessly upward until the final month of the
bear market in general equities, at which point gold-related equities
joined the broad market's collapse. Notice, also, that the BGMI
commenced a 2-year BEAR market just prior to the start of a 2-year BULL
market in the Dow.
If the gold sector is beginning to behave in a more traditional way
than it has over the past few years (the past few years have been an
aberration) then the biggest intermediate-term risk faced by investors
in gold stocks isn't the potential for a large decline in the broad
stock market; rather, it's that the crisis spawned by the large-scale
mispricing of credit will soon either come to a conclusion or reach the
point where its ramifications have been fully discounted by the
financial markets.
The long-term risk is that governments and central banks will stop
debasing their currencies, but this is not really a risk at all.

Current Market Situation
The AMEX Gold BUGS Index (HUI) reversed downward on Monday and then
fell sharply over the next two days. Tuesday's quick decline coincided
with considerable weakness in the broad stock market, while Wednesday's
decline was prompted by a pullback in the bullion price. The main
problem, though, was that the HUI began Tuesday's session at an
overbought extreme. The overbought extreme is evidenced by the Relative
Strength Index (RSI) shown at the bottom of the following chart, as
well as by the steepness of the preceding multi-week advance and the
fact that the HUI rose for 5 days in a row prior to Tuesday.
The HUI's decline over the past two trading days has been sharper than
we'd normally expect from a downward correction to an on-going
short-term upward trend, but this really just continues the pattern of
the past several months. The gold-stock indices have become much more
volatile since July of last year, falling further and faster than
normal during the corrections and rising further and faster than normal
during the advances.
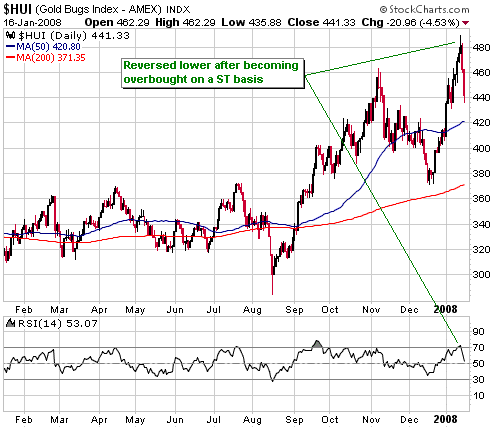
The market's high
volatility is making short-term outcomes even less predictable than
usual, but our guess is that in price terms the bulk of the HUI's
correction is already behind us. More time will probably have to
transpire before the next advance gets underway, but the ultimate low
for the current pullback will probably be within a few percent of
Wednesday's low.
From a technical perspective our main concern is that Royal Gold (RGLD)
has STILL not confirmed the upside breakouts of gold bullion and the
gold-stock indices. In fact, RGLD's definitive downward reversal from
the vicinity of intermediate-term resistance on Monday proved to be
prescient.
Update
on Stock Selections
(Note: To review the complete list of current TSI stock selections, logon at http://www.speculative-investor.com/new/market_logon.asp
and then click on "Stock Selections" in the menu. When at the Stock
Selections page, click on a stock's symbol to bring-up an archive of our comments on the stock in question)
 TSI Energy Trust Index (TETI) TSI Energy Trust Index (TETI)
In the 26th September 2007 Interim Update we wrote:
"Monday's PWI news was
followed, on Tuesday, by news that Vault Energy (TSX: VNG.UN), one of
the smallest Canadian energy trusts, had agreed to be acquired by Penn
West Energy (TSX: PWT.UN, NYSE: PWE), one of the largest. PWT is
offering 0.14 of its units for every VNG unit, which at PWT's current
price represents a premium of around 8% to VNG's pre-bid unit price. A
chart of PWT.UN is displayed below.
If we are right that
natural gas (NG) is about to commence a new bull market then VNG is
being sold at a low price and at a potentially inopportune time. The
upside is that although it would result in the TETI having less
exposure to future increases in the NG price, replacing VNG with PWT
would significantly reduce our downside risk.
We haven't yet decided if
we will go ahead and replace VNG with PWT, but chances are we will. One
concern with PWT is that its NG weighting is only 44% (44% of its
energy production is NG, with the remainder being oil and NG liquids),
which is a lot lower than the other members of the TETI. Also, its
current yield is 'only' 13.2%. The relatively low yield, however, is
just a reflection of the relatively low risk (in the world of 'yield'
there is no such thing as a free lunch, meaning that you only get more
yield by accepting more risk). On the positive side of the ledger, PWT
owns a huge -- 6.8B barrels is the estimated size of the resource --
development-stage oil sands project [the Peace River project] that the
stock market does not appear to be assigning much value to at this
time."
PWT's takeover of VNG was completed on Monday, so Monday was the last trading day for VNG.
We have decided to replace VNG with PWT in our index and will use
Monday's closing prices of C$3.88 and C$27.40, respectively, for record
purposes. As we noted in our 26th September commentary, PWT's
relatively small natural gas weighting -- the gas weighting will be
45-46% following the takeovers of Vault and Canetic -- is a negative as
we expect natural gas to outperform oil over the coming years. In the
plus column, however, its 15% yield (based on Wednesday's closing price
of C$27.19) is attractive given its comparatively low risk. Also, the
potential upside provided by its Peace River oil sands project is
significant. And lastly, we like the fact that PWT trades on the NYSE
as well as on the TSX because the dual listing will tend to create
additional investment demand for the units and improve the trust's
performance over time. PWT has under-performed of late, but this has
been due to takeover-related selling that should almost be complete.
Copper Fox (TSXV: CUU). Shares: 82M issued, 91M fully diluted. Recent price: C$0.53
CUU announced the results of the Scoping Study for its Schaft Creek
copper/gold project on Monday. The Study contains the following
estimates:
1. The cost to build a 65000tpd mine with a 31-year life is $1428M, including a $463M contingency and cost escalation reserve
2. The project's internal rate of return (IRR) and net present value
(NPV) are 32.7% and $5347M, respectively, assuming a 5% discount rate
and the following metal prices:
Copper: $2.66/pound
Gold: $564/ounce
Molybdenum: $27/pound
3. Pre-Feasibility Study to be complete by 30th April 2008 and Feasibility Study to be complete by 31st December 2008.
If Teck exercises its back-in right then CUU will end up with 23.35% of
the project, which, based on the above figures and assumptions, means
that CUU's stake is worth $1248M (23.35%*$5347M). This equates to
$13.72 per fully-diluted share.
In the current market environment it seems that investors aren't
prepared to pay more than $0.50-$0.60 for an exploration-stage
copper/gold miner with $13.72 of potential value, but they will
eventually be prepared to pay a lot more.
New trading positions
Our best guess at this time is that the US stock market will make its
lows for the year during the second quarter and that the ultimate low
won't be a long way below the current level. We have therefore decided
to add two long-dated call options to the TSI Stocks List -- the
Chesapeake Energy (CHK) January-2009 $40 call options (VECAH) at
US$4.40 and the Intel (INTC) January-2009 $25 call options at US$1.30.
CHK has been a relatively strong stock of late and looks like it could
break out to the upside from a multi-year consolidation if the broad
stock market stabilises. Intel has recently been very weak due to
earnings results that disappointed the market, but as a result of its
stock market pummeling it now trades at only 13-14 times this year's
expected earnings. This is low for a company that has an earnings
growth rate of 25-30% and a dominant position in its industry.
Chart Sources
Charts appearing in today's commentary
are courtesy of:
http://stockcharts.com/index.html
http://www.futuresource.com/
http://www.decisionpoint.com/
http://www.fullermoney.com/

|