|
- Interim Update 16th April 2008
Copyright
Reminder
The commentaries that appear at TSI
may not be distributed, in full or in part, without our written permission.
In particular, please note that the posting of extracts from TSI commentaries
at other web sites or providing links to TSI commentaries at other web
sites (for example, at discussion boards) without our written permission
is prohibited.
We reserve the right to immediately
terminate the subscription of any TSI subscriber who distributes the TSI
commentaries without our written permission.
The Decade Cycle (a.k.a. the rolling bubble)
Since the birth of the floating (sinking?) currency regime at the
beginning of the 1970s, the best bull market of any decade has always
continued until the beginning of the next decade. To help illustrate
what we are talking about we present, below, three charts that
represent the best bull markets of the 1970s, 1980s and 1990s,
respectively.
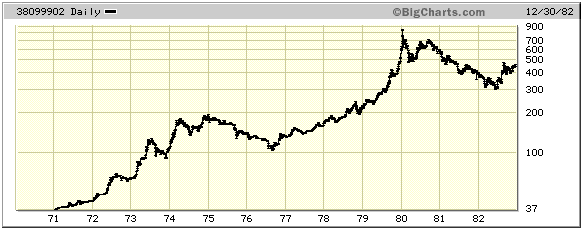
The best (most powerful) bull market of the 1970s was in commodities,
with a particular focus on precious metals and oil. Therefore, for the
first of our charts we have chosen one that shows gold's performance
during the 1970s and the first three years of the 1980s.
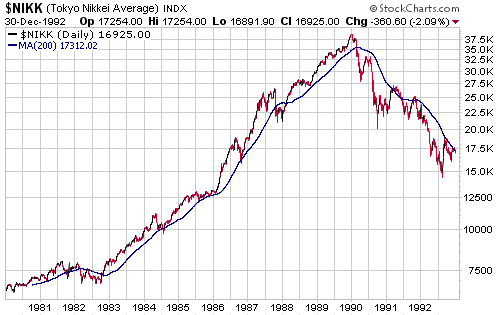
The next decade (the
1980s) was dominated by Japan, so our second chart shows how the
Nikkei225 Index performed throughout this decade and during the first
three years of the 1990s.
Finally, the best
bull market of the 1990s was in the US, with a particular focus on the
NASDAQ. Our third chart therefore reveals the NASDAQ's performance
during this decade and the first three years of the ensuing (current)
decade.
Notice that in each
case the bull market continued until January-March of the 'zero year'
-- January-1980 for gold, January-1990 for the Nikkei, and March-2000
for the NASDAQ -- and there was a very strong advance during the final
12-18 months of the decade. This could have relevance to the present
day given that we are close to entering the final 18 months of the
decade.
The best bull market of the current decade has been in commodities,
with a particular focus on metals and energy. The emerging-market bull
is running a close second. The "Decade Cycle" defined above therefore
projects a lot more strength in the commodity world between now and the
end of 2009.
We are positioned for the aforementioned strength, although we expect a
shakeout to occur before the final advance gets underway.
By the way, the best bull market of the next decade will probably also
be in gold and commodities. This is because long-term bull markets
never end until gross over-valuation is achieved, and gross
over-valuation is unlikely to be achieved within the next 2 years.
During the next decade there should, however, be more emphasis on gold
than on the industrial commodities because by then the defective nature
of the official money will be more widely understood.
Oil and Gas
A divergence grows bigger
The oil price and the Canadian Dollar have trended together for at
least the past 13 years. There have been a few multi-month periods when
the two markets went their separate ways, but they always ended up
moving back into line with each other. Up until now there have been no
really major divergences, although if the current divergence continues
to build it will soon reach the "major" category.
The following chart shows that oil and the C$ trended relentlessly
higher between January and November of last year, but after peaking
together in November they took very different paths. Specifically, the
C$ embarked on an intermediate-term correction whereas the oil market,
after pulling back for a few weeks following its November peak, quickly
returned to its steeply-sloped upward path.
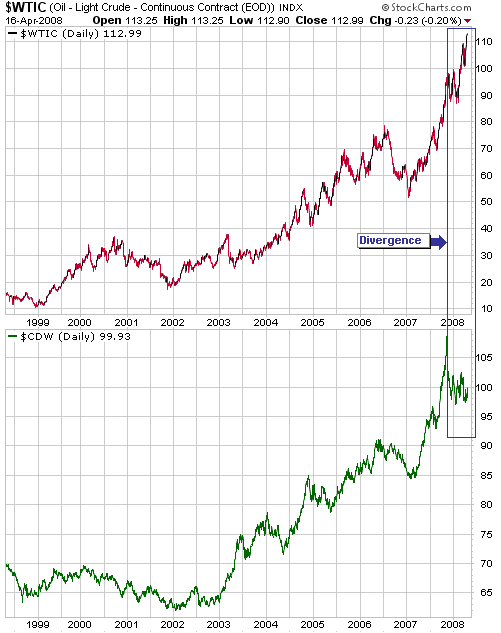
The primary reason appears to be the US dollar's weakness relative to
the euro. The following chart shows that oil and the euro remain
'joined at the hip', so with the euro continuing to make new highs
against the US$ it makes a modicum of sense that oil is also continuing
to make new highs. Oil, it seems, has temporarily taken over from gold
as the preferred currency hedge within the commodity world. This is a
situation that won't last, but it explains why oil keeps pushing
upward. What is more difficult to explain, for those of us who look at
the euro's negatives as well as the US dollar's negatives, is why the
euro keeps making new highs against the dollar.
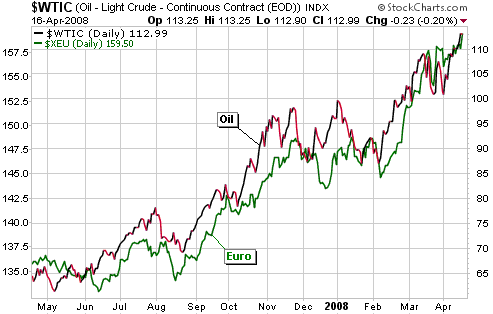
Our GUESS is that both the euro and oil are very close to peaks in
terms of price and time, but we wouldn't bet against either market
until price action began to substantiate this guess. A preliminary, but
likely meaningful, indication of a trend change would be a daily close
below the 18-day moving average by the June euro futures contract. This
moving average is presently at 1.5711 and is rising each day.
Quick note on natural gas
Natural gas (NG), a form of energy that we have been very bullish on,
continues to do well. The market action suggests a short-term target of
$11-$12 (about 10% above the current price), but as noted in an earlier
commentary we expect that there will be a peak by May followed by a
pullback into the July-September timeframe. We therefore continue to
believe that it will make sense to scale out of NG trading positions
into strength over the next few weeks.
Scaling in and out of positions is what we almost always do in the
management of own money, but the TSI Stocks List is not run like a
portfolio -- it is a list of investing and trading ideas, not a
portfolio -- and therefore doesn't, in general, reflect money
management tactics/discipline. Rather than scaling in and out of
positions in order to minimise timing risk, when it comes to making an
addition to or a deletion from the List we have to pick our spot.
Further to the above, we have decided to exit our Chesapeake Energy
(CHK) January-2009 $40 call options. The profit on the trade, based on
Wednesday's closing price of US$13.50 and our 16th January entry price
of US$4.40, was 207%.
The Stock Market
Current Market Situation
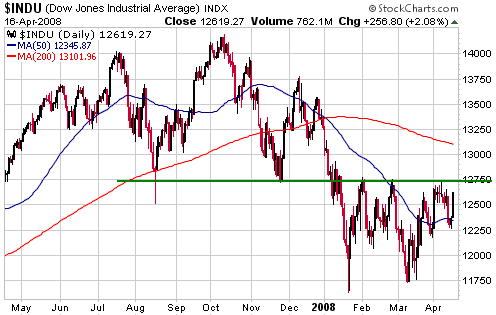
The following chart shows the resistance at 12750 that has capped
rallies in the Dow Industrial Index over the past three months. Our
impression is that the Dow is 'coiling' in preparation for a break
above this resistance. Note that such a breakout would project a test
of last year's peak.
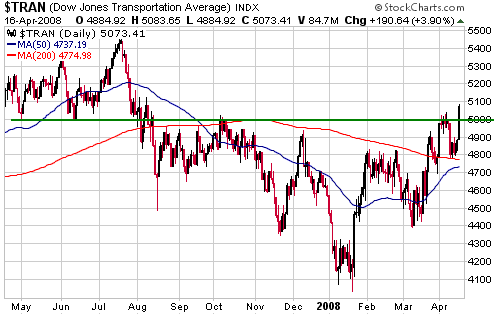
Interestingly, the
Dow Transportation Average, which has been a relative strength leader
since January, has already broken out to the upside (refer to the
following chart for details). It looks like the Transportation Average
is on its way to a new all-time high.
As far as our
short-term bullish view is concerned, the one significant issue is the
lack of inter-market confirmation of the US stock market's rebound. In
particular, for the rebound to have any real staying power it should
eventually be confirmed by an upward reversal in the US$.
Gold and
the Dollar
Gold Stocks
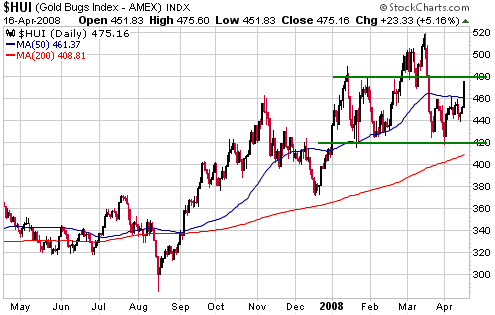
The bearish interpretation of the following chart is that the HUI is in
the process of completing the "right shoulder" of a
"head-and-shoulders" top, while the bullish interpretation is that the
recent sharp drop from 520 to 420 was "all she wrote" as far as the
downward correction is concerned. Depending on which interpretation is
correct, there is either going to be a large advance or a large decline
over the coming 4 weeks. Either way, it will be an interesting time!
We think the odds are slightly in favour of the latter outcome, which
would entail a decline to a May-June low followed by an upward trend
that should, based on the "Decade Cycle", extend through to the end of
NEXT year. We are positioned for this upward trend, not the decline
that will possibly precede it, but in our own account we have begun to
take some precautionary measures due to the near-term risk of a slump
in our favourite stock-market sector.
In recent commentaries we mentioned that we would view a HUI rebound to
around 480 as an opportunity to either take some money off the 'golden
table' or buy some insurance in the form of GDX put options. This
opportunity is now presenting itself, so we have begun to average into
some GDX and PAAS June-July put options (the purpose of the PAAS puts
is to hedge our silver exposure). If the gold sector ramps upward over
the next few weeks -- in our opinion a lower-probability outcome, but
certainly not a long shot -- then we will have wasted our money on
these puts in the same way that we waste money on fire insurance every
year that our house doesn't burn down.
By the way, a strong upward move to a May or June peak (the
lower-probability outcome) would probably be followed by a sharp
downward correction to an October-November low and then a powerful
rally through to the end of next year.
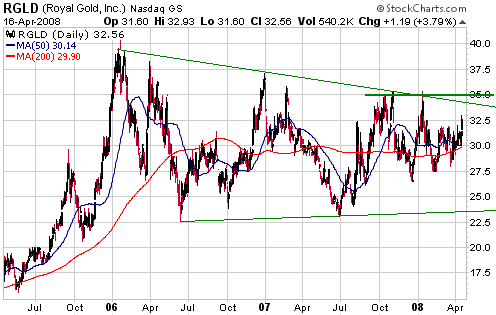
As we've noted in
many previous commentaries, over the past year Royal Gold (RGLD) has
been a better proxy for the overall gold sector than popular gold-stock
indices such as the HUI and the XAU. The following chart shows that
RGLD has made a sequence of declining tops since early 2006, with the
most recent top of significance at around $35.
A daily close above $35 would therefore paint a very bullish short-term
picture. However, the most likely short-term scenario is that RGLD tops
below $34 within the next several days and then drops back to near the
bottom of its consolidation range (the low-$20s) over the ensuing 1-2
months.
Update
on Stock Selections
(Note: To review the complete list of current TSI stock selections, logon at http://www.speculative-investor.com/new/market_logon.asp
and then click on "Stock Selections" in the menu. When at the Stock
Selections page, click on a stock's symbol to bring-up an archive of our comments on the stock in question)
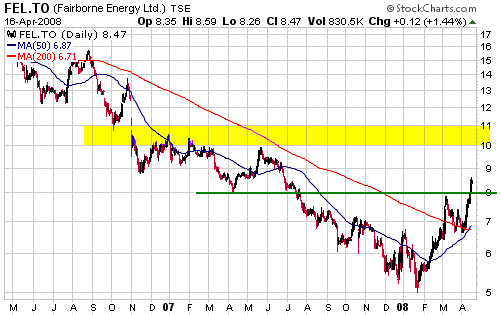
 Fairborne Energy (TSX: FEL). Shares: 83M issued. Recent price: C$8.47 Fairborne Energy (TSX: FEL). Shares: 83M issued. Recent price: C$8.47
Natural gas producer FEL was originally part of our 'gassy' energy
trust position (the TSI Energy Trust Index - TETI), but last December
it converted itself into an exploration and production (E&P)
company. This forced us to remove FEL from our energy trust index and
crystallise a loss, but our view was that at the absurdly low price at
which it was trading at the time it made no sense to sell FEL. This was
especially so given that the outlook for natural gas looked bullish and
that a private equity firm had recently paid C$7.45/share for a
substantial stake in the company. We therefore made FEL a separate
position in the TSI Stocks List, noting that: "At
the current natural gas price we think fair value for FEL is around
C$7-C$8 per share, so buyers near Friday's closing price of C$5.61 are,
in our opinion, getting a very good deal."
Our decision to add FEL to the List as a separate position following
its conversion from a trust to an E&P company has paid off in that
the stock price has since gained about 50%. It's now time to think
about where we should make our exit.
With reference to the following chart, the recent break above
intermediate-term resistance at C$8 projects additional gains up to
resistance in the $10-$11 range. We don't know if this range will be
reached within the coming month, but if it is then we will grab the
opportunity to make at least a partial exit. In fact, we think it will
make sense to start scaling out in the mid-C$9 area.
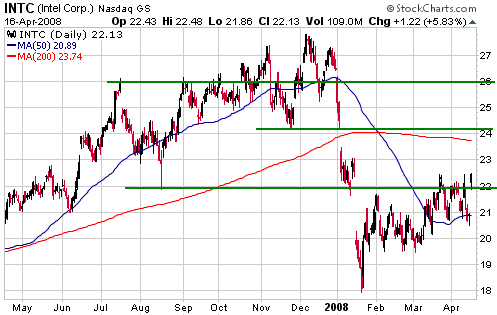
Intel (INTC) January-2009 $25 Call Options
About three months ago we added an Intel call option position to the
TSI List to reflect our view that the tech sector of the market was
close to an important low. After being underwater for a while, this
INTC position of ours is now starting to look reasonable.
As evidenced by the following chart, INTC is currently testing
resistance at around $22. A daily close above $22.50 would suggest that
a move up to $24, or perhaps even $26, was 'on the cards'.
As far as the TSI Stocks List is concerned our plan is to exit the call
option position if the stock trades at $24. As far as our own account
is concerned the plan is to scale out between $24 and $26.
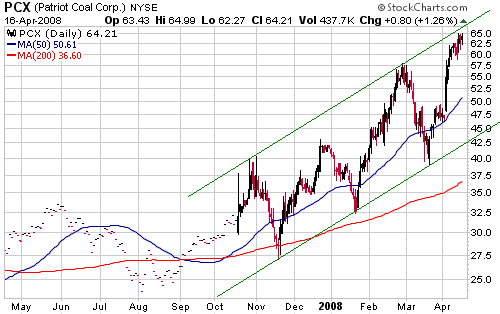
Patriot Coal (NYSE: PCX). Shares: 26.5M. Recent price: US$64.21
We most recently highlighted PCX as a buy on 19th March, when it was
trading at around $41, and on 2nd April, when it was trading at $47. It
has since moved up to the mid-$60s.
We suspect that PCX will become a triple-digit stock within the coming
12 months, so we do not think that a great profit-taking opportunity is
at hand. We did want to point out, though, that the stock has risen to
near the top of its short-term price channel (see chart below). As a
result, those with heavy exposure could consider partial profit-taking
at this time.
When managing our own money we regularly trade around a core position
-- taking some money off the table when a long-term holding becomes
overbought and then boosting our exposure following a pullback. The
risk with this strategy is that sometimes the stock ends up going much
higher before the inevitable pullback occurs. This is a risk we are
usually prepared to take.
European Minerals (TSX: EPM). Shares: 304M issued, 457M fully diluted. Recent price: C$0.89
We concluded our 7th April update on emerging gold/copper miner EPM by saying: "IF
we are only dealing with a delay of a few months to project
commissioning and deliveries into the hedge book can be adjusted to fit
the revised commissioning timetable then EPM is a strong buy near
Friday's closing price [of C$0.89]. The problem is, we can't be certain
that this is the case. At this time it is therefore not possible for us
to make a definitive buy or sell recommendation."
Earlier this week some more information on EPM's current situation
became available thanks to the publishing of the company's MD&A
(Management Discussion and Analysis) for the December quarter.
Unfortunately, though, the MD&A raised as many questions as it
answered.
What we now know is that EPM had $25M of cash at the end of last year,
$6M of which was used during the first quarter of this year to settle
the forward sales contracts that, due to project delays, could not be
settled by delivering gold bullion. The company would also have spent
money on project commissioning over the past few months, so cash on
hand at this time is probably no more than $15M. This is nowhere near
enough to see the company through to the commencement of commercial
production -- now expected to occur in September -- given that: a) loan
repayments totaling around $18M are due on 30th June, b) other forward
sales contracts might have to be settled in cash, and c) commissioning
costs will continue to be incurred. Therefore, EPM will have to come to
an agreement with its lenders to re-schedule loan repayments and
deliveries into forward sales contracts so that they line up with the
revised production schedule, or arrange additional financing of at
least $30M.
We think that EPM will get through this rough period mostly intact,
although there is a good chance that the share count will rise by
another 10-15% between now and when the company becomes cash flow
positive. In any case, we would not do any new buying of the stock
until a solution to the immediate financial issues is in place.
We have always been very much against the practice of forward selling
by mining companies because the only reason we ever want to own the
shares of these companies is to obtain leveraged exposure to the
anticipated upside in metal prices. However, we have been prepared to
stick with EPM because we thought -- and continue to think -- that its
eventual production levels would be high relative to the amount of
price-capped production (the company forward-sold 50% of the currently
planned production as part of a debt package, but substantial
production growth is likely over the coming years).
It's beginning to look like sticking with EPM was a mistake, though,
because we are now being given a clear demonstration of the risk that a
small single-project mining company accepts when it finances project
construction via the combination of debt and forward selling (some
hedging of future production is normally a prerequisite when a mining
company with no current revenue takes on significant debt). Financing a
large chunk of the mine construction cost in this way minimises stock
dilution, but it greatly increases the potential adverse impact of
project delays and, therefore, the risk.
Chart Sources
Charts appearing in today's commentary
are courtesy of:
http://stockcharts.com/index.html
http://www.futuresource.com/
http://bigcharts.marketwatch.com/

|