|
- Interim Update 16th May 2012
Copyright
Reminder
The commentaries that appear at TSI
may not be distributed, in full or in part, without our written permission.
In particular, please note that the posting of extracts from TSI commentaries
at other web sites or providing links to TSI commentaries at other web
sites (for example, at discussion boards) without our written permission
is prohibited.
We reserve the right to immediately
terminate the subscription of any TSI subscriber who distributes the TSI
commentaries without our written permission.
The Stock Market
We want to devote most of today's report to the gold sector, which is where the action is. Therefore, just a few bullet points on the broad stock market:
1. The bullish non-confirmation between the NASDAQ Composite Index and the NASDAQ's McClellan Oscillator is intact and at this time isn't under threat.
2. A second bullish non-confirmation is potentially under development, in that the RUT/SPX ratio (the Small-Cap Index divided by the Large-Cap Index) hasn't confirmed the recent stock market weakness.
3. The senior US stock indices are 'oversold' on a short-term basis, as evidenced by the fact that the Dow Industrials Index has closed lower on 10 of the past 11 days.
4. The Dow Jones World Index is very 'oversold' on a short-term basis.
The odds favour a meaningful upward reversal this week or next.
Gold and the Dollar
Gold
Sentiment
49% is the 8-year low for Market Vane's bullish percentage (the percentage of traders surveyed by Market Vane who say they are bullish) for the gold market. This occurred on 13th November 2008 -- the day after gold made its closing low of the 2008 crash. Aside from the 13th November-2008 reading of 49%, the lowest bullish percentage of the past 8 years is 51%. This also occurred near the depths of the 2008 crash.
Outside of the 4-week period in 2008 when gold was making a major bottom after experiencing a peak-to-trough decline of about 30%, 52% is the 8-year low for the bullish percentage reported by Market Vane. 52% is the bullish percentage reported by Market Vane on both Monday and Tuesday of this week.
In other words, the results of the Market Vane survey suggest that sentiment towards gold is now almost as bearish as it was at the crescendo of the 2008 financial-markets crash and is more bearish than at any other time over the past 8 years.
A challenge with the application of sentiment indicators is that there are no absolute benchmarks. We generally look at current indicators of sentiment in relation to where they have been over the past few years and in relation to price action, but it will always be possible for sentiment to become more bearish or more bullish. The only reasonable conclusion we can draw from this week's Market Vane results is that gold sentiment is now almost as stretched to the bearish side as it normally gets during intermediate-term bull market corrections.
Price Action
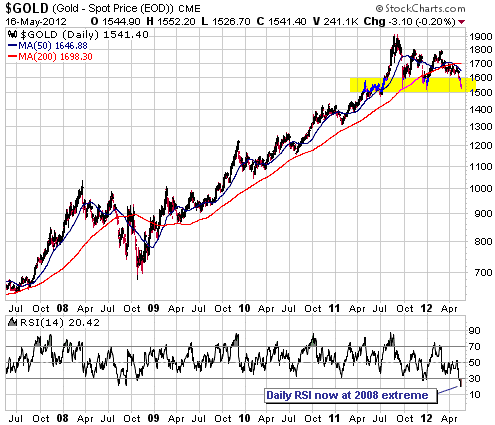
Gold has dropped slightly below the $1550 support level, but it remains within the broad range of support highlighted on the following daily chart. The bottom section of the chart shows that the daily RSI(14) is now as 'oversold' as it was at the 2008 bottom.
Silver is even more 'oversold' than gold. It has now fallen for 8 trading days in a row and on 12 of the past 13 trading days. Like gold, it is situated at support and its daily RSI(14) is near the extreme seen at the 2008 bottom.
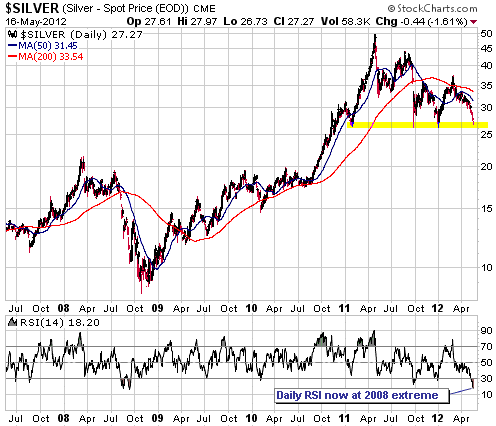
Our impression of silver as an investment is now diametrically opposite to what it was in April of last year. Throughout April of last year we were very concerned about silver's downside risk and regularly suggested ways of hedging against a major decline in the silver price. Our impression now is that most of the downside risk has been 'wrung out' of the silver market and that patient long-term investors should be buying.
We expect that silver will continue to hold at or above last year's lows, but we would allow for the possibility that a panic could lead to a spike down to the low-$20s. Allowing for this possibility simply involves gradually scaling into a full position over several months.
Gold Stocks
Current Market Situation
There is no way of sugar-coating this: over the past few weeks we've been as wrong as we could be about the gold sector of the stock market, culminating in our suggestion in the latest Weekly Update to buy GDXJ for a short-term trade. This trade was quickly stopped out for a 10% loss.
Sometimes when we are wrong we look back and think "what were we thinking, how could we have been so stupid?" At other times we look back at what turned out to be a mistake and think "well, it didn't work out, but based on what we knew at the time it was a reasonable thing to do." With the GDXJ trade, it was the latter. Based on the extent to which the gold sector was 'oversold' and the rare bullish divergence between gold bullion and the gold-stock indices that had just occurred, it was probably reasonable to place a bet on the idea that a short-term bottom was in place (although it could be argued that our 'stop' should have been tighter).
The stocks-bullion bullish divergence was eliminated during the first two trading days of this week. This doesn't mean that a short-term bottom isn't in place or won't soon be put in place, but it does mean that evidence of a bottom is conspicuous by its absence.
The HUI is probably still heading for May low, but the previously-noted similarity with the March-May decline of 2005 has been lessened by the price action of the past three days. We cite, in particular, the drop below the channel drawn on the following daily chart. In 2005, the bottom of a similar channel was only momentarily breached.
The current March-May decline in the HUI has now resulted in a loss of about 33%. This compares to 27% for the March-May decline of 2005 and 32% for the April-May decline of 2004.
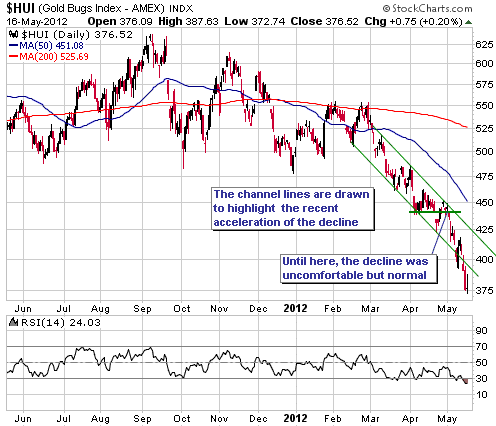
Objectively, the current decline is nowhere near as severe as the decline that occurred during July-October of 2008. However, it feels just as bad or even worse. It probably feels disproportionately bad for those of us with substantial exposure to gold/silver stocks because in 2008 the entire financial world was in collapse mode whereas over the past couple of months the weakness has been concentrated in commodity stocks in general and gold/silver stocks in particular.
In conclusion, we think the market is very close to a turning point. But then, we thought the same thing three weeks ago when prices were much higher. There is no telling how stupid the market will get before it starts coming to its senses, but we know that it will eventually come to its senses.
An interesting comparison
In an article posted HERE, Jordan Roy-Byrne compares the performance of commodity prices (as represented by the CCI) over the past several years with the performance of the US stock market during the 1980s and 1990s. His point is that the downward move in commodities over the past year could be analogous to the 1990 correction in the stock market.
When we saw the charts in the above-linked article it immediately occurred to us that the most appropriate comparison isn't between the broad US stock market of 20-something years ago and the CCI of today; rather, the most appropriate comparison is between the NASDAQ Composite Index from the time of the 1987 crash and the XAU (or the HUI) from the time of the 2008 crash. This is the comparison we've presented below.
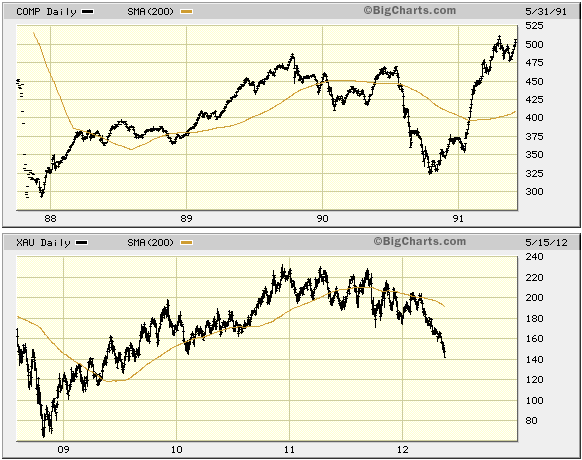
It has been said that history doesn't repeat, but it does rhyme. This saying applies to the financial markets because there are always parallels between the current action of a market and the action of the same or some other market at an earlier time. The problem is that in real time we never know for sure which historical market pattern the current market is rhyming with. This is a major limitation of history-based market comparisons that must always be kept in mind.
We wouldn't place any bets or hang any hats on the NASDAQ-XAU comparison illustrated above, but we do think that useful information can be gleaned from it. For starters, although these are two different markets at two different times subject to very different fundamental backdrops, there is a potentially important similarity. We are referring to the fact that the NASDAQ suffered a crash, followed by a 2-year rally, followed by a substantial correction lasting about one year that retraced more than half of the preceding 2-year rally, all within the context of a long-term bull market, and to the strong likelihood that the XAU is in the process of doing something similar. For seconds, imagine (or remember, if you were involved in the US stock market at that time), what sentiment towards NASDAQ stocks was like in October-November of 1990. With the market having just given back almost two years of hard-fought gains, the negativity was almost palpable. Very few people had any inkling of what was to come and that one of the best buying opportunities in history was staring them in the face. For thirds, notice the NASDAQ's price action immediately following its 1990 bottom. What eventually evolved into a major upward trend began with a choppy 1-2 month rebound and then a 1-month correction that retraced about half the gain from the bottom. At this point most people probably thought the bearish trend was still in force. It wasn't until the market broke above the peak of the initial rebound that bullish conviction began to grow.
Gold miner cash levels
In the table displayed below the TSI gold and silver stocks are sorted by "Net Cash", from the most cash rich at the top to the most cash poor at the bottom. Net Cash is defined as working capital (cash and other current assets minus current liabilities) minus long-term debt.
The final two columns of the table show Cash Per Share (CPS) and CPS divided by the 15th May share price. For example, at the close of trading on 15th May the market capitalisation of Keegan Resources (KGN) was less than its Net Cash, resulting in a CPS/Share-Price ratio of more than 100%. To put it another way, KGN's Feasibility-Stage 5M-ounce Esaase project was effectively being valued by the market at less than zero at that time.
| Company
Name |
Symbol |
Price
on 15 May ($) |
Total
Shares (M) |
Net
Cash ($M) |
Net
Cash Per Share ($) |
CPS
/ Share Price |
| Keegan
Resources |
KGN |
2.51 |
77 |
200 |
2.60 |
103% |
| Sabina
Gold & Silver |
SBB.TO |
1.90 |
164 |
150 |
0.91 |
48% |
| Evolution
Mining |
EVN.AX |
1.34 |
707 |
130 |
0.18 |
14% |
| Pretium
Resources |
PVG.TO |
11.60 |
101 |
110 |
1.09 |
9% |
| Resolute
Mining |
RSG.AX |
1.40 |
660 |
80 |
0.12 |
9% |
| Carpathian
Gold |
CPN.TO |
0.26 |
590 |
60 |
0.10 |
39% |
| Volta
Resources |
VTR.TO |
0.63 |
155 |
40 |
0.26 |
41% |
| Elgin
Mining |
ELG.TO |
0.63 |
150 |
35 |
0.23 |
37% |
| International
Tower Hill Mines |
THM |
2.73 |
87 |
35 |
0.40 |
15% |
| Sandspring
Resources |
SSP.V |
0.66 |
138 |
30 |
0.22 |
33% |
| Dragon
Mining |
DRA.AX |
0.80 |
89 |
29 |
0.33 |
41% |
| Rio
Novo Gold |
RN.TO |
0.38 |
113 |
22 |
0.19 |
51% |
| Andina
Minerals |
ADM.V |
0.51 |
134 |
19 |
0.14 |
28% |
| Endeavour
Mining |
EDV.TO |
2.00 |
254 |
9 |
0.04 |
2% |
| Batero
Gold |
BAT.V |
0.47 |
70 |
8 |
0.11 |
24% |
| Mansfield
Minerals |
MDR.V |
0.41 |
51 |
4 |
0.08 |
19% |
| Clifton
Star Resources |
CFO.V |
1.00 |
38 |
-38 |
-1.00 |
-100% |
| Golden
Star Resources |
GSS |
1.30 |
262 |
-42 |
-0.16 |
-12% |
| Orvana
Minerals |
ORV.TO |
0.83 |
137 |
-80 |
-0.58 |
-70% |
| Jaguar
Mining |
JAG |
1.27 |
84 |
-206 |
-2.45 |
-193% |
The following notes add colour to some of the numbers presented in the table:
1) For companies that are cash flow positive, having a lot of cash on the balance sheet is not critical. At this time, EVN.AX, EDV.TO and RSG.AX are strongly cash-flow positive. They also have strong balance sheets, which makes them relatively safe. DRA.AX, ELG.TO and GSS are also cash flow positive, but GSS is not yet generating enough cash to prevent its weak balance sheet from being a risk. ORV.TO's operations have begun to turn around, which should enable this producer to become cash flow positive in the near future. However, its weak balance sheet is a significant risk right now.
2) CPN.TO currently has a lot of cash, but all of the cash will be consumed over the coming 12 months in the construction of a 100K-oz/year gold mine in Brazil. It will also soon be borrowing money to finance the same construction project. This means that it will soon shift from the top one-third to the bottom one-third of the above table, but the short-term negative shift (from a cash perspective) will stand it in good stead on a longer-term basis if it ends up with a mine that generates plenty of cash.
3) EDV.TO's Net Cash would have been $85M (rather than $9M) if we hadn't deducted a $76M hedge liability. This is a non-cash liability, so it could be argued that we were unfair to deduct it when calculating net cash.
4) CFO.V has about $14M of cash, which should be enough to fund its operations for at least the next 12 months. The reason it is shown as having Net Cash of negative $38M is that we account for the $52M of option payments that are still owed to the original Duparquet project vendors as debt. A $22M option payment is due at the end of this year, but under the previous Osisko-CFO joint venture agreement Osisko is still obligated to finance this commitment via a loan that can be repaid within 2 years in cash or CFO shares (at a deemed share price of $3.12).
5) JAG clearly has the most precarious balance sheet.
6) The most extreme case of under-valuation relative to cash that we know of is not a TSI stock and is therefore not included in the above table. We are referring to Canaco Resources (TSX: CAN). CAN collapsed from C$0.87 to C$0.30 two days ago in reaction to a lower-than-expected resource estimate for its gold project in Tanzania. We don't know much about CAN and do not have any intention at this time of following it at TSI, but as far as we can tell it is now being valued by the market at around 60% of its cash. In this case, the market is selling dollar bills for 60c and throwing in a 1M-ounce in-ground gold resource for free to sweeten the deal.
What are we doing?
In last week's Interim Update, we said:
"With regard to our own money management, we have been steadily buying gold stocks while trying to maintain a substantial cash reserve. This has involved picking away at stocks for which our conviction is highest and raising cash where there is reasonable liquidity and where our conviction is not as high."
This is still the case, although over the past two trading days we bought significantly more than we sold. This has led to a reduction in our cash percentage from around 30% to around 25%.
We might reduce our cash percentage further if prices continue to fall, but we will proceed slowly and methodically. There is no hurry, because good opportunities to buy will crop up for months after the gold-stock indices have made sustainable upward reversals.
Currency Market Update
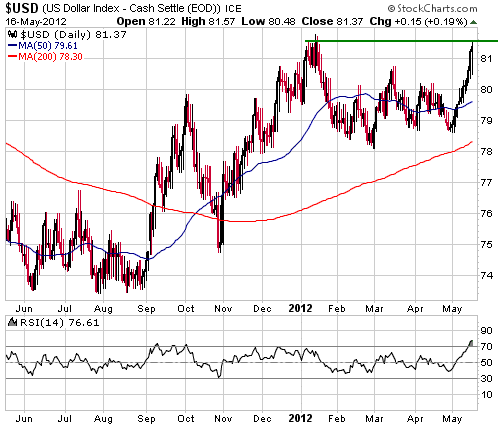
In the 23rd April Weekly Update, with the Dollar Index trading just above 79, we wrote:
"For the direction of the Dollar's next 2-3 point move to be to the upside, the S&P500 index will probably have to drop at least a few percent below its recent low. The reason is that in the absence of 'safe haven' demand stemming from significant stock market weakness, the Dollar Index will have difficulty making much headway in the face of the massive speculative short position in euro futures that continues to underpin the euro (the USD/EUR exchange rate is almost 60% of the Dollar Index, so strength in the Dollar Index requires weakness in the euro relative to the US$). We expect the covering of this short position to propel the euro to a new high for the year -- and the Dollar Index to a new low for the year -- during the next multi-week period of strength in the stock market.
If there is sufficient stock market weakness within the coming fortnight to push the Dollar Index up to 81-82, then we will probably downgrade our short-term US$ outlook to "bearish"."
It took a bit longer than a fortnight, but there has since been sufficient stock market weakness to push the Dollar Index up to 81-82. Furthermore, the Dollar Index has just risen for 13 trading days in a row and is now 'overbought' on a short-term basis.
With the stock market most likely nearing a short-term bottom, the speculative net-short position in euro futures back to its January high and the Dollar Index now extended to the upside, we are shifting our short-term US$ outlook to "bearish".
Note that this outlook change is not a call that the Dollar Index is at a top. Having come this far it would actually be a little surprising if the Dollar Index didn't move at least marginally above resistance defined by its January high, perhaps following a short pullback. It is, instead, an expression of our opinion that the Dollar Index's short-term risk/reward is now skewed decisively towards risk.
As far as the dollar's short-term performance is concerned, Spain is a wildcard. Credit Default Swaps on Spanish government debt have just hit a new all-time high, which means that investors are becoming increasingly nervous about the possibility of Spain's government being forced to default.
Update
on Stock Selections
Notes: 1) To review the complete list of current TSI stock selections, logon at
http://www.speculative-investor.com/new/market_logon.asp
and then click on "Stock Selections" in the menu. When at the Stock
Selections page, click on a stock's symbol to bring-up an archive of
our comments on the stock in question. 2) The Small Stock Watch List is
located at http://www.speculative-investor.com/new/smallstockwatch.html
 International Tower Hill Mines (AMEX: THM, TSX: ITH). Shares: 87M issued, 93M fully diluted. Recent price: US$2.63 International Tower Hill Mines (AMEX: THM, TSX: ITH). Shares: 87M issued, 93M fully diluted. Recent price: US$2.63
THM announced on Tuesday 15th May that its CEO (James Komadina) had resigned to spend more time with his family and that the company was slowing its rate of spending in order to conserve its cash.
All in all, this is good news. First, the spending slowdown makes sense in the current environment. It certainly would have made no sense for the company to continue spending as if it would always be able to tap the market for additional funds. If it spends its money judiciously, THM will be able to make reasonable progress with the development of its Livengood gold project and not have to return to the market with 'cap in hand' over the remainder of this year. Second, the former CEO had been spending money way too quickly and seemed to be hell-bent on taking the Livengood project through to production. Our preference is for a junior miner with a large project to take the project through to the Feasibility Stage and then sell to a major or mid-tier miner.
Having said that, we aren't surprised that the market took the news badly. After all, this is a market that is viewing almost all news as an excuse to sell. This is a market in which Pretium Resources (PVG), the company with the best combination of assets, management and balance sheet in the realm of exploration-stage gold stocks, sells off sharply after reporting another set of excellent drilling results.
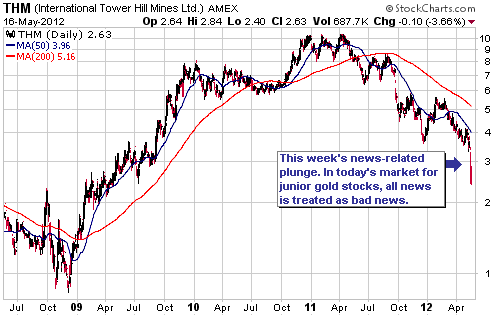
Chart Sources
Charts appearing in today's commentary
are courtesy of:
http://stockcharts.com/index.html
http://bigcharts.marketwatch.com/

|

