|
- Interim Update 16th June 2004
Copyright
Reminder
The commentaries that appear at TSI
may not be distributed, in full or in part, without our written permission.
In particular, please note that the posting of extracts from TSI commentaries
at other web sites or providing links to TSI commentaries at other web
sites (for example, at discussion boards) without our written permission
is prohibited.
We reserve the right to immediately
terminate the subscription of any TSI subscriber who distributes the TSI
commentaries without our written permission.
Stockhouse Involvement
The only promotion we've ever
done for TSI is to provide one article every couple of weeks to a few
gold-focused web sites. These articles generally take the form of short
extracts from the TSI commentaries.
Starting next week, however, we will be part of the editorial team at
Stockhouse.com, which simply means that Stockhouse will also display
the articles that we regularly send to the gold web sites. We've also
committed to provide Stockhouse with one exclusive article per month.
We won't be getting paid to write anything for Stockhouse, but TSI will
hopefully benefit from the extra exposure (Stockhouse is Canada's
largest financial web site with over 1 million unique users and 80
million pageviews per month).
Please be assured that our involvement with Stockhouse will not detract
in any way from the service provided at TSI. All we will be doing, in
addition to what we are already doing, is providing Stockhouse with a
monthly article.
Here is a link to an article by Jeff Berwick, Stockhouse.com's chief
editor, in which he introduces the newsletter writers who will be
featured at Stockhouse: http://www.stockhouse.ca/shfn/editorial.asp?edtid=17170
The Hedge Fund Economy
Some of the strange
linkages we've seen in the markets over the past 15 months and the
absurd extremes recently hit by some popular technical indicators can,
we think, be at least partially attributed to the proliferation of
hedge funds. In theory the thousands of hedge funds that now exist
should be a balancing force in the markets -- they should act to make
the markets more efficient -- because in many cases they are looking to
exploit situations where the markets have temporarily moved 'out of
whack'. In reality, though, there appears to be an enormous amount of
trend-following going on, with the hedge-fund community piling into,
and then out of, trades in the same way that a herd of wildebeest might
stampede in one direction and then suddenly change course upon the
sighting of a lion.
One of the biggest influences on the markets over the past year was the
putting-on and subsequent unwinding of carry trades (borrowing at a low
rate and then 'investing' the proceeds in something that is expected to
earn a higher rate). Specifically, speculators borrowed large sums of
US dollars with interest rates at generational lows and exchanged the
dollars for higher-yielding currencies. They also used the borrowed
dollars to purchase investments that would likely benefit from the
inflation that was clearly raging behind the scenes. And as long as the
Fed was talking-up the prospect of DEFLATION, or, at least, refusing to
acknowledge any INFLATION, this seemed to be a riskless trade. However,
as soon as it became clear that the days of a 1% Fed Funds Rate were
numbered there was a rush for the exits that caused sharp reversals of
the preceding trends.
The carry trades probably haven't been fully unwound, which is why we
get US$ strength combined with weakness in everything that benefits
from rising inflation (gold, for example) every time something happens
to CONFIRM the inflation. The reason is that the more visible the
inflation becomes the more likely it is that the Fed will be forced to
hike short-term rates aggressively and the less attractive the US$
carry trades will appear to be. It might not make sense, but this is
the thinking that seems to be permeating the markets right now.
The popularity of the carry trade with hedge funds has caused a
counter-intuitive response to inflation news over the past two years
(talk of a DEflation threat has caused gold to rally and the US$ to
fall whereas talk of an INflation threat has caused the US$ to rally
and gold to fall), but this is not the only area in which we are seeing
the footprints of the hedge fund community. The extremely high put/call
ratios discussed in last week's Interim Update are also, we think, the
result of hedge fund activity.
Very high values for the CBOE equity put/call ratio have historically
been associated with important market bottoms because when the volume
of put options is relatively high it is often a sign that the public is
very fearful; and when the public becomes convinced that the markets
are going to move in one direction the markets usually end up moving in
the opposite direction. The recent surge in the put/call ratio has,
however, occurred in the ABSENCE of fear. We know this because the
volatility indices have remained low, the bearish percentage reported
each week by Investors' Intelligence has remained low, and the NDX/Dow
ratio has not broken down. Therefore, what we are most likely seeing in
the equity-options market is hedge funds simultaneously buying and
selling large amounts of put options in order to pocket a 'spread'.
Statistics on equity-options trading are now dominated by trading in
QQQ (NASDAQ100 Trust) options, so the sort of trade that MIGHT be
boosting the put/call ratio would, for example, be the sale of tens of
thousands of QQQ September $40 put options and the concurrent purchase
of the same number of QQQ September $37 puts. Such a trade would have
the effect of pumping-up the put/call ratio, but it is not a fear-based
trade. It is, in fact, a bet that the market will move sideways or
higher over the coming few months. And it renders the put/call ratio
meaningless because we don't know whether the hedge funds that are
doing these trades should appropriately be classified as 'smart money'
or 'dumb money'.
Another newsletter writer's take
Franklin Sanders publishes "The Moneychanger" newsletter (www.the-moneychanger.com),
which focuses primarily on the gold and silver markets. In response to
something we wrote last week Franklin sent us an e-mail that provides
such an interesting perspective on why the markets are becoming
progressively more erratic that we decided -- after obtaining
Franklin's permission, of course -- to include the e-mail in today's
commentary. Here it is:
Dear Steve:
You wrote in your 6/9/04 Interim update:
"We always think of the
financial markets as pendulums, so this behaviour is not surprising in
itself, but what is strange is the way in which the markets have been
linked together and the way they are consistently reversing course
shortly after 'confirming' a direction."
I began thinking about
this during silver's startling March-April rise that blew past all my
expectations. Why? I think the explanation lies in (1) market
structure and (2) market participants.
(1) I am 56. When
my wife and I married in 1967, her first job was working in a stock
brokerage office as a secretary. Looking from today, you can
hardly imagine how primitive the conditions were, but more to the
point, how limited were the trading vehicles. There was, for
example, no readily available means to trade currencies.
None. Remember that silver trading only became possible after
1963, gold not until 1975. Later, during the 1970s, Susan was
also working for a stock brokerage when they began adding markets for
all sorts of things, interest rate futures, etc., which markets did not
before exist, outside specialty trading departments at huge
banks. The point is that the possibilities for speculation have
vastly increased in the last 30 years as market structure has enlarged
to accommodate trading. Of course, this includes the over the
counter derivatives revolution, which is the unseen part of the
market's structural iceberg. (Most market participants today,
those under 40 at least, have no idea that markets this slow and
limited once existed.) Today's market structure, then, encourages
more active trading and greater risk taking.
(2) Market participants
today have been trained (especially in University) to follow markets
more closely and work their money more intensively (trade more
frequently) and to take more and greater risks. The widening of
market structure has made frequent trading more economical. Not
only market professionals but also Joe and Bob trading a $10,000 stock
portfolio, listen to every broadcast of the financial media (of which
there are SEVERAL networks today which didn't even exist 20 years ago)
and they are whipsawed back and forth by the tidal wave of Internet
information. Huge new aggregations of money in the form of hedge
funds, apportioned by managers with a hair trigger for jumping from one
market to another, add to market volatility.
For all these reasons, I
believe that markets react more strongly to central bank/government
propaganda than ever before. They are also more volatile because
larger lumps of loose money managed by managers trained to trade more
frequently have more trading vehicles by which they can, like Pavlov's
dogs, hop onto the latest media- or government-hyped trend. This
helps explain the late surge in commodities, including gold and silver,
on a flood of news and focus pieces on Chinese development.
People read so many stories about Chinese demand that in their minds it
became large enough to soak up all the commodities in the world --
immediately -- so they all piled into commodities as the latest
investment fashion. Likewise, they reversed course when Greasepan
began hinting about raising interest rates, and that became their sole
focus and consideration. Likewise last fall and the fall before
they became concerned about an illusory "deflation" (maybe because of
the leaves turning brown?) in the face of the Fed's disinformatsia
campaign.
Where does this leave
us? The last 30 years developments in market structure and
vehicles, new market participants (hedge funds, smaller investors, and
more active central bank intervention) and market participant training
have made markets much more volatile, more liable to whipsaw, more
vulnerable to central bank & government propaganda, and much more
dangerous than ever before.
Best wishes,
Franklin Sanders
The Moneychanger
Bonds
Bond futures rocketed
higher on Tuesday, ostensibly because the US CPI was not as high as
many traders had feared. The result was that bonds broke out of the
steep downward-sloping channel in which they were mired over the
preceding 3 months.
This week's breakout
projects a move up to around 111, but keep in mind that all we are
seeing in the bond market is a counter-trend bounce (a retracing of
part of the March-May decline). Small traders have been betting heavily
on a continuation of the bond market's decline, meaning that a rally at
this time is 'par for the course' in order to get the weak hands to
cover their short positions before the next downward leg commences.
The US
Stock Market
Current Market Situation
The US stock indices that broke above downward trend-lines early last
week (the NASDAQ100, the S&P500, the NYSE Composite) have since
pulled back to these former trend-lines, while the indices that did not
break out to the upside (the Dow Industrials, the NASDAQ Composite)
remain just below their downward trend-lines. In other words, the
market is delicately balanced. Either last week's breakouts in some of
the indices were real and the others will soon follow suit, or last
week's breakouts were a 'trap' and the short-term downtrends are still
in force.
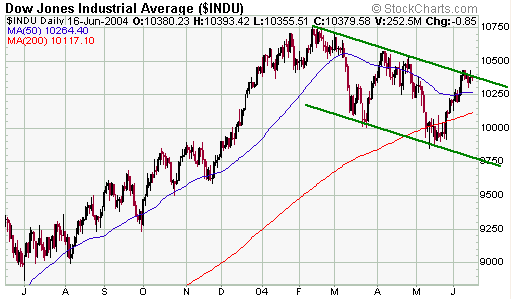
If the Dow Industrials and the NASDAQ Composite confirmed the recent
breakouts in the other indices it would point to a sizeable bounce in
the market over the coming month or so. For instance, if the Dow were
able to close decisively above the channel drawn on the below chart it
would create a technical target of around 11,000. We doubt that it
would get that high even if it did breakout because there is
substantial resistance in the 10,550-10,750 range that would likely cap
any advance, but two hundred points or so of additional upside would be
a reasonable bet if the Dow were able to break its downtrend.
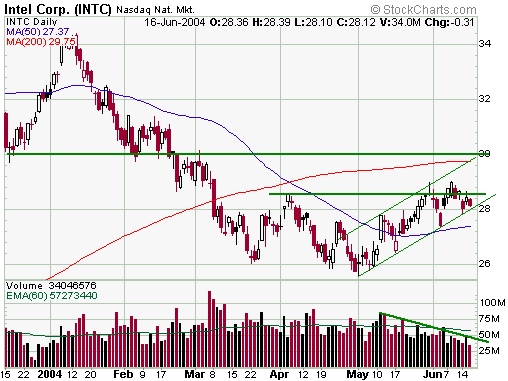
The below chart of
bellwether tech stock Intel (INTC) does a good job of illustrating how
finely balanced is the current situation. INTC has resistance at 28.50,
but while it managed to close above this resistance early last week it
has since fallen back. Also, there is a well-defined upward trend-line
just below yesterday's closing price. So, INTC is presently in a narrow
gap between resistance and support and the gap is getting narrower each
day because trend-line support is rising. One way or the other, INTC
will break out very soon (by the end of next week).
In our opinion, even
if the market breaks decisively higher in the near future it won't
alter the big picture. Instead, the difference between 'breakout' and
'no breakout' boils down to: a major peak is either already in place or
will be put in place via a rally to a new recovery high over the next
several weeks.
The ability, or otherwise, of the stock market to break higher in the
near-term will most likely be determined by what happens in the
currency market. Specifically, in this topsy-turvy world in which the
US$ weakens when outward signs of inflation subside, an upside breakout
by the Dow would most likely go hand-in-hand with US$ weakness. This
also means that an upside breakout by the Dow in the near future would
likely go with strength in gold and gold stocks.
Given our expectation that the US$ will test its February low within
the next 1-2 months we think the odds favour a bit more short-term
strength in stock market, but if we are wrong about the Dollar then the
stock market's rebound is probably going to fail near its current level.
The S&P500 versus Gold
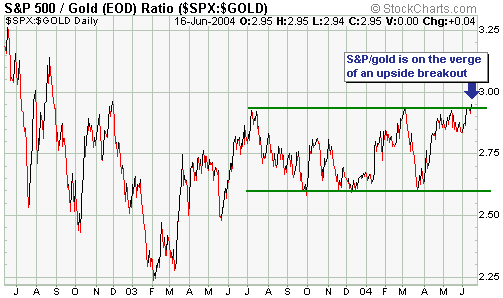
As is the case with many stocks, indices and markets right now, the
S&P500/gold ratio is presently 'on the edge'. Either the rally in
the S&P500 Index relative to gold is going to fail at its current
level or there is going to be an upside breakout in the days ahead. In
the grander scheme of things, though, it wouldn't make any difference
if S&P500/gold managed to breakout to a new recovery high in the
near future. This is because the rally in this ratio over the past 16
months is almost certainly of the bear-market variety, breakout or no
breakout. However, the short-term picture would obviously be affected.
Oil and the Stock Market
The ratio of the Dow Transportation Average and the Dow Industrials
Index (TRAN/INDU) continues to push higher, and this is evidence that
an important peak is in place in the oil market.
Gold and
the Dollar
Gold Stocks
In the latest Weekly Update we included a chart of the gold price to
show that if we ignore the surge during the second half of March then
the gold price appears to have moved lower within a reasonably well
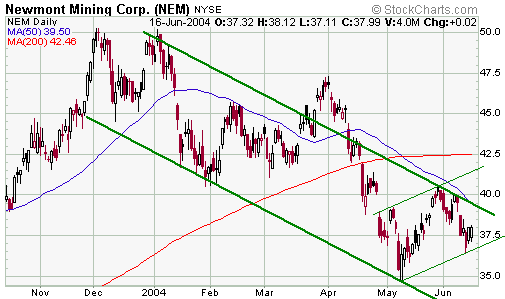
defined channel since the beginning of this year. Below we've done the
same thing with a daily chart of Newmont Mining (NEM), that is, we've
drawn the channel that best fits the price action if the fake-out rally
in late March is ignored. We are doing this to provide a different
perspective.
Note that Monday's low for Newmont MIGHT have helped define the bottom of a shorter-term UPWARD-sloping channel.
Almost all gold
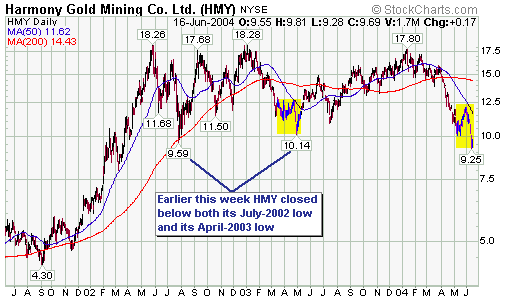
stocks were weak on Monday on below-average volume, but Harmony Gold
(HMY) was much weaker than most and also traded more than two times its
average daily volume. Furthermore, as a result of Monday's decline HMY
became the first major gold stock to breach its July-2002 low (refer to
the 3-year chart below). It has subsequently moved back above this
level, but some technical damage has been done.
HMY is not part of
the TSI Stocks List, but it is a stock we've thought would make a good
long-term investment and we were therefore more than a little
interested to find out why it fell so sharply earlier this week. We
aren't, however, aware of anything happening with the company that
would explain the weakness. There was a rumour floating around that HMY
was going to make a bid for Oxus Gold PLC, but even if this rumour
turned out to be true it wouldn't explain the sell-off because Oxus
wouldn't be a large acquisition for a company of Harmony's size.
The only thing we can come up with is that the persistent Rand strength
combined with weakness in the US$ gold price on Monday prompted a mini
panic in the shares of the most leveraged of the major South African
gold miners. In this respect we might now be seeing something similar
to what happened in April of 2003.
During the first half of 2003 virtually all major and mid-tier gold
stocks bottomed in March, with HMY being a notable exception. As
highlighted on the above chart, HMY spiked well below its March-2003
low during the second half of April-2003. This final downward spike by
HMY was in response to extreme weakness in the Rand gold price -- the
below chart shows that the Rand gold price bottomed during the last
week of April 2003 -- but interestingly Harmony was the ONLY South
African gold stock to make new lows at that time. That's why we say
that something similar might now be 'on the go'.
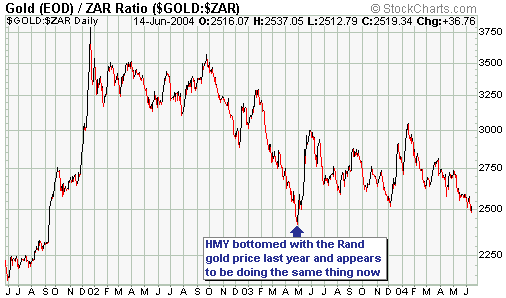
It looks like HMY is
going to be a phenomenal performer once the Rand gold price turns
higher in earnest, but is going to remain under pressure until that
happens.
Current Market Situation
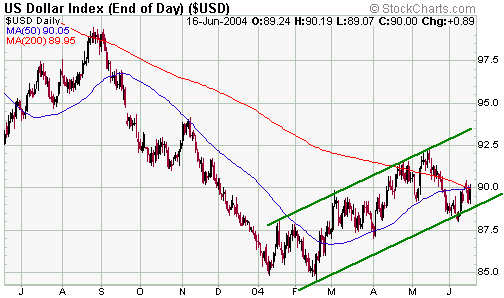
Below is a daily chart of the Dollar Index. A couple of weeks ago it
looked like the Dollar Index had broken down through the bottom of the
up-channel that began to form early this year, but subsequent price
action indicates that a breakdown has not yet occurred.
As at the close of trading on Wednesday the Dollar Index was just below
its 50-day moving average. This is a likely place for the recent Dollar
rebound to fail if, in fact, it is going to fail.
There are usually a
number of ways to interpret the same price chart. On the below daily
chart of August gold futures, for example, the pullback over the past
two weeks could be interpreted as being a bullish 'flag' within a
continuing short-term upward trend. Alternatively, a bearish
interpretation would be that gold has butted its head up against the
18-day moving average on three of the past four trading days without
being able to achieve a daily close above this moving average.
Our near-term view is that gold might drop to around $380, but shouldn't drop significantly lower than that.
Update
on Stock Selections
 We
recommended exiting American Bonanza (TSXV: BZA) last November at
C$0.45 due to concerns about its relative valuation (at that time it
was expensive relative to many of the other exploration-stage gold
stocks we follow). However, at yesterday's closing price of C$0.17
those concerns no longer exist. We
recommended exiting American Bonanza (TSXV: BZA) last November at
C$0.45 due to concerns about its relative valuation (at that time it
was expensive relative to many of the other exploration-stage gold
stocks we follow). However, at yesterday's closing price of C$0.17
those concerns no longer exist.
BZA currently has a market cap of around C$34M. Also, it has no debt
and about C$14M in cash, so its enterprise value is only C$20M. This is
low for a company that has achieved the sort of drilling results
achieved by BZA at its Copperstone gold project in Arizona. Based on
previous drilling results Copperstone will probably turn out to be a
very high grade 1M+ ounce deposit. Furthermore, drilling is continuing
at a frenetic pace with the aim of making a production decision next
year, so there should be plenty of news-flow from the company over the
remainder of this year.
We have no immediate plans to return BZA to the TSI Stocks List -- we
already have more than enough exploration-stage gold stocks in the List
-- but wanted to highlight the attractiveness of this stock near its
current price. The exercising of warrants that expired earlier this
month is probably contributing to the downward pressure on the stock
right now and if this is the case there should be a nice bounce as soon
as these warrant-related shares are sold.
 In early May, Aquiline Resource (TSXV: AQI) announced that an updated
resource estimate for its Calcatreu gold project in Argentina would be
available by 15th May and that a scoping study would be complete by the
end of May. At this stage, though, the aforementioned reports have not
been issued.
We never like it when a company delays the announcement of results
because it is usually only bad news that comes late, but in this case
the delays are in large measure because the industry is straining at
capacity and the consultants have all over-committed. AQI's consultant
(Micon) will hopefully provide the updated information within the next
few weeks and we doubt that it will contain any negative surprises.
Rather, we expect that the revised resource calculations and the
scoping study will confirm the attractive economics of the Calcatreu
project.
Chart Sources
Charts appearing in today's commentary
are courtesy of:
http://stockcharts.com/index.html
http://www.futuresource.com/

|

