|
- Interim Update
16th July 2014
Copyright
Reminder
The commentaries that appear at TSI
may not be distributed, in full or in part, without our written permission.
In particular, please note that the posting of extracts from TSI commentaries
at other web sites or providing links to TSI commentaries at other web
sites (for example, at discussion boards) without our written permission
is prohibited.
We reserve the right to immediately
terminate the subscription of any TSI subscriber who distributes the TSI
commentaries without our written permission.
A
potential melt-up in the Treasury market
Over the past 7 months, US Treasury (T-Bond and T-Note) prices
have worked their way higher and Treasury yields have worked their
way lower in the face of widespread belief that US interest rates
should be rising. There are good reasons to expect that this trend
will continue over the months ahead. In fact, the potential now
exists for accelerated moves upward in Treasury prices and downward
in Treasury yields.
The most obvious reasons to expect T-Bond and T-Note yields to
continue their current downward trends are sentiment (despite the
price action, a lot of speculators have stubbornly maintained their
bets on higher US Treasury yields) and the likelihood that stock
market weakness over the next few months will boost the demand for
the perceived safety offered by the Treasury market. There are,
however, two other potential drivers of higher Treasury prices and
lower Treasury yields.
The first of these other potential drivers is greater recognition
that, near current yields, 10-year and 30-year US Treasuries are far
more attractive than the bonds issued by the governments of
peripheral euro-zone countries such as Portugal, Spain and Italy.
Due to the dramatic narrowing of spreads between the yields offered
by US Treasuries and the yields offered by peripheral euro-zone
government bonds, as well as to +the euro-zone banking problems that
have just begun to surface, there could be a flight from higher-risk
government bonds to US Treasuries.
The second potential driver is related to part of an
article posted at ZeroHedge on 12th July. We are referring to
the possibility that as a result of so much supply having been
absorbed by the Fed's QE, a temporary shortage is developing in the
supplies of T-Bonds and T-Notes used as collateral. The Fed has been
attempting to address this temporary shortage via "Reverse Repos",
that is, by swapping some of the Treasuries it holds on its balance
sheet for money and bank reserves, but the total dollar value of
these "Reverse Repos" is likely to remain too small to have a
significant effect on either the supply of Treasuries available for
use as collateral or the supply of money.
If collateral strains associated with reduced supply of Treasuries
within the private banking industry are going to cause upward
acceleration in Treasury prices and downward acceleration in
Treasury yields, then September (the last month of the third
quarter) is the most likely time for it to happen. The reason, as
discussed in a
9th July post at David Stockman's blog, is that banks often
pare-back securities lending and rein-in collateral at the ends of
quarters to make their books look good for investors and regulators.
The bottom line is that betting against the T-Bond still looks like
a bad idea.
The Stock Market
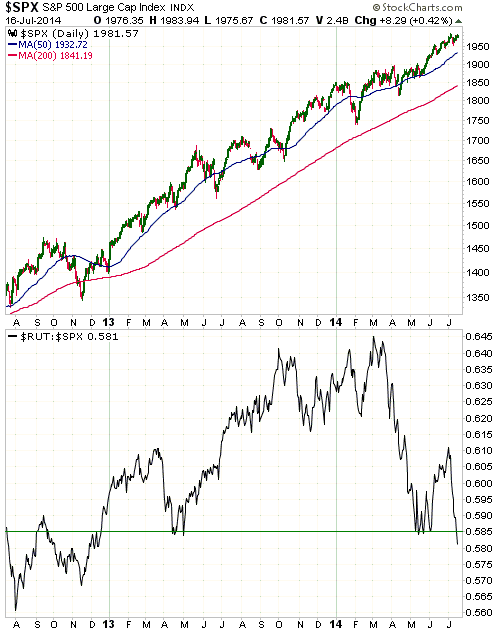
The top section of the following daily chart shows that the
S&P500 Index (SPX) is continuing to gradually work its way upward. It ended
Wednesday's session near its early-July all-time high.
The bottom section of the same chart shows that the RUT/SPX ratio just fell to
its lowest level in more than 18 months.
Because the SPX has ignored the relative weakness in small-cap stocks to date,
most people are probably now dismissing the warning signal being sent by the
RUT/SPX ratio. While it is certainly possible that the warning signal will turn
out to be an innocuous rotation out of the relatively pricey small-cap end of
the US stock market (the RUT currently trades at 78-times 12-month trailing
earnings, compared to 'only' 19-times for the SPX), we think that it should be
heeded.
Gold and the Dollar
Gold
Typically ignorant gold market commentary
In the latest Weekly Update we pointed out that the commercial position in the
futures market is simply the opposite of the speculative position. Consequently,
it isn't possible for speculators to increase their long exposure to COMEX gold
futures unless commercials increase their short exposure. This means that when
speculators, as a group, recently piled into long positions in gold futures, it
was a mathematical necessity that at the same time there be a rapid increase in
the commercial net-short position. Furthermore, we can be sure that speculators
were the drivers of this process because the price went up along with the
speculative buying, as it almost always does. We are returning to this topic
today due to an
article posted at Mineweb.com on Monday.
Apart from a quote by Doug Casey*, the above-linked article is total nonsense
from start to finish. Its central idea is that the recent rapid build-up in the
commercial net-short position in Comex gold futures is evidence of commercial
traders positioning themselves to profit from a large decline in the gold price,
in similar fashion to the way they positioned themselves to profit from the
large gold-price decline that occurred in April of last year.
The reality is that large price declines in the gold market have always, and
will always, go hand-in-hand with the commercials becoming less 'short' or more
'long', because large price declines always go with speculative selling. Just as
speculators, as a group, can't increase their long exposure to gold futures
unless commercial traders increase their short exposure, speculators, as a
group, can't liquidate their longs unless commercials liquidate their shorts. To
repeat: one is a simple offset of the other, with speculators in the driving
seat.
The above-linked Mineweb piece is full of silly comments, but the silliest
comment of all is reserved for the final paragraph. We are referring to this: "The
big money is totally profit oriented so those with it have the power to sell
short, drive the price down and then repurchase at far lower prices and allow
the prices to rise again and profit on the upside accordingly." We could
write an entire article dealing with the errors in this one sentence, but we
won't; we'll summarise. First, every rational participant in the financial
markets is "profit oriented". Second, having access to a lot of money and being
profit oriented does not give a trader the power to make prices do whatever he
wants. Even the central bank, which has unlimited access to money, often has
trouble making prices cooperate in the short term and has never been successful
at controlling prices over long periods. Third, unfortunately for the "big
money", in the real world it isn't possible to drive a major financial market
down via aggressive short selling and then cover the short position while the
price remains low. Covering the short position will drive the price right back
up again. Sometimes the price rise fueled by short covering will be less than
the price decline fueled by the prior shorting, but at other times it will be
more. On average, the profit from such a strategy will be ZERO.
In any case, we can tell from the relationship between price changes and changes
in net positions that it's the speculators and not the commercials that are
driving the gold market.
*In a recent interview with Kitco, Doug Casey apparently
described the gold price suppression scenario put out by organisations like GATA
as ridiculous.
Current Market Situation
The most sensible way to view the Commitments of Traders (COT) information is as
a sentiment indicator. Short-term price rises are driven by speculative buying,
but a rapid increase in the speculative net-long position is indicative of
bullish sentiment being temporarily stretched and the market being short-term
'overbought'. Such a development doesn't ensure a significant price decline, but
it makes the market acutely vulnerable to such a decline.
This is especially the case during the early stages of a new cyclical bull
market, when confidence tends to be fragile. After it becomes clear to a
critical mass of market participants that the direction of the major price trend
is upward, there will be times when the price makes meaningful additional
short-term gains after the market becomes very 'overbought'. However, this
usually won't happen during the early stages of a major upward trend. For this
reason, trend-following speculators who buy in reaction to upside breakouts and
sell in reaction to downside breakouts have struggled to make money with gold
and gold-mining stocks over the past 7 months and will probably continue to
struggle for many months to come (they will get 'whipsawed' more often than
usual).
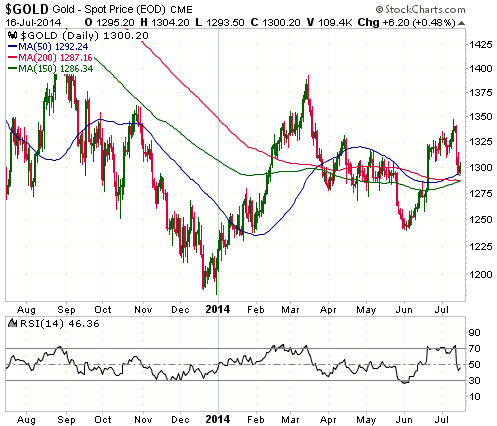
At the end of last week there were multiple signs that the gold market was
sufficiently 'overbought' on a short-term basis to bring about a significant
pullback in the price. For example, in addition to the rapid preceding build-up
in the speculative net-long position in COMEX gold futures, the daily RSI(14),
our favourite momentum indicator, was warning that gold, silver and the
silver/gold ratio were close to short-term extremes. Consequently, it would have
been surprising if gold and silver had made meaningful additional headway
without first experiencing some 'corrective' activity. As noted in the latest
Weekly Market Update, the $1290s was a realistic target for a pullback low in
the gold price.
Further to the above, there was nothing untoward about gold's price action over
past three trading days.
The gold price was probably close to a pullback low when it traded at $1292
earlier this week, but the speed of the decline makes it likely that the $1280s
will be visited before an advance to new multi-month price highs gets underway.
This is because the 150-day and 200-day moving averages are still in the $1280s.
A more gradual pullback would have allowed this moving-average support to rise
by enough to meet the market price in the $1290s.
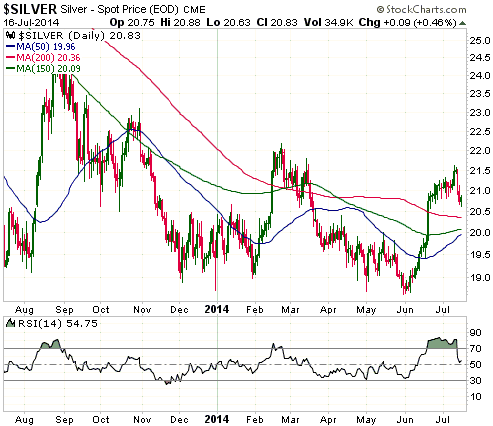
In the silver market, short-term support lies at $19.90-$20.40. This support
will probably be tested before the correction ends.
Gold Stocks
Current Market Situation
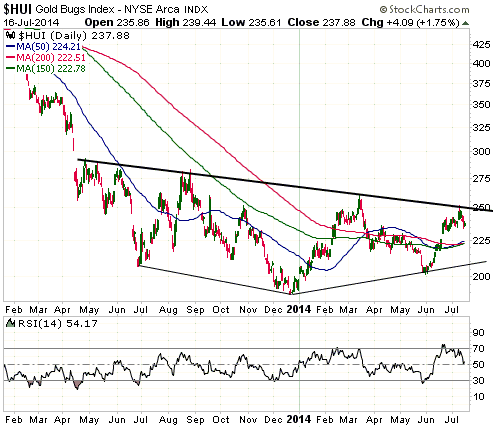
At the end of last week the HUI, the XAU and GDXJ were short-term 'overbought'
and close to major resistance. Unsurprisingly, they have begun to 'correct' the
rapid advances that got underway in June.
By taking the HUI's daily RSI(14) from 'overbought' territory (>70) to neutral
territory (around 50), this week's market action has already achieved the
minimum requirement for a routine short-term correction. However, the relative
weakness in the junior gold stocks on Wednesday 16th July suggests that the
correction is not over.
It's reasonable to expect that the HUI will spend 1-3 more weeks in the 225-250
range before resuming its rally.
A long-term look at juniors relative to seniors
As far as we know, there aren't any indices or funds similar to GDXJ that have
been around for a few decades. It is therefore difficult to determine how junior
gold stocks performed relative to senior gold stocks over the long-term,
including how they performed during the gold bull market of the 1970s. However,
Nick Laird of Sharelynx.com has just created charts that show the performance of
the Barrons Gold Mining Index (BGMI), a proxy for senior gold stocks, relative
to USERX going back as far as 1975. USERX, a gold-stock-focused mutual fund,
isn't an ideal proxy for the junior end of the gold-mining universe, but for
assessing the long-term record it's probably the best available.
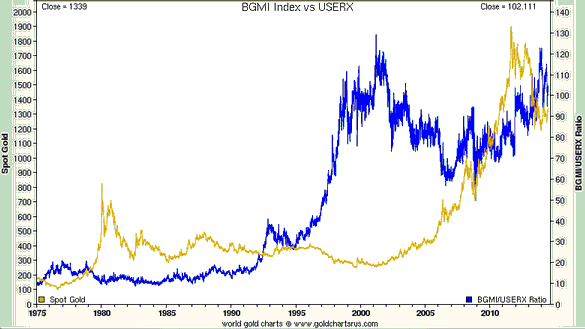
The following BGMI/USERX chart shows the entire period from 1975 through to the
present. The main points to be gleaned from this chart are:
1) The high for the BGMI/USERX ratio at the end of last year was similar to its
high in early-2001. In other words, juniors were roughly as cheap relative to
seniors at the end of last year as they were at the beginning of the secular
bull market.
2) After bottoming-out relative to the seniors in early-2001, junior gold stocks
outperformed, in fits and starts, for about 5 years.
The next BGMI/USERX chart zooms in on the 1975-1985 period. It therefore allows
us to more clearly see the performance of juniors relative to seniors during the
huge 1977-1980 gold rally. The main takeaways are:
1) There was a strong rebound in the juniors relative to the seniors during the
first 12 months of the 1977-1980 cyclical bull market, followed by a 12-month
period in which the seniors outperformed.
2) The juniors were very strong relative to the seniors during the final 14
months of the gold bull market that ended in January of 1980.
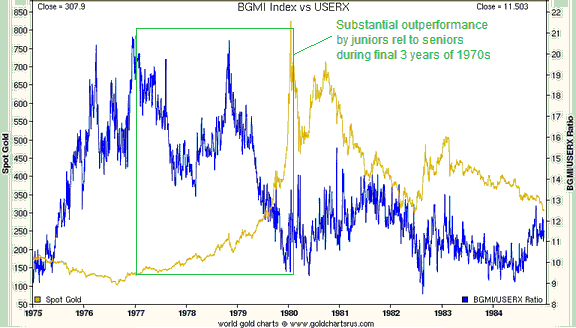
The above charts suggest that the juniors will generally outperform the seniors
until a major peak is reached in the gold market, although within this long-term
trend favouring the juniors there will be one or more lengthy periods when the
seniors are relatively strong.
The Currency Market
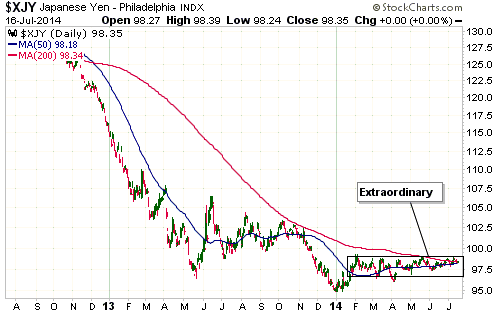
The recent lack of volatility in the S&P500 Index is nothing compared to the
recent lack of volatility in the Yen, although the two are undoubtedly related.
The Yen's lack of volatility is illustrated below.
Minor oscillations around horizontal lines are what should happen to the rates
of exchange between major currencies. However, in a world where all the major
currencies are fundamentally unsound, meaning that they regularly experience
large swings in the rates of growth in their supplies and are routinely
manipulated by central banks to achieve absurd policy goals, a flat-line
performance over several months is extraordinary.
We expect that the Yen's volatility will increase shortly after the S&P500 Index
commences a meaningful decline, with Yen strength coinciding with S&P500
weakness.
Updates
on Stock Selections
Notes: 1) To review the complete list of current TSI stock selections, logon at
http://www.speculative-investor.com/new/market_logon.asp
and then click on "Stock Selections" in the menu. When at the Stock
Selections page, click on a stock's symbol to bring-up an archive of
our comments on the stock in question. 2) The Small Stock Watch List is
located at http://www.speculative-investor.com/new/smallstockwatch.html
Chart Sources
Charts appearing in today's commentary
are courtesy of:
http://stockcharts.com/index.html
http://www.sharelynx.com/

|

