![]()
![]()
![]()
![]()
- Interim Update 16th September 2015
Copyright
Reminder
The commentaries that appear at TSI
may not be distributed, in full or in part, without our written permission.
In particular, please note that the posting of extracts from TSI commentaries
at other web sites or providing links to TSI commentaries at other web
sites (for example, at discussion boards) without our written permission
is prohibited.
We reserve the right to immediately
terminate the subscription of any TSI subscriber who distributes the TSI
commentaries without our written permission.
Three events to be
aware of
1) The FOMC Meeting on 17th
September. Guesses regarding what the Fed is going to do have overshadowed all
other considerations over the past few days and the reaction to what the Fed
does will probably overshadow all other considerations over the balance of this
week.
2) The elections in Greece on 20th September. Amazingly, the goings-on in Greece
still have the potential to roil the major financial markets.
3) Inter-party haggling over the raising of the US government's debt limit,
which is likely to
come to a head in November. Absent an agreement regarding a higher debt
limit, at some point in November or December the US federal government will
become unable to meet all of its financial obligations, resulting in the next in
a long line of government-shutdown threats.
A sign of weakness
We strongly believe that the Fed
should hike its targeted overnight interest rate later today (17th September),
but the odds are slightly skewed in favour of no interest-rate move. The reason
is that if the Fed hikes and there is another sharp decline in the stock market
and/or a turn for the worse in the economic data, the trivial interest-rate
change will be incorrectly blamed for causing the downturn just as the Fed's
decision to boost bank reserve requirements in 1937 came to be
incorrectly blamed for the economic collapse of 1937-1938. We suspect that
the Fed will want to avoid this risk. Don't get us wrong, when the US economy
plunges into another severe recession in 2016 or 2017 the Fed will deserve the
bulk of the blame, but not because of any moves to tighten monetary policy.
If the Fed chooses not to hike, stock-market bulls will breathe a sigh of
relief. However, the initial relief could be followed by the realisation that
the Fed's reticence to take even a single tentative step along the 'normalisation'
path is a sign of weakness. After all, if they aren't going to begin edging away
from ZIRP now, with the US economy supposedly more than 6 years into a recovery
from the 2007-2009 "Great Recession" and the unemployment rate down to 5.1%,
then when are they going to do so? To put it another way, if the economic and
financial-system backdrops are still so precarious that even an interest-rate
shift from zero to a tiny bit higher than zero is unjustified, then what on
Earth is there to be bullish about? Consequently, an upward reaction by the
stock market to news that the Fed was standing pat could be very short-lived,
while an upward reaction by the gold market could be more sustainable.
However, the short-term market situation is far from straightforward. First,
there is still great uncertainty as to what the Fed will do this week. Second,
there will be nuances in the wording of the FOMC Statement that could counteract
the interest-rate decision. For example, the 'blow' of an interest-rate hike
could be cushioned by assurances that the Fed is hell-bent on remaining
accommodative, while the temporary feelings of comfort that would stem from a
decision not to take immediate action could be cancelled-out by assurances that
the plan is still to begin the rate-hiking process as soon as practicable.
Third, even if we knew for sure what the Fed was going to do, we wouldn't be
certain about how the markets were going to perform beyond the obvious knee-jerk
reactions. For example, to us it is clear that a decision to take no action at
this time would be a blatant sign of weakness that should help gold and do
nothing for the over-valued S&P500, but many other traders could come to a very
different conclusion.
There's nothing to do now but wait for the price of short-term credit to be
handed down from on high and then assess both the knee-jerk market reaction and
the likely knock-on effects. We will naturally be devoting some space in the
Weekly Update to such assessments.
PennTrade Change
PennTrade (PT), a US-based
stockbroker that provides on-line access to the US and Canadian stock exchanges,
is transferring its business to Paulson Investments. We know nothing about
Paulson Investments and therefore have no opinion about it. The transition will
apparently take 3-4 months, during which time PT's customers will not have
on-line access to their accounts.
It has been several years since we used PT. This wasn't by choice -- we were
forced to stop using them when we moved to Malaysia, because their clearing firm
wouldn't accept accounts from residents of Malaysia. However, some of our
readers use PT, primarily (we believe) to gain on-line access to the Canadian
markets. That's the reason for this note.
If we still had an active PT account we would transfer everything from this
account to InteractiveBrokers.com (IB). IB's trading platform is better than
PT's in multiple ways, including ease of use, access to real-time price
information, access to numerous markets around the world, the ability to do FX
transactions and the ability to hold cash reserves in different currencies.
We use IB for most of our US trading and some of our Canadian trading. We also
have an account with a full-service off-line broker in Canada (Canaccord), via
which more than half of our Canadian trading is done. In addition, we have an
account with a full-service off-line broker in Australia (Bell Potter), via
which more than half of our Australian trading is done, and an account with
TD Direct Investing in
Luxembourg, via which we trade stocks in a few different markets around the
world. TD could be a good option for non-US citizens, but we don't know if it
accepts accounts from US citizens.
The Stock Market
The US
A day ago we
posted a chart at the TSI Blog to show that the SPX was 'coiling' in the
form of a triangular price pattern ahead of the Fed meeting. We guessed that
there would be an upside breakout from the triangle prior to a downward
reversal.
The SPX broke out to the upside on Wednesday. Also, the following chart shows
that the NASDAQ100 Index (NDX) has broken above short-term lateral resistance
and is now challenging its 200-day MA.
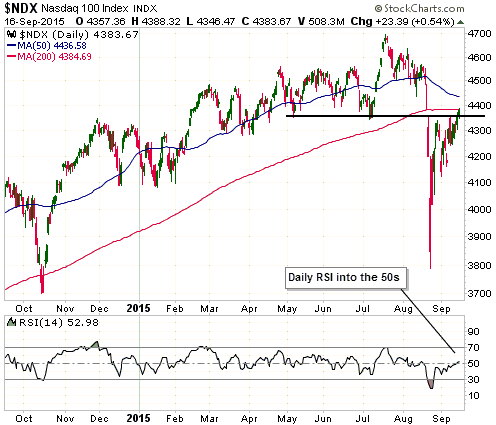
The SPX and the NDX will possibly build on the aforementioned breakouts in
reaction to the Fed news on Thursday, but our short-term expectations will be
unchanged regardless of whether or not they do so. The reason is that there were
similar signs of strength during the multi-week rebounds that followed the
August lows of 1998 and 2011. Shortly after these signs of strength appeared,
the market reversed course and commenced a decline that would result in a test
of the August low in early-October. This is relevant because the US stock
market's recent price action has a lot in common with its price action during
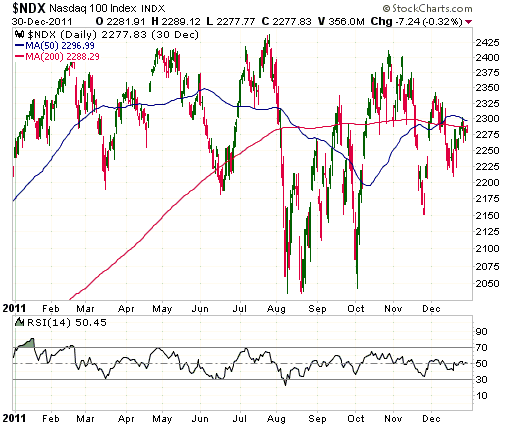
the downturns of July-October 2011 and July-October 1998.
The performance of the US stock market over the past two months has the most in
common with its performance during the same 2-month period in 2011, but the
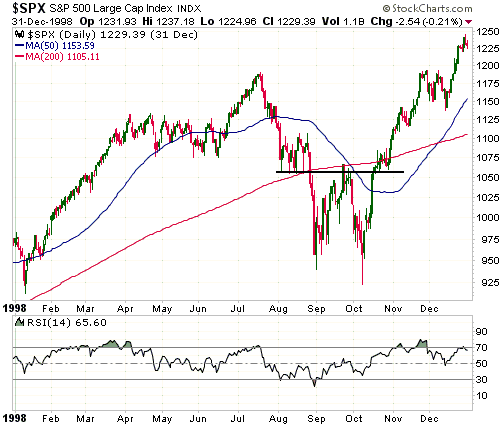
overall financial-market backdrop has more in common with 1998 than 2011. For
example, at this time in 1998 the Dollar Index had just turned down from an
intermediate-term peak, gold and gold stocks had just begun to rebound from
intermediate-term bottoms, by historical standards gold was cheap relative to
the S&P500, the prices of most commodities were at depressed levels, and
"emerging markets" were under extreme pressure. All of which sounds very similar
to the current situation. At this time in 2011, however, the Dollar Index was
near a major bottom, gold and gold stocks had just begun to decline from
intermediate-term peaks, by historical standards gold was expensive relative to
the S&P500, the prices of most commodities were at elevated levels, and
"emerging markets" were loved by the investing/speculating community. All of
which sounds completely different to the current situation.
Here's a chart that shows what happened to the NDX in 2011. A strong rebound
from the August low resulted in the NDX breaking above its 200-day MA in
mid-September, but the day after this breakout there was a downward reversal
that led to a test of the August low.
And here's a chart that shows what happened to the SPX in 1998. A strong rebound
from the August low resulted in the SPX breaking above short-term lateral
resistance in mid-September, but the day after this breakout there was a
downward reversal that led to a test -- and momentary breach -- of the August
low.
Of course, the strength that we are now seeing would also be consistent with the
view that a correction ended on 24th August and a rally back to the May-July
highs is in progress. This is not the most likely scenario, but it certainly
can't be ruled out.
Gold and the Dollar
Gold
As discussed earlier in today's report, there is still a lot of uncertainty as
to what the Fed will decide at its 17th September meeting. However, the markets
have no doubt that the Fed will embark on a rate-hiking program within the next
several months -- if not at the September meeting then at another meeting in the
not-too-distant future. This is evidenced by the following chart, which reveals
that the yield on the 2-year T-Note has just broken out to the upside and is now
at its highest level since 2011.
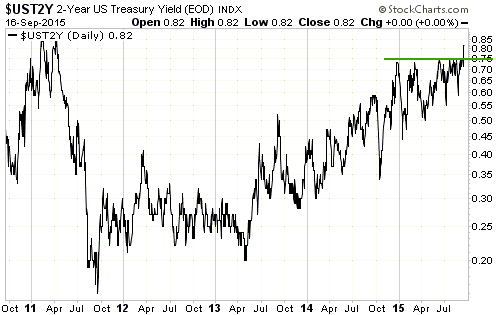
In the absence of something dramatic, such as a much bigger stock-market decline
than has occurred to date, a Fed rate-hiking program over the coming 12 months
is both likely and expected. This means that it has been discounted by the
currency, gold, stock and bond markets.
Market expectations about what the Fed is going to do over the coming 12 months
are unlikely to be affected to a meaningful degree by what the Fed announces
later today, although, as discussed above, a decision not to begin the
rate-hiking at this time could be viewed as a sign of weakness. With regard to
performance over the next few weeks, a decision not to hike could therefore be
far more helpful to gold than to the stock market.
Turning to the price action, the gold price rebounded to its 50-day MA on
Wednesday 16th September. With a constructive COT situation and an upward
reversal having just happened from comfortably above the July low, the stage is
set for gold's rally to resume in the aftermath of the FOMC news.
Note that a more bearish near-term outcome would be signaled by a daily close
below $1100.

Gold Stocks
To signal a trend change the HUI needed to build on last Friday's upward
reversal during the first two days of this week. Instead, it began this week
with two small down-days, with the price hovering around the August low
(104-105) and remaining a few points above last Friday's low.
On Wednesday there was another sign of strength, which means that the HUI is
again in a position to signal a trend change from down to up. To do so it must
gain significant additional ground over the final two days of this week. It
should also break solidly above its 50-day MA late this week or early next week.
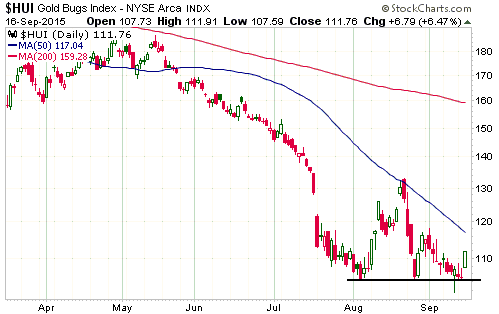
Just to be clear, a multi-week rebound could unfold in fits and starts, which is
pretty much what happened during the first two-thirds of the rebound that got
underway in early-November of last year. However, the early parts of
intermediate-term rallies and new bull markets are usually characterised by
powerful multi-day surges, as opposed to tentative
one-step-forward-followed-by-half-a-step-backward affairs.
Updates on Stock Selections
Notes: 1) To review the complete list of current TSI stock selections, logon at
http://www.speculative-investor.com/new/market_logon.asp
and then click on "Stock Selections" in the menu. When at the Stock
Selections page, click on a stock's symbol to bring-up an archive of
our comments on the stock in question. 2) The Small Stock Watch List is
located at http://www.speculative-investor.com/new/smallstockwatch.html
![]() Sabina
Gold and Silver (SBB.TO) publishes a new Feasibility Study (FS)
Sabina
Gold and Silver (SBB.TO) publishes a new Feasibility Study (FS)
SBB published a new FS for its Back River gold project (Nunavut, Canada) on
Monday. The previous FS was released in May-2015 and considered a 6K-tonne/day
(t/d) operation, whereas the new FS considers a smaller (3K-t/d) operation
focused on a higher-grade portion of the deposit. Our review of this news could
have waited until the Weekly Update as no urgent action is required, but since
the financial markets are quiet ahead of the Fed's decision we decided to put
the discussion in today's Interim Update.
The goal of the new FS was to arrive at a mine plan with a significantly-lower
initial Capex and better economics near the current gold price. This goal was
achieved. According to the figures presented in the two studies, the 3K-t/d mine
plan has better economics and is more easily financeable at $1100/oz than is the
6K-t/d mine plan at $1200/oz. Of particular importance, the estimated initial
capex has been reduced from US$556M to US$332M.
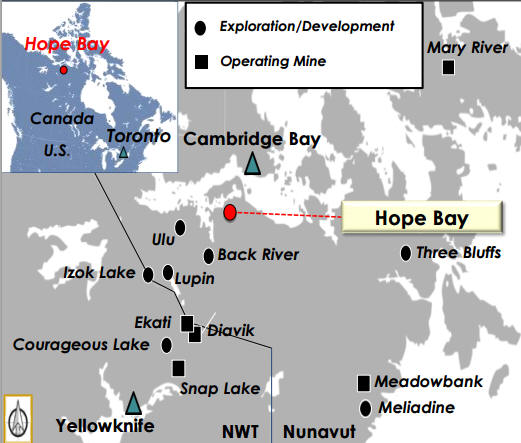
In addition to reviewing the economics of SBB's Back River project and the
resulting valuation of SBB's shares, we looked at the Hope Bay project of TMAC
Resources (TMR.TO) and the resulting valuation of TMR's shares. The reason is
that Back River and Hope Bay are development-stage gold projects of similar size
and location. The following map from
TMR's recent presentation shows the project locations.
With the 3K-t/d mine plan the Back River project appears to be viable at
$1100/oz, despite its remote location. This makes it a rare commodity, as very
few undeveloped multi-million-oz gold projects in Canada are economically-viable
near the current gold price. Also, with the smaller-scale mine plan there is
considerable value in SBB shares at the current gold price. We found this
encouraging, but not surprising. What did come as a surprise is that at current
stock and metal prices and considering only the values of their flagship
projects, TMR offers even more value than SBB. This is despite the fact that TMR
has a much higher enterprise value than SBB.
In an apples-to-apples comparison the Hope Bay project does not appear to be
better than the Back River project. In fact, the AISC at Back River is estimated
to be significantly lower than at Hope Bay (US$620/oz versus US$785/oz). The big
advantage of Hope Bay over Back River, and the reason that TMR offers slightly
better value than SBB considering only the values of their flagship projects and
despite TMR's much higher enterprise value (US$234M versus US$36M), is the
amount of money already spent at Hope Bay.
Newmont Mining (NEM), the previous owner of the Hope Bay project, spent hundreds
of millions of dollars developing infrastructure. The money that NEM sunk into
the project prior to selling it to TMR has substantially reduced the
pre-production capex that will have to be funded by TMR and substantially
improved the project's economics from the perspective of TMR shareholders.
So, should we swap SBB for TMR?
The answer is no. Before we explain why, here is a table comparing the salient
figures from SBB's May-2015 FS (the 6K-t/d mine plan) at a gold price of
$1200/oz, SBB's September-2015 FS (the 3K-t/d mine plan) at a gold price of
$1100/oz, and TMR's March-2015 PFS at a gold price of $1100/oz. All currency
figures are shown in US dollars, with a C$/US$ rate of 0.80 used in cases where
a currency conversion was necessary.
| Sabina Gold & Silver (SBB.TO) - 6K-t/d FS @ 1200 | Sabina Gold & Silver (SBB.TO) - 3K-t/d FS @ 1100 | TMAC Resources (TMR.TO) - PFS @ 1100 | |
| Project Name | Back River | Back River | Hope Bay |
| Location | Nunavut, Canada | Nunavut, Canada | Nunavut, Canada |
| Engineering Study / Date | FS, May-2015 | FS, Sep-2015 | PFS, Mar-2015 |
| Planned Mine Type | Open Pit + Underground | Open Pit + Underground | Underground |
| M&I Resource (oz) | 5.3M | 5.3M | 4.5M |
| Avg Resource Grade | 6 g/t | 6.3 g/t | 7.6 g/t |
| P&P Reserve (oz) | 3.6M | 2.5M | 3.5M |
| Metallurgical Recovery | 93% | 93% | |
| Strip Ratio | 7.2:1 | 10.5:1 | |
| Avg Annual Production (oz) | 352K | 198K | 160K |
| Cash Cost (per oz) | $535 | $534 | |
| All-In Cost (per oz) | $671 | $620 | $785 |
| Mine Life | 9.6 years | 11.8 years | 20 years |
| Initial Capital Cost (US$M) | 556 | 332 | 232 |
| Assumed Gold Price (US$) | 1200 | 1150 | 1100 |
| NPV (US$M) | 431 | 333 | 420 |
| IRR | 21.7% | 22.0% | 34.0% |
| Capital Payback Period | 2.2 years | 3.1 years | 1.7 years |
| Project Ownership Percent | 100% | 100% | 100% |
| NPV of Company Stake ($M) | 431 | 333 | 420 |
| Current Stock Price (US$) | 0.29 | 0.29 | 4.64 |
| Share Count (M) | 194 | 194 | 78 |
| Current Market Cap ($M) | 56 | 56 | 362 |
| Net Cash ($M) | 20 | 20 | 128 |
| Current Enterprise Value ($M) | 36 | 36 | 234 |
| EV/NPV | 8% | 11% | 56% |
| Current Discount to NPV | 92% | 89% | 44% |
| EV + Capital Cost (EVCC) | 592 | 368 | 466 |
| EVCC/NPV | 1.37 | 1.11 | 1.11 |
The EVCC/NPV ratio at the bottom of the table is the "bottom line". It is a
single measure of value that takes into account project economics, the current
market price of the shares and the amount of money needed to build a mine. The
lower the ratio, the better the value. The ratio will ideally be 1 or lower,
although there aren't many gold-mining stocks/projects for which the ratio is 1
or lower assuming a gold price of only $1100/oz.
TMR's EVCC/NPV ratio is the same as SBB's, but this ratio doesn't take risk into
account. Adding to TMR's relative value is the fact that it is further along the
development path than SBB and is fully financed to production in late-2016,
making it less risky. However, SBB has the advantage of owning a
potentially-valuable silver royalty on the Hackett River project owned by
Glencore. The value of this royalty is also not accounted for in the EVCC/NPV
ratio.
When we take into account the Hackett River royalty we think that the values
offered by SBB and TMR are roughly in balance. Both are good candidates for new
buying, with SBB offering the greater leverage to higher metal prices and TMR
offering the lower risk.
Our final comment is that given their relative strengths and project locations,
it would seem to make sense for TMR to buy SBB. Cash flow from Hope Bay could
then be used to fund the construction of Back River and the combined company
would eventually become a likely target for Agnico Eagle (AEM).
Chart Sources
Charts appearing in today's commentary
are courtesy of:
http://stockcharts.com/index.html
![]()