![]()
![]()
![]()
![]()
- Interim Update 16th September 2020
Copyright
Reminder
The commentaries that appear at TSI
may not be distributed, in full or in part, without our written permission.
In particular, please note that the posting of extracts from TSI commentaries
at other web sites or providing links to TSI commentaries at other web
sites (for example, at discussion boards) without our written permission
is prohibited.
We reserve the right to immediately
terminate the subscription of any TSI subscriber who distributes the TSI
commentaries without our written permission.
The Fed reaffirms its
counterproductive policy
The statement and forecasts
issued at the completion of the FOMC Meeting on 16th September reaffirmed
the Fed's plan to keep its targeted interest rates near zero for at least
two more years. According to the Fed this is being done to support the
economy, but the reality is that manipulating interest rates to
artificially low levels hinders economic progress.
In the real
world, the economic growth process begins with an increase in savings and
ends with an increase in consumption. Therefore, any actions that
discourage saving, such as pushing interest rates to well below where they
otherwise would be, must reduce the economy's long-term growth. In
addition, the suppression of interest rates leads to mal-investment and
thus the boom-bust cycle. It also enables relatively inefficient companies
to remain in business and in doing so brings about a general reduction in
profit margins.
However, in the back-to-front world of Keynesian
economics (the world in which all central bankers live), economic growth
is driven by increasing consumption. That's why central bank actions that
prompt people to consume more in the present are touted as providing
support to the economy.
Also of significance is that a
heavily-indebted government will benefit from central bank actions that
push interest rates downward. The Fed was never really independent of the
government and these days the Fed and the Treasury act as if they were a
single organisation. In other words, just like both major US political
parties have stopped pretending to care about the budget deficit and the
government's debt, the Fed has stopped pretending to be independent.
The Fed's commitments to keep interest rates near zero for a long time
and to tolerate more "inflation" in the future than was deemed prudent in
the past is bearish for the US$ and very bullish for commodity prices.
Unfortunately, in addition to hampering the US economy's long-term growth,
these commitments run the risk of creating a monetary crisis.
We may have to
adjust our economic roadmap
In early-June we presented the
following picture to explain, in rough terms, the path we expected the US
economy to take over the ensuing two years. Our thinking was that the bulk
of the economic rebound from an April-May trough would be complete by Q4
of this year, with possibly a little more strength during the first half
of next year in response to a multi-trillion-dollar infrastructure
spending bill. Also, we thought that the second economic recession of the
2020s would be underway by 2022. At this time there is no reason to change
our broad-brush outlook for the coming two years, but the risk is rising
that the final quarter of this year will involve a dip rather than the
levelling-off depicted below.
The above economic roadmap was based on four assumptions. The first
was that the severity of the economic contraction caused by the lockdowns
would result in a rapid rebound as soon as the re-opening process began.
The second was that aggressive monetary and fiscal stimulus measures would
continue until late this year. The third was that regardless of the
outcome of the elections in early-November, economic activity would be
given another artificial boost during the first half of next year by the
approval of a massive infrastructure spending program. The fourth was that
there would be too much rot in the economic foundations* to enable the
economy to remain on a growth path beyond mid-2021.
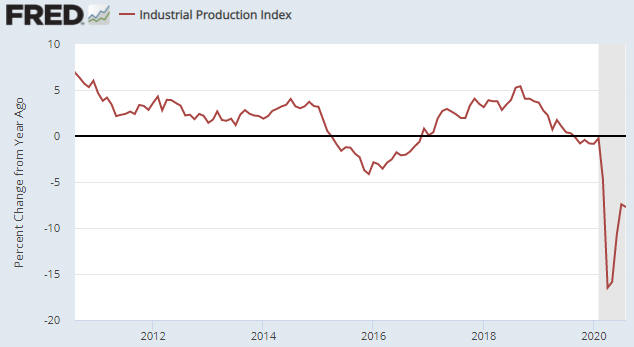
We know that
the first assumption was valid, in that a rapid rebound happened. As
evidence we cite the following chart, which shows that the year-over-year
change in the US Industrial Production Index rocketed upward from an
April-May trough. Also, we see no reason to question the third and fourth
assumptions. However, the second assumption is now in doubt.
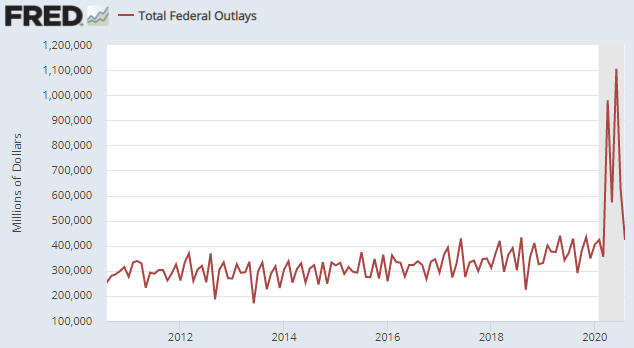
Over the past two months the Fed has added about $200B of securities
to its balance sheet, which implies that the Fed is creating new dollars
at the rate of around 100 billion per month. Furthermore, the Fed has
committed to at least maintain this pace over the months ahead. Although
this is a much slower pace of Fed money-pumping than occurred during
March-May, it still counts as aggressive monetary stimulus. However, the
following chart shows that the monthly pace of total US Federal Government
spending collapsed over the past two months to the extent that federal
spending in August-2020 (the last point on the chart) was roughly the same
as it was in August-2019.
The recent plunge in federal government spending would be a long-term
plus if it indicated a major strategy change, but what it indicates is a
temporary inability of the Republicans and the Democrats to agree on a new
fiscal stimulus package. It's reasonable to assume that a new fiscal
stimulus package will be approved at some point over the next few months,
but unless it is approved very soon (within the next couple of weeks
rather than 2-3 months from now) there probably will be a slowing of
economic activity in the short-term.
Therefore, rather than
essentially levelling-off for two or three quarters as indicated on our
current economic roadmap, there is a rising probability that the pace of
US economic activity will dip over the next few months before rebounding
during the first half of next year in response to both a new fiscal
stimulus package and an infrastructure spending program.
If the
change described above takes place it won't affect our intermediate-term
outlooks for any of the major financial markets. In particular, with
regard to the coming 6-12 months we still would be bearish on the US$,
bullish on gold and commodities, neutral on the US stock market and
bearish on the T-Bond. However, it would result in a bumpy ride in the
short-term, which is why the potential change is worth discussing.
Forewarned is forearmed.
*The rot is due to
mal-investment promoted by the Fed, damage to supply chains stemming from
business closures and restrictions on international trade, the bankruptcy
of numerous small businesses thanks to the lockdowns and social distancing
regulations, and the diversion of resources from the private to the public
sector caused by dramatic increases in government spending and
indebtedness.
The Stock Market
Over the past seven trading days
the S&P500 Index (SPX) has oscillated between its 50-day and 20-day moving
averages. This looks like a consolidation within a short-term correction.
If so, a decline to a new multi-week low (below 3300) will happen soon.
Note that a fairly normal correction would take the SPX down to the
vicinity of its 200-day MA, which at the moment is near 3100.
Given the economic backdrop, it's remarkable that the Dow
Transportation Average (TRAN) traded at a new all-time high on Wednesday
16th September. Refer to the top section of the following daily chart for
the details. What does this tell us about the future?
Well, the
last time the TRAN broke above lateral resistance to a new all-time high
was at around this time two years ago. After trading in new all-time high
territory for a few days in September-2018, the TRAN embarked on a large
(>20%) 3-month decline.
One positive difference this time is that
whereas the TRAN was in a weakening trend relative to the SPX in September
of 2018, the bottom section of the following chart shows that it has been
very strong relative to the SPX over the past four months. Another
positive difference this time is that monetary conditions were tight in
September-2018 and are extremely loose today.
The TRAN is
'overbought' and probably will commence a short-term correction very soon,
but a repeat of Q4-2018 does not appear to be on the cards. We are
expecting a normal correction.
Transportation wasn't the only 'cyclical' sector to strengthen on
Wednesday 16th September. Perhaps spurred on by the Fed's promise to
remain profligate for years to come, there was broad-based strength among
the 'cyclicals'. For example, the stock price of that old industrial
conglomerate General Electric (GE) reversed upward on heavy volume. We
don't have a direct financial interest in GE, but we suspect that it will
perform well over the next 12 months.
Gold and the Dollar
Gold
The "inflation"-adjusted gold price
Below are two long-term monthly charts showing the US$ gold price
adjusted for "inflation" (the US dollar's loss of purchasing power). The
first chart uses the CPI as the "inflation" measure and the second chart
adjusts for "inflation" using the method we developed in 2010.
Note: Our method of inflation adjustment is based on the theory that the
percentage reduction in a currency's purchasing power (PP) should, over
the long-term, be roughly equal to the percentage increase in its supply
minus the percentage increase in the combination of population and
productivity. Due mostly to the long and variable time from a change in
money supply to the associated change in PP, during any given month or any
given year the inflation adjustment estimated using this method probably
will be wrong. However, it should be approximately correct over periods of
7 years or more. It therefore is a big improvement over the CPI, which is
all but guaranteed to be very inaccurate over the long-term.
Both charts are interesting in their own ways.
The gold/CPI
chart shows that the 2011 high was slightly below the 1980 high and that
the August-2020 high (this year's monthly closing high-to-date) was
slightly below the 2011 high. In other words, on a very long-term basis
the CPI-adjusted US$ gold price has just made a triple top. This suggests
that some large gold speculators/investors are tracking gold/CPI and
selling as the 1980 high is approached. In other words, even though the
CPI is not a good measure of the dollar's PP loss, gold's long-term
performance in CPI terms appears to be important.
The chart that
reflects our method of inflation adjustment shows that this year's high
was well below the 2011 high, which, in turn, was well below the 1980
high. It also shows that in 'real' terms the gold rally since the
late-2015 low has been unimpressive to date. This could be viewed as
evidence that gold is not close to being 'overbought' on a long-term
basis.
Current Market Situation
Gold's price volatility in US$ terms has become unusually low. The
following chart shows that the price has been oscillating within a
shrinking range over the past month and that the average daily price range
has also shrunk. This implies that the market is coiling in preparation
for a tradable move in one direction or the other, but unfortunately the
price action does not indicate the most likely direction of this move.
If the Dollar Index (DX) is in the process of reversing upward on a
short-term basis, which currently appears to be the case, then the more
likely direction of gold's next meaningful move is down. This would be
signalled by consecutive daily closes or a weekly close below US$1920.
A break below US$1920 would confirm that a multi-month top was set in
early-August and pave the way for a correction low during
October-November.
Gold Stocks
The gold
mining indices/ETFs continue to mark time. A big move should commence
soon, but the direction of this move is unknown. The August-September
cycle suggests that the direction will be down, but the price action since
the early-August high looks more like a continuation pattern than a
reversal pattern.
For the HUI, short-term downside risk is defined
by lateral support near 260 and the 200-day MA. This implies that there
could be a decline of up to 25% within the next few weeks. A daily close
below the 50-day MA would warn that this scenario was playing out. On the
other hand, if the back-and-forth trading of the past six weeks proves to
be a mid-trend consolidation then a strong 1-2 month rally could be about
to begin.
Dealing with these very different short-term
possibilities is not difficult. Ideally, your 'core' exposure to the gold
mining sector will cover you against the bullish short-term possibility
and you will be hedged against the bearish short-term possibility by
virtue of having built up cash over the past 1-2 months and/or purchased
insurance in the form of put options.
The Currency Market
The global economy usually
looks more vibrant when the US$ is weakening. One reason is that a
weakening US$ encourages inflationary monetary policy outside the US. A
second reason is that a weakening US$ reduces the cost in local currency
terms of servicing US$-denominated foreign debt and incentivises
additional foreign borrowing of dollars. A third reason is that US$
strength tends to be symptomatic of a global shift away from risk and
towards the relative safety offered by the US bond and stock markets.
Consequently, an upside breakout in the Dollar Index (DX) from its
92-94 short-term trading range would warn that we were entering a more
negative 1-2 month period for risk assets, including industrial
commodities and commodity-related equities. By the same token, if the DX
breaks below the bottom of its 92-94 range it will warn that upward
acceleration in the prices of risk assets is likely over the ensuing 1-2
months.
At this stage a short-term upside breakout looks more
likely than a short-term downside breakout, whereas the intermediate-term
outlook for the DX continues to be decidedly bearish. Therefore, we think
it makes sense to have 'core' exposure predicated on US$ weakness while
being hedged against short-term US$ strength.
Updates on Stock Selections
Notes: 1) To review the complete list of current TSI stock selections, logon at
http://www.speculative-investor.com/new/market_logon.asp
and then click on "Stock Selections" in the menu. When at the Stock
Selections page, click on a stock's symbol to bring-up an archive of
our comments on the stock in question. 2) The Small Stock Watch List is
located at http://www.speculative-investor.com/new/smallstockwatch.html
Chart Sources
Charts appearing in today's commentary
are courtesy of:
https://stockcharts.com/
https://research.stlouisfed.org/
![]()