![]()
![]()
![]()
![]()
- Interim Update 17th February 2016
Copyright
Reminder
The commentaries that appear at TSI
may not be distributed, in full or in part, without our written permission.
In particular, please note that the posting of extracts from TSI commentaries
at other web sites or providing links to TSI commentaries at other web
sites (for example, at discussion boards) without our written permission
is prohibited.
We reserve the right to immediately
terminate the subscription of any TSI subscriber who distributes the TSI
commentaries without our written permission.
Oil Update
On Tuesday the oil price
initially moved higher when it was reported that representatives of Saudi Arabia
and Russia, the world's two largest oil producers, were in discussions regarding
oil supply. The gains were soon given back, though, when it was reported that an
agreement had been reached to freeze production at January-2016 levels. Freezing
production at a record high obviously does nothing to improve the fundamentals
driving the oil price.
In any case, we don't need to read/watch the news to know that supply/demand
fundamentals remain unsupportive for the oil price. All we have to do is look at
the spread between spot prices and futures prices in the oil market. The larger
the contango, that is, the higher the futures price relative to the spot price,
the more abundant the current supply and the less price-supportive the
fundamental backdrop.
Oil for delivery in about 6 months' time (July-2016) is currently $6.40/barrel,
or about 20%, more expensive than oil for immediate delivery onto the cash
market. This is very unusual. It means that if someone could buy physical oil
and store it cheaply they could make a risk-free annualised return of almost 40%
by simultaneously selling July futures contracts. The reason that every man and
his dog is not eager to do this trade is that the cost of storing oil is now so
high that even a contango that represents a potential 40% annualised return on a
physical-futures arbitrage is not very profitable. And the reason that the cost
of storing oil is now so high is that there is a much-greater-than-normal amount
of oil already in storage.
Unfortunately, knowing that there is an oil glut and, therefore, that the
fundamentals remain bearish doesn't tell us what will happen to the oil price in
the future. This is because the bearish fundamentals are very well known and are
factored into the current price. It is also because the fundamentals are always
bearish at major price bottoms in commodities markets.
We suspect that the oil price is close to a major bottom. This is because in
real terms it is now below its 1986 bottom and at its recent low was almost as
low as its 1998 bottom (the two lowest points of the past 40 years). It is also
because if stock markets have made long-term peaks then the commodities markets
are likely to be among the main beneficiaries of future monetary inflation.
However, it's very unlikely that there will be a 'V' bottom in the oil market.
Considering the short-term positive correlation between the oil price and the
S&P500 Index (see chart below) and the well-known bearish fundamentals, it's
more likely that the oil market will build a base this year involving a Q1
bottom and one or two successful tests of the bottom.
The Stock Market
The US
In last week's Interim Update, we wrote:
"Although the SPX's price action suggests that there will be a spike below
the 20th January low (1812) before the next multi-week bottom is in place, there
have recently been two positive developments in the US stock market. The first
is that the Dow Transportation Average (TRAN), which was relatively weak and led
to the downside from late-2014 through to 20th January of this year, has started
to show relative strength."
And:
"The other positive development is the recent divergence between the NASDAQ
Composite Index (NAS) and the NASDAQ's McClellan Oscillator (MO) illustrated by
the following chart. We are referring to the fact that this week's new price low
for the NAS coincided with a higher low for the NAS's MO."
We concluded as follows: "We expect that another multi-week rebound or period
of consolidation will soon begin, but there could first be spikes to new lows by
the SPX and some other stock indices."
The next day the SPX spiked below its 20th January low and then reversed upward.
It traded as low as 1810 last Thursday and is now (as at the end of the 17th
February session) at 1927, meaning that there has been a 117-point turnaround in
only 4 trading days.
TRAN continues to lead. Whereas the SPX is still comfortably below its 50-day
MA, the following chart shows that TRAN has decisively broken above this MA.
There is no evidence that the rebounds of the past few days are over.
Furthermore, due to the successful test of the SPX's 20th January low and the
extent to which the market was 'oversold' last week, there could be 1-3 months
of consolidation prior to the start of the next tradable decline.
At the same time, the SPX is nearing important resistance at 1950 and TRAN is
nearing even more important resistance at 7400. These levels will probably cap
the upside over the days immediately ahead.
The Emerging Markets
The Emerging Markets Equity ETF (EEM) has rebounded to trend-line resistance, MA
resistance (the 50-day MA) and within 50c of important lateral resistance. Refer
to the following chart for details. This means that a rebound peak could be
close in terms of both price and time.
Put Option Tactics
We took profits on all bearish positions (put options, in our case) near the
lows in mid-January and have since been waiting for the right time/price to
re-enter. With the SPX, TRAN and EEM nearing important resistance levels, there
is now a decent opportunity to START entering new bearish positions.
We emphasised the word "start" in the preceding sentence because, as discussed
above, there's a realistic chance that the stock market will consolidate for 1-3
months before embarking on a decline that solidly breaches the January-February
lows. To put it another way, this is not the time to be diving head-first into
leveraged bearish trades, but some exposure to the 'dark side' might now be
warranted.
With regard to new bearish positions, we don't plan to add anything to the TSI
Stocks List in the near future. Instead, we'll wait and hope for a better entry
point. Also, we haven't done anything in our own account yet, but we might make
an initial purchase of EEM June-2016 $25 put options within the next two trading
days.
Note that if our overall market outlook is close to the mark then EEM's days of
relative weakness (weakness relative to the SPX, that is) are almost over,
implying that EEM is not the ideal target for a new bearish speculation.
However, we have begun to build exposure to non-gold commodity stocks. The
relevance is that due to the long-term positive correlation between
emerging-market equities and commodity-related equities, an EEM put-option
position can serve as a hedge against declines in non-gold commodity stocks.
Gold and the Dollar
Gold
Goldman Sachs (GS)
reiterated its bearish gold forecast at the beginning of this week. Gold
will slump to $1100 an ounce in 3 months and $1000 an ounce in 12 months,
according to a gaggle of GS analysts.
GS's short-term timing was quite good, in that late last week the gold market
was almost as 'overbought' on a short-term basis as it ever gets (refer to the
latest TSI Weekly Update for details). The premise of the bearish forecast is
probably wrong, though, because it revolves around a strengthening US economy
and rising real interest rates.
Additionally, with a company such as GS you always have to wonder whether the
forecasts put out for public consumption accurately reflect the expectations of
its senior traders and managers. We suspect that there will often be a
substantial difference between the information made public and the information
on which GS is acting for its own account, but we don't care either way. If
gold's true fundamental drivers have made a sustainable shift into bullish
territory then the gold price has bottomed and will work its way upward over the
coming 12 months, regardless of what GS's analysts say in public and regardless
of what its senior staff genuinely expect.
But even if the true fundamentals have made a sustainable shift into bullish
territory, the extent to which the gold market was 'overbought' late last week
is a reason for short-term caution. The price action hasn't yet signaled that a
multi-week top is in place, but it certainly could be.
As illustrated below, Tuesday's sharp decline in the US$ gold price ended at
former resistance (now support) defined by the October-2015 peak. There is
currently no way of telling whether this sharp decline was a routine pullback to
'test' the preceding upside breakout prior to the resumption of the rally or the
start of a correction that will run for at least a few weeks. A daily close
below $1190 would point to the latter.
Gold Stocks
In the email sent to subscribers following Tuesday's US trading session, we
wrote:
"...the price action on Wednesday 17th February could provide us with a clear
signal -- or at least a clearer signal than we currently have -- that short-term
price tops were put in place last week. To generate such a signal, all it would
take is a down-day for the HUI on Wednesday."
Wednesday was a small up-day for the HUI, so a short-term top hasn't yet been
signaled. This means that there could still be a rise to a new high for the year
prior to a top that holds for more than a few days. We don't have a strong
opinion on the matter.
In the latest Weekly Update we used a moving-average (MA) envelope to illustrate
the unusual degree to which the US$ gold price was stretched to the upside at
last week's high. Below is a similar chart that shows the unusual degree to
which the HUI was stretched to the upside late last week.
In its entire 20-year history the HUI has never been higher relative to its
50/20 MA envelope (a 20% envelope around the 50-day MA) than it was at the end
of last week.
Although the above chart indicates an 'overbought' extreme and suggests that a
correction will soon begin (if it hasn't already), it also supports the view
that a cyclical bull market has started. The reason is that the only times in
the past that the HUI got close to being as stretched to the upside on a
short-term basis as it was last Friday was during the first 6 months of the
multi-year rally that began in November-2000 and the first few months of the
multi-year rally that began in October-2008. In contrast, the bear-market
rallies of 2012-2015 ended at or below the top of this MA envelope.
Buying opportunities in individual gold stocks will continue to crop up, but the
next sector-wide buying opportunity probably won't occur until the HUI trades
near its 50-day MA. This could happen within a week or it could take as long as
two months. The 50-day MA is presently in the low-120s, but it is rising and
could be at a much higher level by the time the price reaches it.
Updates on Stock Selections
Notes: 1) To review the complete list of current TSI stock selections, logon at
http://www.speculative-investor.com/new/market_logon.asp
and then click on "Stock Selections" in the menu. When at the Stock
Selections page, click on a stock's symbol to bring-up an archive of
our comments on the stock in question. 2) The Small Stock Watch List is
located at http://www.speculative-investor.com/new/smallstockwatch.html
![]() New
TSI stock selection: Petrus Resources (TSX: PRQ). Shares: 45M issued, 48M fully
diluted. Recent price: C$2.95
New
TSI stock selection: Petrus Resources (TSX: PRQ). Shares: 45M issued, 48M fully
diluted. Recent price: C$2.95
It has been many years since there was an oil-and-gas (O&G) stock in the TSI
List. That changes today, with the addition of Petrus Resources (PRQ.TO).
PRQ has been operating for a few years but only began trading on a public
exchange (the TSX) last week. The stock traded as high as C$4.99 on its first
trading day (8th February) and has since traded as low as C$2.85. In other
words, it had a volatile start to its life as a publicly-traded company. It
ended Wednesday's trading session at C$2.95.
The company has Canada-based current production of about 9,000 boe/d (barrels of
oil-equivalent per day), split 35%/65% between liquids and natural gas. It is
therefore more of a natural gas producer than an oil producer.
Detailed financial records for the company aren't yet available, but according
to
PRQ's presentation the company generated operating cash flow of C$1.35/share
in 2015. This year's cash flow could be lower due to lower average prices for
oil and gas, although some of the price risk has been removed via hedging (about
half of this year's production has been hedged).
As is the case with most O&G producers, PRQ has substantial debt relative to the
size of the company. According to the above-linked presentation, there is net
debt of C$150M. There is also unused credit of C$100M.
The senior management and board members of PRQ are well known and
highly-regarded within the Canadian oil industry. For example, the chairman is
Don Gray, the founder and former CEO of Peyto Energy (PEY.TO). Peyto was one of
the biggest success stories in the O&G industry over the past 16 years, rising
from around $0.20/share to more than $30/share (16 years of better than 35%/year
compound growth).
PRQ's primary aim at this time is to take advantage of the O&G industry
depression by picking up quality assets on the cheap. As long as there is a
turnaround in the coming year or so, the worse things get for the O&G industry
in the short-term the better it should ultimately be for PRQ.
PRQ should be viewed as a long-term speculation based on the potential for a
sustained turnaround in the oil market this year. If, like us, you think that
such a turnaround is likely then it could make sense for you to average into a
PRQ position. However, if you are convinced that excess supply will result in a
depressed (US$25-$35 or lower) oil price for at least a few more years, then PRQ
is not a stock for you.
At this time it is difficult to come up with a valuation and price target for
PRQ. There just isn't enough to go on. That being said, it is probably
significant that PRQ completed a private placement at C$7.40/share with
knowledgeable/experienced investors only one month ago. Also, C$7.40/share was
the indicative value used when PRQ recently purchased Phoscan (FOS.V) in order
to get hold of FOS's C$45M of cash. This suggests to us that the shares offer
good value near their current price of C$2.95.
 Updated thoughts on Dragon Mining (ASX: DRA)
DRA is not a current member of the TSI Stocks List, but it is a member of the
TSI Small
Stocks Watch List. This means that we think it has speculative merit, but is
probably too risky and/or too illiquid to be closely tracked at TSI.
DRA's stock price barely moved during the recent gold-mining rally. This is
despite the fact that DRA has 50K ounces/year of unhedged current production and
therefore gets an immediate bottom-line benefit from a higher gold price.
The lack of response by DRA to the recent gold rally is partly due to the stock
not being well known and partly due to gold-stock speculation being focused on
the more liquid stocks at this early stage of what is probably a new bull
market. It is also, we suspect, due to a concern that DRA doesn't have much in
the way of reserve life, that is, a concern that DRA could run out of ore to
feed its production facilities in Sweden and Finland within the next couple of
years. This is a legitimate concern that the company is attempting to address
via the development of the Faboliden mine in northern Sweden. With a current
resource of 743K ounces grading 3.3-g/t this mine could provide profitable ore
feed for many years, but the risk is that it still has to be permitted and
developed.
DRA has a strong cash position, with net cash of A$16.5M (about A$0.18/share) at
31st December 2015. This means that DRA is still trading below its cash value,
although the amount of cash fell by almost A$4M last year as the company
invested in new sources of production.
With DRA's mining assets still being valued by the stock market at less than
zero, the stock is a speculative buy. However, it's possible that a LOT more
patience will be required with this one.
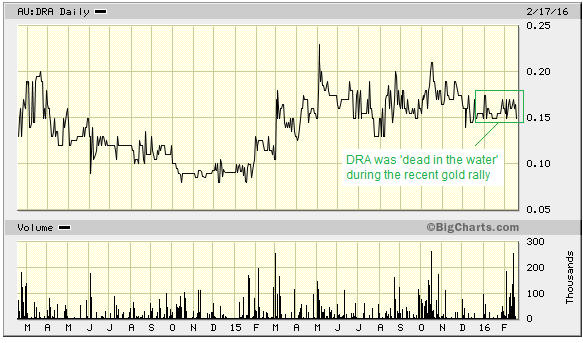
Chart Sources
Charts appearing in today's commentary
are courtesy of:
http://stockcharts.com/index.html
http://bigcharts.marketwatch.com/
![]()