![]()
![]()
![]()
![]()
- Interim Update 17th May 2017
Copyright
Reminder
The commentaries that appear at TSI
may not be distributed, in full or in part, without our written permission.
In particular, please note that the posting of extracts from TSI commentaries
at other web sites or providing links to TSI commentaries at other web
sites (for example, at discussion boards) without our written permission
is prohibited.
We reserve the right to immediately
terminate the subscription of any TSI subscriber who distributes the TSI
commentaries without our written permission.
Oil
The oil supply
transformation
The supply side of the supply-demand
equation is now more bearish for the oil market than for any other
commodity market. The reason is the ability and willingness of the US
shale-oil industry to quickly ramp-up supply in response to a higher
price.
In a typical commodity market, supply changes occur very
slowly in response to price changes. For example, it takes many years to
bring a new copper mine into production, and once in production a copper
mine will remain operational unless the copper price stays below the
mine's break-even level for a long period. This is because there are huge
costs associated with stopping and restarting production. This is also the
way the large, conventional oil producers have always operated and still
operate, but it is not the way the US shale-oil industry is operating.
The US shale-oil industry has taken over from OPEC as the 'swing
producer' in the oil market and it's a swing producer capable of
responding quickly and decisively to higher and lower prices. Furthermore,
whereas three years ago many of the companies focused on the shale fields
needed an oil price above $70/barrel to be cash-flow positive, these days
they are generally very profitable at $50/barrel. Some are even profitable
below $40/barrel and the average break-even price remains in a downward
trend. And in the shale-oil business it is relatively inexpensive to turn
production on and off.
A consequence is that whereas the quick
rebound in the oil price from its early-2016 low of less than $30/barrel
to more than $50/barrel had minimal effect on the large, conventional oil
drillers, it provoked a massive increase in drilling activity in the US
shale-oil industry. This has already caused a significant increase in US
oil production and an additional significant increase is set to occur over
the coming year.
The story is outlined in an
article at Bloomberg last week. Here's an excerpt from the article:
"Oil prices that initially popped above $55 in the weeks after the
[OPEC] cut was announced have since dipped to around $46, reflecting
pessimism that the OPEC-led deal can withstand the onslaught of U.S.
shale.
So far, independent American explorers such as EOG Resources
Inc. and Pioneer Natural Resources Co. are holding fast to their ambitious
growth plans. Some recently finished wells in the Permian region yielded
70 percent returns at first-quarter prices, EOG Chief Executive Officer
Bill Thomas told investors and analysts during a conference call on
Tuesday.
EOG, the second-largest U.S. explorer that doesn't own
refineries, plans to boost spending by 44 percent this year to between
$3.7 billion and $4.1 billion. Pioneer is eyeing a 33 percent increase to
$2.8 billion. The sub-group that includes North American shale drillers
like EOG and Pioneer is collectively targeting $53 billion in spending
this year, up from $35 billion in 2016, according to the Barclays analysts
led by J. David Anderson.
U.S. oil production is already swelling,
even though output from the new wells being drilled won't materialize
above ground for months. The Energy Department's statistics arm raised its
full-year 2017 supply estimate to 9.31 million barrels a day on Tuesday, a
1 percent increase from the April forecast.
Next year, U.S. fields
will pump 9.96 million barrels a day, 0.6 percent more than the department
estimated last month."
It's also worth mentioning that the
"shale oil revolution" will not remain a US phenomenon forever. There is
the capacity to profitably exploit shale-oil resources in other parts of
the world.
As well as changing the oil market's supply dynamics,
the US shale-oil industry appears to have temporarily distorted the term
structure in the futures market. It seems that over the past few months
the companies focused on shale-oil production have been hedging so
aggressively via the sale of oil futures that the futures curve became
materially flatter than was justified by the underlying fundamentals. In
other words, oil's short- and intermediate-term fundamentals were made to
look more bullish than was actually the case by 'curve flattening' caused
by unusually aggressive hedging on the part of US shale-oil producers.
The bottom line is that it is probably going to take an extraordinary
event, such as a region-wide conflagration in the Middle East, to get the
oil price above $60/barrel (in 2017 dollars) for more than a brief period.
In the absence of such an event it's a good bet that the oil price will
spend most of its time in the $35-$55 range (again, in 2017 dollar terms)
over the next few years, with moves outside this range proving to be
short-lived.
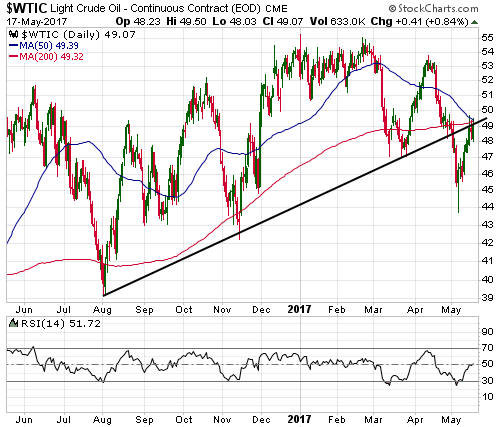
Current Market Situation
OPEC's influence has greatly diminished, but news of an OPEC production
cut is usually still good for a quick bounce in the oil price. Last
November the bounce was substantial, with news that OPEC members and
Russia had struck a production-cut deal causing the oil price to surge 15%
within the space of only two trading days. This week there was news that
the OPEC-Russia production cut put in place late last year would be
extended by 9 months (to March-2018) and again the oil price responded
positively, although much less positively than was the case last November.
This time around the news was good for only a single-day bounce of 4% on
an intra-day basis and 2% on a daily-closing basis. Furthermore, the
up-move stopped close to where it was likely to stop in the absence of
bullish news (the $49 target that we mentioned in the latest Weekly
Update), which suggests that oil speculators are wising up.
The oil market will remain well supplied over the remainder of this
year regardless of OPEC's attempts to support the price via production
cuts. In fact, the more successful OPEC is at holding-up the oil price the
more aggressively the US shale-oil industry will drill and the more
market-share OPEC will lose.
In any case, unless there is a major
unexpected supply disruption the performance of the oil price over the
months ahead will have more to do with the currency market than with
variations in the volume of oil production. As we've shown in previous
commentaries and as illustrated by the following chart, the oil price is
much higher than it probably should be given the level of the Canadian
dollar (C$). The implication is that in the absence of a very strong
rebound in the C$, the oil price will drop to the $30s.
In the latest Weekly Update we wrote that we would consider buying
some August USO (Oil ETF) put options if the oil price traded near $49
within the coming two weeks. We ended up buying half of a position on
Monday when the price spiked above $49 in reaction to the OPEC news,
meaning that we have given ourselves some scope to add to the position it
there's a little more strength over the coming week or so.
The Stock Market
From the 8th May Weekly Update:
"One of the reasons we are stubbornly continuing to anticipate a
near-term end to the US stock market's upward trend is the on-going
divergence between market internals and the senior stock indices. The
following chart, in which "market internals" are represented by the
RSP/SPY ratio (the equal-weighted divided by the capitalisation-weighted
S&P500), illustrates the issue.
The chart shows that since the
first half of December the upward trend in the SPX has been accompanied by
a downward trend in the RSP/SPY ratio. Furthermore, we now have the SPX
poised to make a new all-time high at the same time as the RSP/SPY ratio
is threatening to make a new 10-month low.
The current bearish
divergence is far more substantial than the 3-month bearish divergence
that was followed by a quick 10% drop in the SPX in October-2014 and the
3.5-month bearish divergence that was followed by a quick 12% drop in the
SPX during July-August of 2015."
Here is a similar chart to
the one referred to above, except that we are now comparing the NASDAQ100
ETF (QQQ) with "market internals" as represented by the RSP/SPY ratio.
During the first two days of this week the QQQ, an ETF dominated by a
handful of market darlings, continued its relentless march into new-high
territory while the RSP/SPY ratio fell to a 12-month low. This means that
the bearish divergence we've been talking about became even starker.
Divergences never matter...until they do. Early indications are that
on Wednesday 17th May it finally started to matter.
The equity bull market is probably not over, but there's a much
higher-than-normal probability of the senior US stock indices suffering
10%-20% declines within the next three months.
Early signs that
declines of the above-mentioned magnitude might have begun include the
fact that the Dow Transportation Average (TRAN), an index that hasn't
benefited from having any of the current market darlings among its
components, ended Wednesday's session at a new low for the year.
TRAN generated a few bearish signals over the past 12 months that
didn't lead to meaningful weakness in the senior indices, so TRAN's
breakdown will have to be confirmed elsewhere if Wednesday 17th May was
the start of something serious on the downside. The first place that such
confirmation is likely to appear is in the Russell2000 SmallCap Index
(RUT).
Critical support for RUT lies at 1340. This support limited
the downside in March and must be breached on a weekly closing basis to
indicate that a market-wide decline of substance has begun.
Gold and the Dollar
Gold
We
mentioned that $1245-$1260 was a likely range for a rebound peak in the
gold price. The top of this range was hit on Wednesday 17th May.
We mentioned that $17.00-$17.50 was a likely range for a rebound peak
in the silver price. The bottom of this range was hit on Wednesday 17th
May.
That our rebound targets have been reached doesn't mean that we expect
declines to new lows for the year to soon begin. The lacklustre response
of the gold-mining sector to Wednesday's sharp rise in the gold price
could be a warning that the rebound is, indeed, very close to an end, but
at the same time the bond/dollar ratio has just moved to a new high for
the year. The bond/dollar ratio directly or indirectly takes into account
most of gold's true fundamentals and has a strong positive correlation
with the US$ gold price. Here's a short-term picture of the relationship.
Wednesday's surge in the bond/dollar ratio to a new high for the year
was linked to the self-inflicted crisis enveloping President Trump. Trump
supporters claim that the mainstream media is out to get him, which is
true; however, it's rare for a week to go by when Trump doesn't provide
his enemies with ammunition by saying and/or doing something very stupid.
Cutting to the chase, we don't have an opinion regarding the likely
direction of the next US$40 move in the gold price or the next US$0.50
move in the silver price. Due to the rise in the bond/dollar ratio and the
fact that neither gold nor silver is yet close to being 'overbought',
there's a realistic chance of the gold price returning to its April high
near $1300 and the silver price moving up to near the top of our target
range ($17.50) within the coming week or so. There is also a realistic
chance that the rebounds are very close to complete.
We are not
interested in adding to our gold/silver exposure at this time, but we are
also not yet inclined to establish new hedges. If we do hedge during the
next two weeks it will likely be via SLV or GDX put options expiring in
July-August, following some additional price strength. For example, if GDX
extends its advance to around $24 (its 200-day MA) within the next few
trading days then we will probably buy some July-2017 puts to hedge
against short-term downside risk in gold and gold-mining stocks.
Gold Stocks
Last week the HUI rose to its 50-day
MA and thus achieved the minimum that could reasonably be expected from a
counter-trend rebound. This week the HUI extended its rebound, but
considering the performance of gold bullion the HUI's performance was
uninspiring.
As mentioned in the latest Weekly Update, the 200-day
MA defines the maximum that could reasonably be expected from a
counter-trend rebound. The HUI's 200-day MA is currently at 208.5, or 8
points above Wednesday's close.
The Currency Market
This week's decline in the
Dollar Index has been attributed to more political problems for Trump in
the form of a story that he shared classified information with Russian
diplomats and another story that he unofficially encouraged the head of
the FBI to end an investigation of General Flynn. It has also been
attributed to worse-than-expected US economic data late last week.
However, prior to Wednesday 17th May there was no evidence outside the
currency market of declining confidence in the US economy or government.
Indicators of confidence declined with the stock market on Wednesday,
but, rather than something new, what we are seeing in the currency market
is an extension of the choppy Dollar Index decline that began at the end
of last year. As previously explained and as illustrated by the following
chart, the decline in the Dollar Index is mostly about interest-rate
differentials (US government bond yields declining relative to German
government bond yields).
The chart compares the US-Germany 10-year
interest-rate differential with the Dollar Index. This is essentially the
chart comparing the Germany-US interest-rate differential with the euro
that we've shown in many previous commentaries (most recently in the
latest Weekly Update), but from a different angle. It is essentially the
same because the Dollar Index is essentially the reciprocal of the euro,
given that the USD/EUR exchange rate is almost 60% of the index.
We came into this year expecting that a downward correction in the
Dollar Index during the first quarter would be followed by a rise to a
major high during the second quarter or the third quarter. This week's
price action has ruled out the possibility of a major high during the
second quarter and also greatly reduced the probability of a major high
during the third quarter. The most realistic possibilities now are that
the Dollar's bull market ended late last year or that the Dollar's bull
market will extend into 2018. We will discuss these possibilities in the
coming Weekly Update.
Before ending today's discussion we want to
make it clear that when we talk about the Dollar Index we are, for all
intents and purposes, talking about the US dollar relative to the euro.
Relative to the Japanese Yen, the US$ probably peaked in 2015. Relative to
the British Pound, the US$ probably peaked during the first quarter of
this year. Relative to the senior commodity currencies, the US$ probably
either peaked early last year or will peak within the next six months at
not far above last year's highs.
Updates on Stock Selections
Notes: 1) To review the complete list of current TSI stock selections, logon at
http://www.speculative-investor.com/new/market_logon.asp
and then click on "Stock Selections" in the menu. When at the Stock
Selections page, click on a stock's symbol to bring-up an archive of
our comments on the stock in question. 2) The Small Stock Watch List is
located at http://www.speculative-investor.com/new/smallstockwatch.html
Chart Sources
Charts appearing in today's commentary
are courtesy of:
http://stockcharts.com/index.html
![]()