![]()
![]()
![]()
![]()
- Interim Update 17th June 2015
Copyright
Reminder
The commentaries that appear at TSI
may not be distributed, in full or in part, without our written permission.
In particular, please note that the posting of extracts from TSI commentaries
at other web sites or providing links to TSI commentaries at other web
sites (for example, at discussion boards) without our written permission
is prohibited.
We reserve the right to immediately
terminate the subscription of any TSI subscriber who distributes the TSI
commentaries without our written permission.
Market expectations are
roughly unchanged
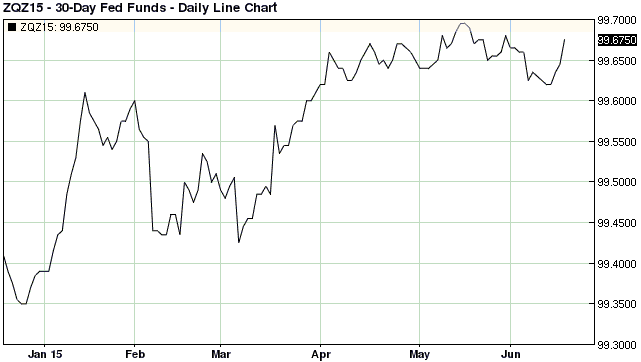
Neither the statement issued at
the end of this week's FOMC Meeting nor the Fed's updated economic forecasts nor
Janet Yellen's press conference caused a significant change in market
expectations. This is evidenced by Wednesday's minor changes in the US stock,
bond and gold markets. It is also evidenced by the following daily chart.
The chart shows that the price of the December-2015 Fed Funds Futures contract
made an insignificant gain on Wednesday 17th June, which means that there was an
insignificant decrease in the Fed Funds rate expected in December. The market
still expects that there will be at least one rate hike, but no more than two
rate hikes, before year-end. September remains the most likely time for the
first rate hike.
Greece remains 'front
and centre'
(a repeat of Tuesday's email)
It is still not the most likely
outcome, but the probability of a near-term Greek exit from the euro-zone (EZ)
is increasing. This increasing probability of "Grexit" is undoubtedly part of
the reason for the recent relative weakness in European equities, although up to
now the financial markets have mostly taken the Greece-related dilemma in
stride.
Here is a critical factor to be kept in mind as the negotiations between the
Greek government and its creditors stagger on and as poorly informed
commentators describe the situation as if the financial mess were primarily the
fault of Greece: At no point has Greece's economy or government been 'bailed
out' by the Troika, the official-sector triumvirate comprising the IMF, the EU
and the ECB. Instead, banks and other private bondholders were bailed out at the
expense of the Greek economy and at the potential expense of taxpayers
throughout the EZ. For its part, Greece's government exited the earlier
so-called bailout program with a much larger and an even less manageable debt
burden. If it were possible for an inevitable outcome to become more so, then it
could be said that the 'bailout' that happened a few years ago made a Greek
government debt default more inevitable.
The senior members of the Troika who were the architects of the previous "kick
the can down the road" deals regarding the Greek government's debt are now faced
with a choice. They can admit to having made terrible mistakes that not only
worsened Greece's economic prospects but also put all EZ taxpayers on the hook
for the inevitable losses on Greek government bonds, or they can try to save
face by pointing the finger of blame at Greece's government and its new prime
minister (Alex Tsipras). There are no prizes for correctly guessing their
preference.
What the Troika seems to want is the Greek government's agreement to continue
playing the game in which it pretends that it can service its unserviceable debt
load. On the surface there appears to be no good reason for the Greek government
to make such an agreement, although the thinly-veiled threat is that Greece will
be forced to leave the euro-zone if Tsipras and Co. refuse to toe the line.
This is interesting, because as far as we can tell there is no legal mechanism
via which Greece could be forced to leave the EZ. Also, the idea is absurd that
a debt default by the government of an EZ country would make the country
ineligible to use the euro. It would be like the government of California
defaulting on its bonds and the US federal government responding with: "The US
dollar can no longer be used in California".
Unfortunately, the reality is that even though there would be no legal basis for
forcing Greece out of the EZ following a failure to come to terms regarding debt
repayments and restructuring, it could still happen. Greece could be driven out
of the EZ by the ECB cutting off funding to Greek banks. These days, very few
banks around the world could survive for long without central-bank support, and
Greek banks almost certainly have weaker balance sheets than most. In other
words, the ECB could effectively force Greece out of the monetary union by
threatening to bring about, or actually bringing about, the collapse of Greece's
banking industry.
The threat to eliminate ECB support for Greece's banking system is, we think,
the one card being held by the Greek government's official-sector creditors in
the on-going negotiations. This card is probably the reason that Greece's
government has not already defaulted. After all, most Greek citizens want Greece
to remain in the EZ, so Greece being forced out would be a political death
sentence for Alex Tsipras.
If Greece is forced to leave the EZ, the most likely short-term beneficiaries
would be US, German and Swiss Government Bonds, and gold. The
investments/markets that would likely take the biggest short-term hits are
equities in general, European bank equities in particular, and the bonds issued
by the governments of Spain, Portugal and Italy.
The Stock Market
The US
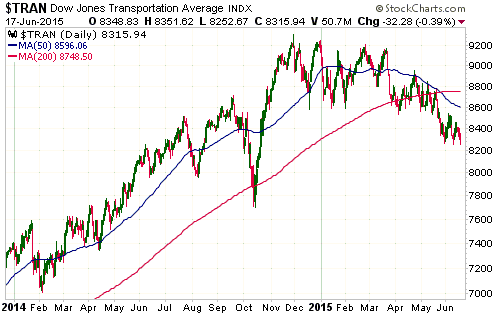
There was a time when the transportation sector of the US stock market,
represented on the first of the following charts by TRAN, would be relatively
strong during a period when the oil market was weak. The reason is that for most
US transportation companies, oil-based fuel is one of the biggest operating
expenses.
Many transportation companies still benefit from a lower oil price. For example,
most airline and trucking companies will have been helped by the past year's
decline in the oil price. However, an important transportation sub-sector has
been hurt by the lower oil price. We are referring to the rail industry. Due to
the fact that the shale-oil industry is now a very important customer of some of
the largest US railroad companies, the collapse in shale-oil drilling activity
caused by the decline in the oil price has resulted in downgraded expectations
for railway profitability and substantial relative weakness in the stocks of
railroad companies.
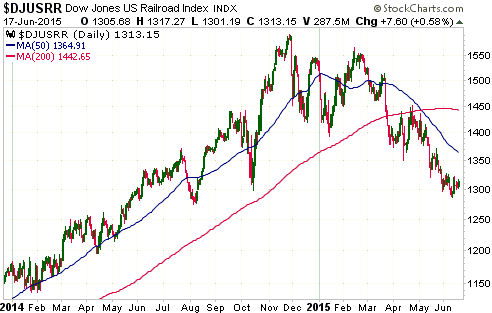
The weakness of rail stocks is illustrated by the second of the following
charts, which shows that the Dow Jones US Railroad Index (DJUSRR) is down by
almost 20% from last November's high. In other words, the chart shows that the
rail sub-sector of the transportation sector is almost officially in bear-market
territory.
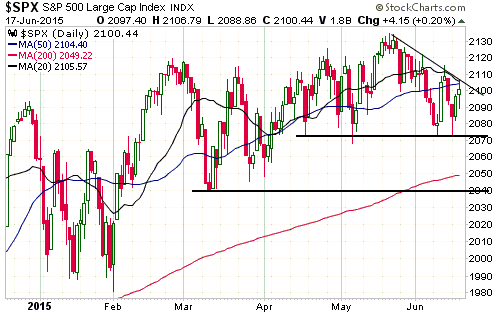
Turning to the S&P500 Index (SPX), the most important US stock index, this
week's moves have been small but have helped to define some support and
resistance levels. The fact that the SPX again rebounded following a spike down
to the low-2070s increases the importance of support in this area, whereas
Wednesday's downward reversal from a trend-line drawn from the May peak
increases the importance of this subjective resistance.
Europe
A decline by the EURO STOXX 50 Index (STOX5E) to support at 3300-3400 was
predictable because it was likely to happen regardless of the intermediate-term
outlook. In other words, regardless of whether STOX5E was embarking on a new
intermediate-term decline or experiencing a normal correction within an on-going
intermediate-term advance, it was likely to drop back to 3300-3400.
A decline into the 3300-3400 support range happened this week. What happens from
here is less predictable.
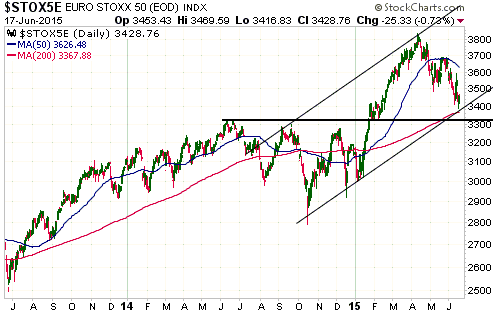
Due to the very bullish monetary backdrop in the euro-zone, the STOX5E's decline
from its April peak is more likely a correction within an on-going
intermediate-term advance than the first leg of a new intermediate-term decline.
If so, STOX5E should remain above 3300 on a weekly closing basis.
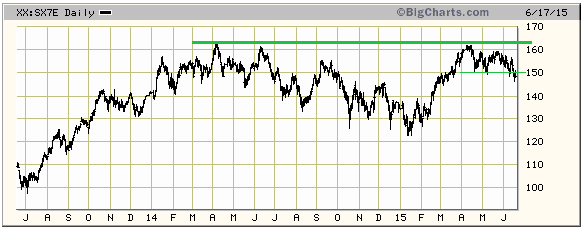
The EURO STOXX Bank Index (SX7E) tested long-term resistance in April and has
since pulled back.
As illustrated below, SX7E broke below short-term lateral support over the past
two days. This is a sign of weakness, but it doesn't give us much in the way of
new information. As is the case with STOX5E, SX7E could be in a routine
correction or the first leg of a new intermediate-term downward trend. The price
action is consistent with either alternative.
The fact that SX7E has only shown minor weakness of late is interesting in light
of the increasing -- albeit still small -- risk that Greece will be forced out
of the EZ. It suggests that the earlier Greece-related "kick the can" deals
cobbled together by Europe's political and monetary leadership successfully
transferred the exposure to losses on Greek government debt from banks to
taxpayers.
Gold and the Dollar
Gold
The FOMC meeting and the intensification of Greece's debt negotiations had the
potential to increase volatility in the gold market, but it wasn't to be. There
was very little movement in the US$ gold price over the first three days of this
week, although much greater movement (one way or the other) is probably going to
happen over the next two weeks.
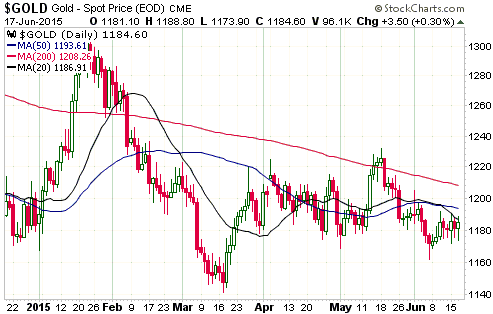
A decline to the $1130s remains a likely near-term outcome, although it wouldn't
take much strength from here to materially change the probabilities. Gold will
have to achieve a weekly close above $1220 to confirm that it has completed its
bottom-testing, but as a result of this week's price action we would now take
consecutive daily closes above $1190 (only a few dollars above Wednesday's
closing price) as an early warning that there will not be another test of last
year's low.
Note that as we put the finishing touches on this commentary gold is trading at
$1197-$1198 in the London market. What's important, however, is not how it
starts the day, but how it ends the day.
Silver
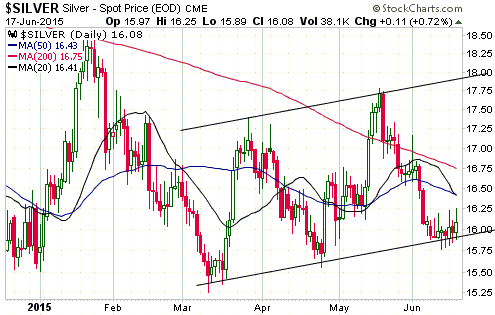
Silver is at an interesting juncture. Due to its position relative to support
and its slight upward bias over the past six trading days, either it has just
made a short-term bottom or it is consolidating prior to breaking out to the
downside. If it breaks out to the downside by closing below $15.75 over the days
ahead, a quick -- and potentially bear-market-ending -- decline into the $14-$15
range will probably follow. Alternatively, if it signals a short-term bottom by
closing above $16.45 then the channel top ($17.75-$18.00) will become a
realistic 2-4 week target.
Gold Stocks
The HUI tested its March low during the first half of this week. It actually
traded below this support for a while on Wednesday, but then rebounded when the
FOMC Statement was released and it became clear that the Fed was still moving at
snail's pace towards so-called 'policy normalisation'.
As an aside, the Fed is in something of a "Catch 22" situation because it is
being guided by a number of false beliefs, one of which is that the economy is
helped via intervention that causes interest rates to be lower than would
otherwise be the case. The Fed is determined not to allow interest rates to rise
by much as long as the economy is sluggish, but artificially-low interest rates
get in the way of real economic growth. In other words, the Fed's efforts to
'stimulate' the economy lead to sub-par growth, which prompts the Fed to persist
with its 'stimulative' efforts, and so on. The economy will therefore have to
accelerate DESPITE the Fed's best efforts in order for the Fed to feel confident
enough to scale-back these efforts.
The post-FOMC rebound resulted in the best single-day performance by the HUI in
more than one month. Because this rebound began with the HUI 'oversold' and
marginally below an important support level, there is a possibility that it
marked the beginning of a new upward trend. We will take this possibility more
seriously if there's enough follow-through to the upside to achieve a solid
daily close above the 20-day MA (currently at 163), but unless/until that
happens we will view a decline to major support at 145-150 as the most likely
near-term outcome.
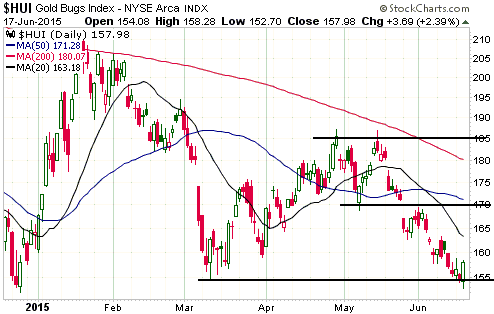
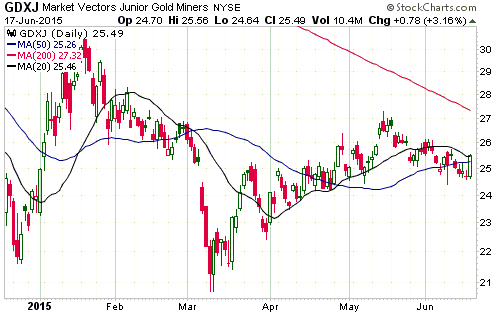
Due to the relative strength displayed over the past six weeks by the junior end
of the gold-mining sector, GDXJ's price chart looks a lot more bullish than the
HUI's price chart. At this stage, GDXJ's decline from its May peak has the look
of a routine correction within an intermediate-term upward trend.
The Currency Market
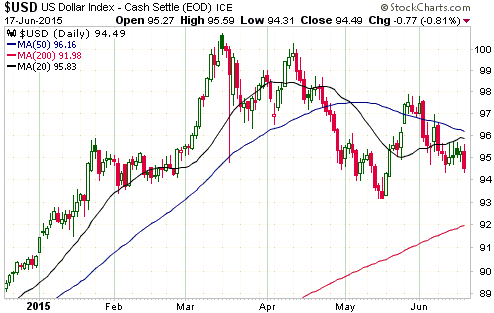
The Dollar Index is heading back to the bottom of its 4-month range. It has
resistance at 96 and support at 92-93.
With the FOMC Meeting out of the way, the Dollar Index is likely to be driven
more by what happens in the euro-zone than by what happens in the US. In
particular, the main drivers of the Dollar Index's performance over the weeks
immediately ahead are likely to be the twists, turns and eventual outcome of the
negotiations between Greece's government and its official-sector creditors.
Updates on Stock Selections
Notes: 1) To review the complete list of current TSI stock selections, logon at
http://www.speculative-investor.com/new/market_logon.asp
and then click on "Stock Selections" in the menu. When at the Stock
Selections page, click on a stock's symbol to bring-up an archive of
our comments on the stock in question. 2) The Small Stock Watch List is
located at http://www.speculative-investor.com/new/smallstockwatch.html
Chart Sources
Charts appearing in today's commentary
are courtesy of:
http://stockcharts.com/index.html
http://www.barchart.com/
http://bigcharts.marketwatch.com/
![]()