![]()
![]()
![]()
![]()
- Interim Update 17th June 2020
Copyright
Reminder
The commentaries that appear at TSI
may not be distributed, in full or in part, without our written permission.
In particular, please note that the posting of extracts from TSI commentaries
at other web sites or providing links to TSI commentaries at other web
sites (for example, at discussion boards) without our written permission
is prohibited.
We reserve the right to immediately
terminate the subscription of any TSI subscriber who distributes the TSI
commentaries without our written permission.
It is very different
this time
The phrase "this time it's
different" is usually dangerous, because most of the time when market
participants believe that the current situation is different they are
kidding themselves and eventually will incur a hefty cost for the belief.
However, at the moment the phrase could not be more appropriate.
Due to government and central bank intervention on a never-before-seen
scale, financial markets and economic statistics recently have done many
things they have never done before. Here are two examples:
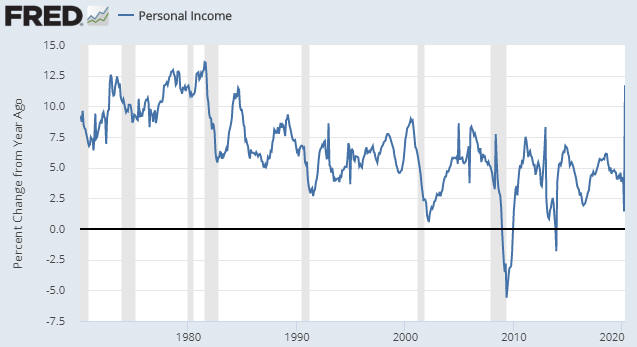
1) In
the US, the rate of growth in personal income has plunged during every
recession prior to this year. This is hardly surprising, given that as the
economy contracts more people will be out of work and there generally will
be less scope for salary/wage increases for the people who remain
employed.
During the first three months of the recession that
officially began in February-2020, however, the rate of increase in
personal income rocketed upward. This is illustrated by the first of the
following two charts, which shows that at the end of April-2020 the
year-over-year rate of growth in US personal income was at its highest
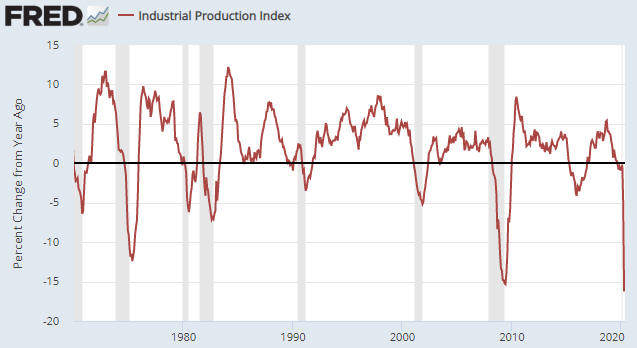
level since the early-1980s. Contrast this with the second of the
following charts, which reveals the largest year-over-year decline in US
Industrial Production in more than 70 years. So, we have soaring personal
income in the face of collapsing production. Nothing remotely similar to
this has ever happened before.
This strange turn of events is the
result of a substantial recent increase in unemployment benefits. Due to
this change, many people are making more money being unemployed than they
did when they were working.
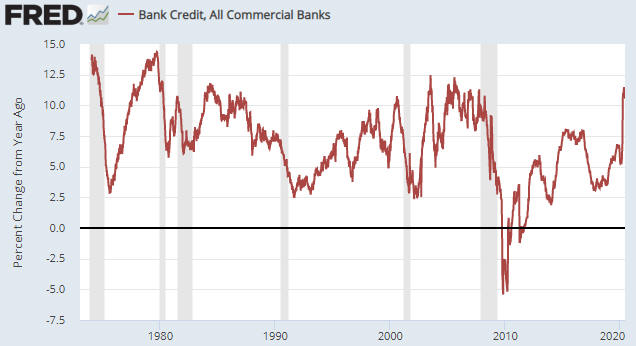
2) The rate of growth in US bank credit made a multi-year peak prior
to every previous recession of the past fifty years. It then plunged
during the recession. This time around it couldn't be more different.
The following chart shows that rather than plunge like it normally
does during the first few months of a recession, during the first few
months of this year's recession the year-over-year rate of growth in US
bank credit surged to a 12-year high. We assume this was the result of
many companies responding to the lockdowns by maxing-out existing credit
facilities as fast as they could, either because they needed additional
money in the short-term or for risk management purposes.
Now, it
isn't unusual for company managements to behave this way, but it is
unusual for banks to accommodate such behaviour on an economy-wide scale.
During normal cycles, banks start tightening credit before it becomes
clear that the economy is in recession and are very restrictive in their
lending practices during recessionary periods. In other words, most
businesses usually don't have the option of increasing their bank debt
during recessions.
The most plausible explanation for the dramatic
difference in bank credit growth during the 2020 recession is that the
leaders of commercial banks believe that the Fed is now backstopping all
bank lending. In effect, the Fed has removed the risks that caused the
commercial banks to 'pull in their horns' during previous economic
downturns, or, to put it more aptly, the Fed has transferred the risk of
loan default from the commercial banks to savers and taxpayers.
Clearly, it is different this time. The economy is recording many
firsts and so is the stock market. Considering the scale of the
intervention on the part of both the government and the Fed, it won't be a
major surprise if the S&P500 Index makes a new all-time high late this
year or during the first half of next year in the face of double-digit
unemployment.
Oil Update
The oil market remains well
supplied, but there is no longer a glut and the potential exists for the
oil supply situation to tighten (become more price-bullish) over the next
six months due to a decline in US oil production.
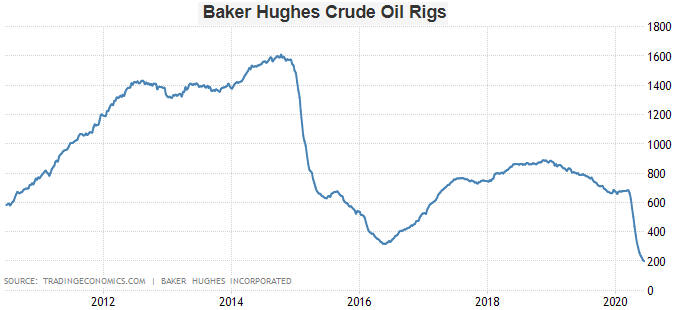
US oil
production peaked about three months ago at 13M b/d and already has fallen
by 15% to around 11M b/d. Furthermore, a large additional decline appears
to be 'baked into the cake' due to the change in the rig count illustrated
by the following chart. In less than three months the number of operating
oil rigs in the US has plunged from 700 to 200.
We expect that declining oil production, a weakening US$ and
increasing oil demand as the world goes back to work will conspire to move
the oil price up to the $60s by the first half of next year, but long-term
support/resistance at $42 probably will cap the price over the next three
months. Also, if we get a meaningful stock market correction within the
next couple of months then the next $10 move in the oil price is more
likely to be down than up.
The Stock Market
Early this week the S&P500 Index
(SPX) again tested and held its 200-day MA. It then rebounded to the
short-term resistance created by last Thursday's gap to the downside.
Fluctuations between 3000 and 3150 are essentially meaningless. The
SPX must break out of this range to signal the start of a significant
move.
We'll take a look now at the Russell2000 SmallCap ETF (IWM), which has
been relatively weak since the start of this year. The following chart
shows that IWM rebounded over the past two days to test important lateral
resistance at $145 and 200-day MA resistance at $147. The resistance held,
so IWM's position is a little precarious.
Short-term risk was already high prior to this week, but the risk has
escalated due to a COVID-19 outbreak in Beijing. In an effort to contain
the latest outbreak, parts of Beijing have been locked-down/quarantined
and schools have been closed.
This development could become
significant, mainly because the stock market has been acting as if the
all-clear had been sounded and a quick return to the pre-virus/lockdown
world was underway. Part of the reason for this unrealistic optimism (the
cold, hard reality is that so much damage was done by the lockdowns that a
return to pre-virus economic conditions will take years, if it happens at
all) was China's recent economic resurgence, so China taking a step
backward could throw a figurative bucket of cold water on bullish equity
speculators.
Also, evidence that China is retreating economically
could dampen the spirits of bullish commodity speculators. We are bullish
on industrial commodities with regard to the coming 12 months, but we do
not think that the short-term risk/reward is favourable.
The upshot
is that we remain focused on the potential for a decline that retraces up
to half of the rally from the March-2020 low. For the SPX, that implies
the potential for a decline to the 2700s. Given the extent of the Fed's
current support and the near certainty that the Fed will be quick to
provide even more support if it seems that a large stock market decline is
getting underway, at this stage the probability of the SPX retracing
substantially more than half of the March-June rally is low.
Gold and the Dollar
Gold
The
US$ gold price has been consolidating for more than two months. Therefore,
in terms of time this is now a significant correction, even though the
price has stayed at a high level.
In euro terms the recent price action has been more bearish. With
reference to the following chart, the euro gold price signalled a
short-term top by breaking below important lateral support eleven trading
days ago. It has since rebounded to test its downside breakout.
Although speculator positioning in gold futures is less of a risk now
than it was a few months ago, it is still the biggest short-term threat to
the gold market. The gold price is being supported by bullish fundamentals
that could become even more bullish over the next few months due to a dose
of economic realism and a stock market correction, but there is still the
potential for a quick decline to US$1560-$1600 in response to a rush for
cash by leveraged speculators.
For many investors a quick decline
of up to 10% wouldn't be a problem, but for some it would be. We would
welcome a near-term shakeout, because as long as the fundamentals remained
bullish it would create a better risk/reward for new purchases.
However, there's no assurance that we'll get a shakeout of speculator
'longs' before the next rally to new multi-year highs gets underway. We
are prepared for it, but we aren't betting on it.
Gold
Stocks
The HUI made its peak for this year to date in
mid-May, but all the price action since late-April could be interpreted as
being part of a consolidation/correction. In other words, it could be
argued that the gold mining sector has been in correction mode for almost
two months, even though the HUI made its high about a month ago.
The following daily chart shows that the HUI has been 'peppering' support
at 260. It has tested this support on ten of the past eleven trading days
without ever closing below it.
We suspect that a daily close below 260 would be followed by a decline
to 220-230. This is the short-term downside risk, which admittedly isn't
substantial. In fact, with the HUI at 260 the short-term risk is low
relative to the intermediate-term reward potential.
The
Currency Market
We think that the Dollar Index (DX) is in
the early stages of a cyclical bear market. That's the big picture.
Zooming in on the short-term situation, the DX is immersed in a multi-week
rebound that probably will extend to the 98.0-98.5 range.
Updates on Stock Selections
Notes: 1) To review the complete list of current TSI stock selections, logon at
http://www.speculative-investor.com/new/market_logon.asp
and then click on "Stock Selections" in the menu. When at the Stock
Selections page, click on a stock's symbol to bring-up an archive of
our comments on the stock in question. 2) The Small Stock Watch List is
located at http://www.speculative-investor.com/new/smallstockwatch.html
![]() Euronav
(EURN) trade stopped out
Euronav
(EURN) trade stopped out
The EURN trading position that
was added last month closed below its trailing stop on Wednesday 17th June
and has been removed from the Stocks List. The result, including
dividends, was a loss of 6%.
We will look for an opportunity to
return EURN to the List before the company's next quarterly financial
performance is reported on 6th August, because the reported earnings
should be very good.
The ideal place for new buying would be near
the March low in the mid-US$7 area, but obviously there is no guarantee
that the price will get that low.

Chart Sources
Charts appearing in today's commentary
are courtesy of:
https://stockcharts.com/
https://tradingeconomics.com/
https://research.stlouisfed.org/
![]()