|
- Interim Update 17th September 2008
Copyright
Reminder
The commentaries that appear at TSI
may not be distributed, in full or in part, without our written permission.
In particular, please note that the posting of extracts from TSI commentaries
at other web sites or providing links to TSI commentaries at other web
sites (for example, at discussion boards) without our written permission
is prohibited.
We reserve the right to immediately
terminate the subscription of any TSI subscriber who distributes the TSI
commentaries without our written permission.
Natural Gas Update
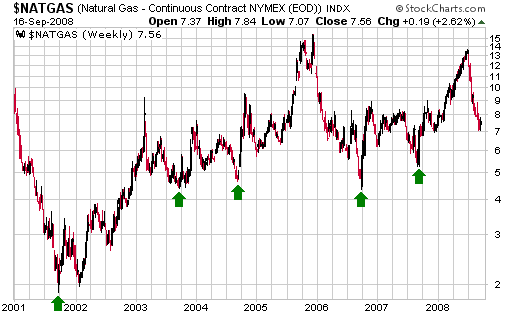
The NG market made important lows during September of 2001, 2003, 2004,
2006 and 2007, and is on track to make an important low during
September of 2008. Here's a weekly NG price chart highlighting the
September lows of the past 7 years and a table outlining the
trough-to-peak price gains achieved by the market during the 1-3 month
rallies that followed the September lows:
Year Timing of NG Price Low Timing of Rally High Approx. % Gain
2001 Mid September
Early November
75%
2003 Mid September
Mid December
55%
2004 Mid September
Late October
90%
2006 Late September
Early December
100%
2007 Mid September
Early November
64%
Over the past 7 years, the average gain achieved over the course of the
1-3 month rally that has always followed a September low is 77%.
Therefore, if the recent low of US$7.00 proves to be the ultimate
correction low (it very likely will) and this low is followed by an
'average' rally then NG will trade at around $12 at some point over the
next three months.
A direct way to gain exposure to the coming NG rally is via the United
States Natural Gas Fund (AMEX: UNG) or via UNG January-2009 call
options (the options are far more risky than the stock, but offer a
larger potential reward). A less direct way, but one that should still
provide good returns if the rally occurs as per the historical pattern,
is via the 'gassy' Canadian energy trusts that we follow at TSI. A
third way is via the stocks of large-cap natural gas producers such as
Chesapeake Energy (NYSE: CHK) or via call options on these stocks
(again, the call options offer a much higher potential profit in
exchange for a lot more risk). A fourth way is via mid-tier Canadian NG
producer Fairborne Energy (TSX: FEL). FEL's stock price rocketed upward
during August on the back of a very important natural gas discovery at
one of its projects, but due to the general market malaise it has since
given up all of those gains. It is a good candidate for new buying
below C$10.
Deflation versus Deflation Scare
We define a deflation scare as a period when most people perceive
deflation to be a clear and present danger even though the money supply
is growing at a robust rate. For example, there was widespread fear of
deflation between mid-2001 and mid-2003, and yet the year-over-year
percentage change in True Money Supply (TMS) remained in double digits
throughout this period. In other words, 2001-2003 was characterised by
general fear of deflation at a time of rapid INFLATION. 2001-2003 was a
classic deflation scare.
Fear of deflation was able to coexist with rapid inflation during
2001-2003 because most people confuse cause and effect. Specifically,
they equate deflation with falling prices rather than falling money
supply. As a consequence, with commodity prices at ultra-depressed
levels courtesy of a 20-year bear market and with equity prices in a
powerful downward trend the popular conclusion (delusion) during much
of 2001-2003 was that deflation was knocking at the door. At the same
time, those who understood the causal relationship between money-supply
changes and price changes were trying to figure out which prices were
about to embark on major advances in response to the massive inflation
that was happening in the background.
While in progress a deflation scare will look and feel the same as
actual deflation, but for people who look beyond the next few months
when making their investment plans there's a big difference between
genuine deflation and a deflation scare. If the money supply is
undergoing, or is likely to undergo, a prolonged contraction then
investors will be best served by concentrating on cash and zero-risk
government debt securities, whereas a deflation scare offers the
investor a great opportunity to buy assets at prices that will look
very cheap once the money-supply growth has its inevitable effect.
We've argued in the past that deflation scares are likely from time to
time, if only to provide the cover for the next round of monetary
inflation. We've also argued that a deflation scare was likely within
the next 12 months. However, we can't be quite as confident about the
eventual outcome today as we were back in 2001-2002. The reason is that
when the fear of deflation was palpable during 2001-2002 the money
supply was growing rapidly, but today's monetary backdrop is very
different. We suspect that the 12-month rate of change of TMS is in the
early stages of a new upward trend, but as things currently stand the
US monetary growth rate is only around 4% and a trend reversal (from
down to up) has not yet been confirmed. Our view is that a massive
increase in both monetary and fiscal stimulus over the coming 12 months
-- regardless of who moves into the White House early next year -- will
lead to the next wave of inflation, but unlike 2001-2002 we now have to
use some imagination in order to be bullish on inflation.
The Bond Market
When inflation fears
were running rampant during the second quarter of this year we warned
against shorting US Treasury Bonds. Our view was that T-Bonds were
approaching an intermediate-term bottom and would likely benefit over
the ensuing months from a downturn in commodities and a resumption of
the financial crisis. However, we thought that high-yield bonds
(relatively high-risk corporate bonds) were reasonable short-sale
candidates in anticipation of economic weakness and increasing risk
aversion. We also thought that it would be reasonable to bet on an
increase in the yield spread between high-yield bonds and Treasury
Bonds.
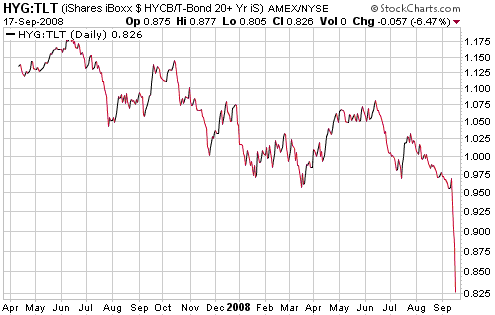
The following chart shows that high-yield bonds, as represented by HYG,
have since crashed relative to Treasury Bonds (as represented by TLT).
The collapse in the HYG/TLT ratio evident on this chart reflects a
blowout in credit spreads in response to the strengthening of the
T-Bond market and the concurrent dramatic weakening of the market for
high-yield bonds.
There will probably be a lot more upside over the next 12 months in the
bearish-HYG and bearish-HYG/TLT trades, but the panic being witnessed
this week in the credit markets offers a good profit-taking opportunity
for speculators who previously bet on a fall in high-yield bonds and/or
a rise in credit spreads.
The Stock Market
Another New-Lows Extreme
Prior to this week the day of a new-lows climax, defined as a day on
which the number of NYSE stocks making new 52-week lows exceeds 1000,
has never failed to mark a bottom of at least short-term significance.
Furthermore, in all bar one of the historical cases the pattern for
both the Dow Industrials Index and the S&P500 Index following the
new-lows climax has been:
1. An initial multi-week bounce
2. A pullback to test the low
3. A rally that takes the market above the high of the initial multi-week bounce
The above-described pattern has played out in bull and bear markets
alike, the difference being that in bull markets the 'Step 3' rally
leads into a major new upward trend whereas in bear markets the end of
the 'Step 3' rally leads into the next downward leg. The one exception
to the pattern occurred in August of 2007, at which time a new-lows
climax was followed by a strong 2-month advance to a new all-time high
(there was no intervening test of the August-2007 low).
The two most recent new-lows climaxes occurred in January and July of
this year. Following the January climax the market rebounded for a few
weeks, pulled back to test the low in March, and then rose to a new
multi-month high in May. In other words, the market action during the
months following the January climax matched the pattern predicted by
the historical record. Following the July climax the market rebounded
for a few weeks and then pulled back to test the low in September,
which is where we are right now (at this stage the plunge during the
first three days of this week COULD prove to be a successful test of
the July low, but if so an upward reversal must occur immediately).
The difference, this time round, is that the test of the July low -- if
that's what we are now seeing -- has resulted in another new-lows
climax. This has never happened before. In fact, we have just had two
new-lows climaxes on consecutive days (Tuesday and Wednesday of this
week) for the first time ever. On a related note, the new-lows climaxes
are now occurring far more frequently than they ever have in the past.
Specifically, there have only been 9 new-lows climaxes since 1970, but
five of these have happened over just the past 13 months and two have
happened this week.
The situation is illustrated by the following decisionpoint.com
chart. The bottom section of the chart shows the number of new NYSE
lows and the top section shows the Dow Industrials Index. Note that the
chart doesn't include Wednesday's action (on Wednesday the Dow made a
new low for the move and there were 1238 new lows on the NYSE).
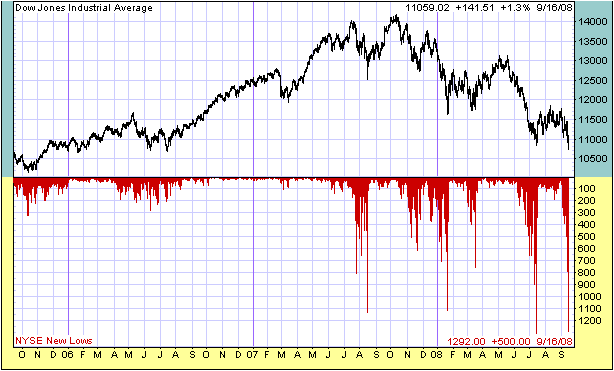
The fact that the test of the July low has resulted in TWO new-lows climaxes means that we are now in uncharted waters.
Current Market Situation
Wednesday's plunge to new lows by the senior US stock indices will
likely provoke official intervention of some form. We don't think the
trading of index futures by the so-called Plunge Protection Team (PPT)
is of any real consequence (assuming it happens at all) because the
resources of the PPT amount to only a drop in the ocean of global
liquidity. However, other forms of intervention, such as the
manipulation of short-term interest rate targets, can be important.
For some reason the Fed not only decided to keep its interest rate
target unchanged at this week's FOMC Meeting, it decided to reiterate
its concern about inflation. This was an absurd thing to do given the
backdrop of plunging commodity and equity prices, soaring T-Bond
prices, slow money-supply growth, and market-controlled short-term
interest rates way below the Fed's target, and puts Bernanke and Co. in
the unenviable position of having to either go back on what they said
just two days ago or defy the huge pressure that will be brought to
bear on them to do something to save the day.
Whether or not the Fed yields to the pressure and offers-up an
emergency rate cut, the stock market has probably either just made a
short-term bottom or will do so before the end of this week. The
markets are now in panic mode and such an emotional extreme can never
be sustained beyond the immediate-term. In addition to the two
consecutive new-lows climaxes discussed above, blatant signs of panic
include Wednesday's decline in the 3-month T-Bill yield to ZERO and
surge in the OEX Volatility Index (VXO) to 39.
Gold and
the Dollar
Gold
After the close of trading on Tuesday it was announced that the Fed was
going to dip into its petty cash drawer to obtain up to $85 billion
dollars of financing for on-the-rocks insurance company AIG. The
initial market reaction to this announcement was strangely subdued. In
particular, gold only gained a few dollars. Amazingly, from our
perspective, the market did not appear to perceive any inflationary
consequences or any significant risk that the steady stream of bailouts
revealed an out-of-control situation. When the US stock market opened
for trading on Wednesday morning gold was still up by only a couple of
dollars and the gold-stock indices actually began the day with small
losses. This really was extraordinary. But then, it was as if the
markets suddenly woke up from a deep sleep and, for the first time in a
long time, began to look around at what was happening.
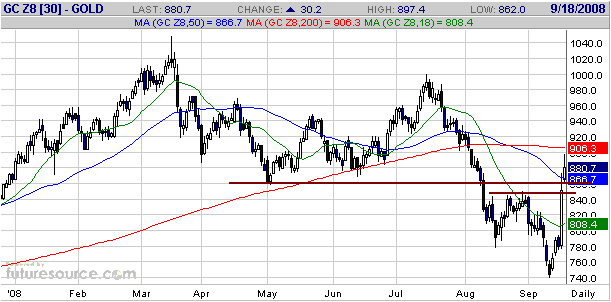
The result was a very clear upward reversal in the gold market. With
reference to the following daily chart of December gold futures, this
reversal has taken the gold price straight back to resistance at
$850-$860. We would not be surprised if some consolidation occurred in
the vicinity of this resistance, but additional gains are likely over
the coming weeks.
In the latest Weekly
Update we discussed the fact that some of our intermediate-term gold
market indicators had turned negative, but went on to say:
"...like the HUI's plunge
below support at 275-285 the deterioration that has just occurred
amongst our intermediate-term bullion indicators could prove to be an
overshoot resulting from the forced unwinding of leveraged trades, and
could mark the END of the downturn. Moreover, last week's low or
whatever new low is made this week will likely be followed by a
tradable rebound regardless of whether or not the longer-term outlook
has just turned bearish.
Our intention is to
monitor the performances of all our intermediate-term indicators during
the coming rebound to ascertain if the intermediate-term outlook has
actually turned negative, or if, as we currently suspect, the action of
the past 1-2 weeks was an overshoot. If we are correct to maintain our
intermediate-term bullish stance then this rebound should be
accompanied by a 'steepening' of the US yield curve and by significant
strength in gold relative to the broad stock market, industrial metals,
oil, and the euro."
So far, so good. For example:
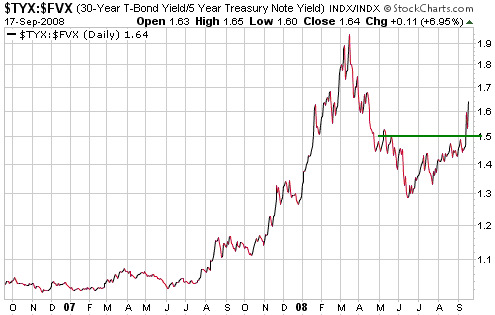
1. The following chart shows that the TYX/FVX ratio, a measure of the
US yield-spread, broke out to the upside and moved sharply higher over
the past three days. In other words, the US yield curve has just
'steepened' considerably.
2. After moving
marginally below the bottom of this year's trading range at one point
last week, the following chart shows that the gold/SPX ratio has just
zoomed back to near the top of its range. As unfathomable as such an
outcome would seem to be at this time, a sustained break to new highs
by the gold/SPX ratio would suggest that the HUI was on its way to a
new all-time high.
3. Gold has just hit a new 4-year high relative to the Industrial Metals Index (GYX).
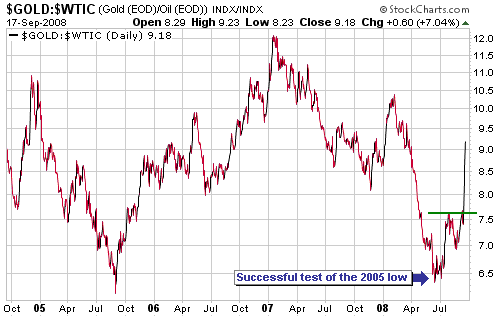
4. The following chart indicates that gold has turned the corner relative to oil
5. The euro-denominated gold price has just moved back above its 50-day moving average
Gold Stocks
In our most recent two commentaries we said that the bear-market signal
generated by the HUI's break below support at 275-285 could have
occurred at the END of the bear market and almost certainly occurred
just prior to the start of a multi-month rally. And in the latest
Weekly Update we said that the HUI's 50-day moving average was a
reasonable target for the first leg of the anticipated rally.
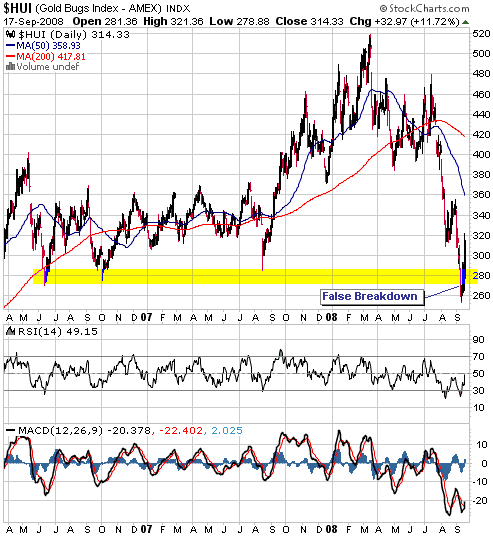
The action over the first three days of this week provided additional
evidence that a very important low was put in place last week. In
particular, the following chart shows that the HUI has quickly
recovered to well above the 275-285 range and, as confirmed by the RSI
and MACD shown at the bottom of the chart, is not yet close to being
overbought.
The gold sector's
risk/reward looks good over every timeframe, but with the exception of
special situations -- one of which is discussed below -- we would be
inclined to wait for a pullback before doing additional buying. We
understand that these aren't exactly normal times, but it would
certainly be normal for the HUI to consolidate its recent sharp gains
before resuming its advance.
Update
on Stock Selections
(Note: To review the complete list of current TSI stock selections, logon at http://www.speculative-investor.com/new/market_logon.asp
and then click on "Stock Selections" in the menu. When at the Stock
Selections page, click on a stock's symbol to bring-up an archive of our comments on the stock in question)
 Andina Minerals (TSXV: ADM). Shares: 73M issued, 81M fully diluted. Recent price: C$1.10 Andina Minerals (TSXV: ADM). Shares: 73M issued, 81M fully diluted. Recent price: C$1.10
We thought that ADM offered very good value when it was trading in the
C$3.40s in July. Nothing has happened in the mean time to suggest that
we were wrong, except that the stock is now trading in the low-C$1
area.
ADM has close to 10M ounces of in-ground gold in a single deposit in a
politically secure location (Chile). And at its current share price
this gold is being valued at only US$8/ounce. If we weren't seeing it
with our own eyes we would not believe that it would be possible for
such a large and high-quality gold deposit to achieve such a low
valuation.
We are hearing rumours that some institutions and hedge funds that
invested in junior resource stocks are being forced, by the need to
meet redemptions or simply the need to raise cash at any cost, to exit
their holdings in such stocks. We suspect that ADM's quick decline from
the C$2.20s to around C$1.00 since the beginning of this month was
largely driven by the need/desire of an institutional investor to get
out at any price, and had nothing to do with a change in ADM's
prospects.
2.5M shares of ADM changed hands on Wednesday, which is not a lot in
dollar terms but did represent the second-largest daily trading volume
in the stock's history. Wednesday's high trading volume hopefully means
that the desperate seller -- whoever they are -- has now liquidated the
bulk of their position. In any case, it seems that we have finally
reached the point where new buyers are prepared to 'step up to the
plate' and absorb substantial supply.
Traders should focus on the large-cap and mid-tier gold stocks, but
investors should not ignore the incredible bargains currently on offer
amongst the juniors. ADM's valuation is absurdly low and patient gold
bulls should buy it near the current price.
Chart Sources
Charts appearing in today's commentary
are courtesy of:
http://stockcharts.com/index.html
http://www.futuresource.com/
http://www.decisionpoint.com/

|

