|
- Interim Update 17th September 2014
Copyright
Reminder
The commentaries that appear at TSI
may not be distributed, in full or in part, without our written permission.
In particular, please note that the posting of extracts from TSI commentaries
at other web sites or providing links to TSI commentaries at other web
sites (for example, at discussion boards) without our written permission
is prohibited.
We reserve the right to immediately
terminate the subscription of any TSI subscriber who distributes the TSI
commentaries without our written permission.
Lower US
living standards are an INTENDED consequence of Fed policy
The following chart is very interesting. We found the chart in
John Mauldin's
latest "Thoughts from the Frontline" letter, although it was
created by the Boston Consulting Group. It compares the cost of
manufacturing in the top 25 exporting countries.
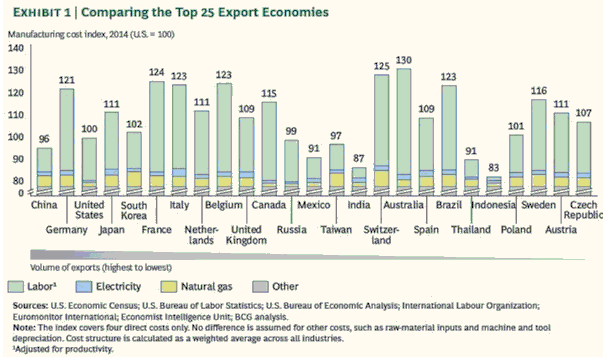
According to this chart, Australia is now the most expensive country
to manufacture stuff. Manufacturing costs in Australia are now 30%
higher than in the US, almost 20% higher than in Japan, almost 10%
higher than in Germany, and about 5% higher than in Switzerland. The
cost of manufacturing in the US is now slightly below the average --
at around the same level as South Korea, Russia, Taiwan and Poland.
This means that the Fed is almost half way to its goal of reducing
US living standards to the point where the average factory worker in
the US can compete on a cost basis with the average factory worker
in Indonesia.
The above comment is only partly tongue-in-cheek. Many
pro-free-market commentators discuss the decline in US living
standards as if it were an unintended consequence of the Fed's
policies, but there is nothing unintended about it. It is a
deliberate objective. The Fed will never come out and say "we are
doing what we can to reduce living standards", but a policy that is
designed to boost asset prices, support capital-consuming businesses
and promote investments that would never see the light of day in the
absence of artificially low interest rates, all while minimising
"wage inflation", is also designed to reduce real wages and,
therefore, to reduce living standards. The Fed surely doesn't want
to reduce US living standards to Indonesian levels, but that's the
direction in which its efforts are deliberately pointed.
As we've explained in previous commentaries, the root of the problem
is unswerving commitment to bad economic theory. Under the Keynesian
theories that all central bankers religiously follow, wealth is
something that just exists. There is no careful and deep
consideration given to how the wealth came to be and why some
countries managed to accumulate a lot of wealth while other
countries remained poor. According to these theories, people spend
more during some periods due to a vague notion called rising "animal
spirits". This causes the amount of wealth to grow. Then, after a
while, the mysterious "animal spirits" begin to subside, causing
people to start spending less. This leads to a reduction in the
amount of wealth. Under this perception of the world, one of the
central bank's primary tasks is to combat the unfathomable and
destabilising natural force that drives the shifts in spending. This
is done by indirectly manipulating prices throughout the economy,
including the real price of labour.
The so-called counter-cyclical policies are destined to backfire,
but the nature of the eventual backfiring is often difficult to
predict. In broad terms, there are two possibilities: There could be
a surge in inflation fear followed by a collapse in asset prices, a
recession and a moonshot in deflation fear, or the collapse in asset
prices and its knock-on effects could happen without a preceding
surge in inflation fear. In both cases, the asset-price collapse and
recession would likely usher-in a new round of 'stimulative' policy,
because the devotion to bad theory prevents the right lessons from
being learned.
The latest words from the US
monetary politburo
The Fed will obviously have to begin hiking its
targeted interest rate at some point, but it has no idea when. What it does in
the future will be determined by the economic data and the financial markets.
For example, the middle of next year currently appears to be a likely time for
the first rate hike, but if the stock market falls by more than 20% within the
next 6 months then the earliest time for the start of a rate-hiking program will
be pushed well into the second half of 2015. For another example, if the stock
market continues along its upward path with only minor setbacks along the way
and the economy continues to muddle along, then the Fed will shift its stance
towards monetary tightening at a slightly faster pace and the initial rate hike
could happen as soon as March of next year. Why, then, do so many commentators
and traders put so much effort into analysing the finest details of FOMC
statements and forecasts?
There was virtually no change in the policy statement issued following the
completion of the latest FOMC meeting on Wednesday 17th September. There had
been much anticipation prior to the meeting that the Fed would remove the words
"considerable time" from the statement, that is, many people had expected the
Fed to alter its pledge to keep interest rates extremely low for a "considerable
time". It is obvious that well before the Fed can start increasing its
interest-rate target it must first remove the "considerable time" language from
its post-meeting policy statement, but these 'critical' words have been left in
for now. Perhaps they will be removed next time.
The small change in the latest FOMC outcome that generated the most excitement
and pontification was in the Fed's forecasts. The median Fed Funds Rate forecast
of Fed officials has moved slightly higher for 2015, 2016 and 2017.
We now return to the point we made at the beginning of this discussion, which is
that the Fed has no idea what it will do in the future. Bear in mind that not a
single FOMC member saw the 2007-2009 financial crisis and recession coming. In
fact, not one of them saw the crisis even after it was well under way. It will
be the same story next time. Not a single FOMC member will see the next
crisis/recession coming. This means that there is no reliable link between what
the Fed currently thinks will happen to interest rates in the future and what
will actually happen to interest rates in the future. Therefore, we again ask
the rhetorical question: Why do so many people put so much effort into analysing
the finest details of FOMC statements and forecasts?
Don't get us wrong; the central bank's actions are overwhelming genuine, honest
price discovery in the financial markets, so what the Fed does is of great
importance to anyone involved in the markets. It's just that with regard to what
the Fed will do in the future, your guess is probably as good as the forecast of
any FOMC member.The Stock Market
Here's some information that highlights this year's extreme
divergence between the performances of the senior US stock indices and the
average US stock.
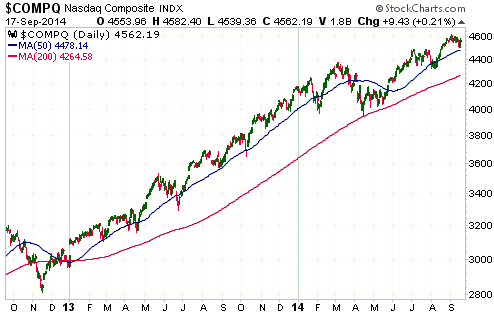
The following chart shows that the NASDAQ Composite Index, a capitalisation-weighted
index, is presently within 1% of the 10-year high reached at the beginning of
this month. At the same time, a
16th September Bloomberg article notes that 47 percent of stocks in the
Nasdaq Composite Index are down at least 20 percent from their peak in the last
12 months. In other words, we have a huge, on-going bull market in an index
proxy for the NASDAQ, and at the same time we have almost half of all
NASDAQ-traded stocks in bear-market territory.
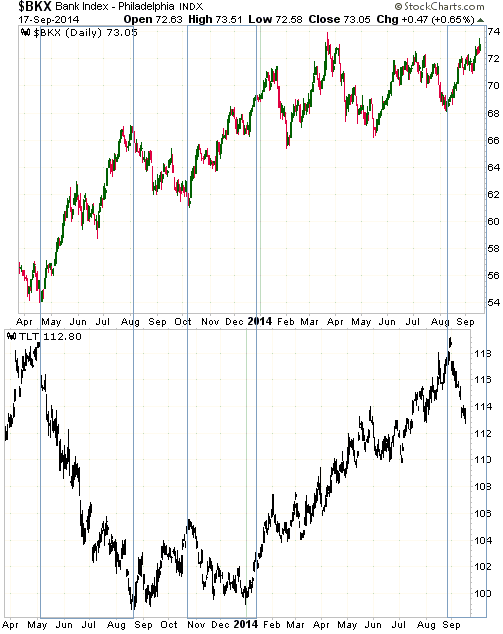
Below is a rather strange chart comparing the Bank Index (BKX) with TLT (a fund
that holds T-Bonds). The two halves of the chart have been offset by a few weeks
to reflect the fact that BKX has tended to lead TLT by 2-4 weeks at turning
points.
The chart shows that over the past 18 months BKX has trended upward when TLT was
trending downward and that BKX has either trended downward or moved sideways
when TLT was trending upward. Most recently, last month's upward reversal in BKX
led a downward reversal in TLT by about two weeks.
An implication is that the bond market's correction will probably continue until
the banking sector's short-term upward trend comes to an end, or, looking at the
situation from a different angle, evidence that the bond market's correction is
over would also be evidence that the banking sector's rally is close to an end.
Gold and the Dollar
Gold
In the latest Weekly Update, we wrote:
"If the gold price reverses upward and closes above $1251 (basis the
December-2014 contract) on either Monday or Tuesday of this week, then last
week's breakdown was false and we will have a reliable bullish signal. The most
likely alternative is a decline to the low-$1200s prior to an upward reversal
late this month.
A close above $1251 on any day this week would automatically shift our
short-term outlook back to 'bullish'."
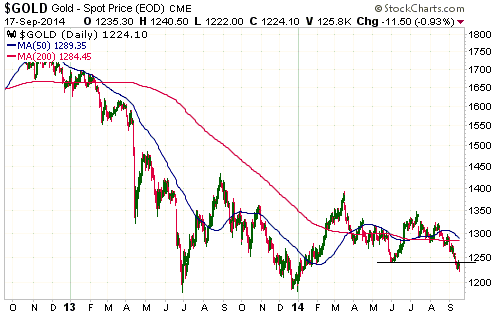
Gold's rebound attempts over the first three days of this week were turned back
at former support (now resistance) in the low-$1240s. This means that last
week's downside breakout has been confirmed and the most likely outcome is a
decline to the low-$1200s prior to an upward reversal late this month.
Due to this week's price action, it would now only take a daily close above
$1244 to shift our short-term outlook back to 'bullish'.
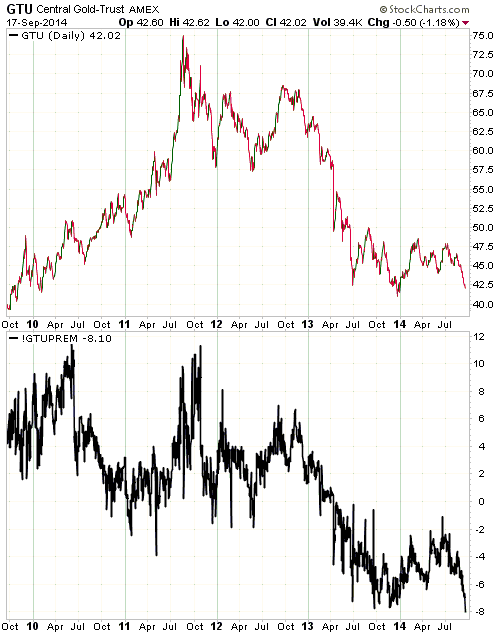
It is worth mentioning that the Central Gold Trust (GTU), a closed-end fund that
holds physical gold, is now trading at a discount of 8.10% to its net asset
value (NAV). The bottom half of the following chart shows GTU's discount/premium
to NAV. This is the highest discount in more than 8 years and is reflective of
the extremely depressed sentiment in the gold market. Buying GTU at its current
price is effectively the same as buying gold bullion at $1120/oz.
The Central Fund of Canada (CEF), a closed-end fund that holds physical gold and
silver, is trading at a similar discount.
Gold Stocks
In the latest Weekly Update we noted that a small, but potentially significant,
positive divergence had developed between the HUI and the GDXJ/GDX ratio. This
positive divergence became more pronounced over the first three days of this
week.
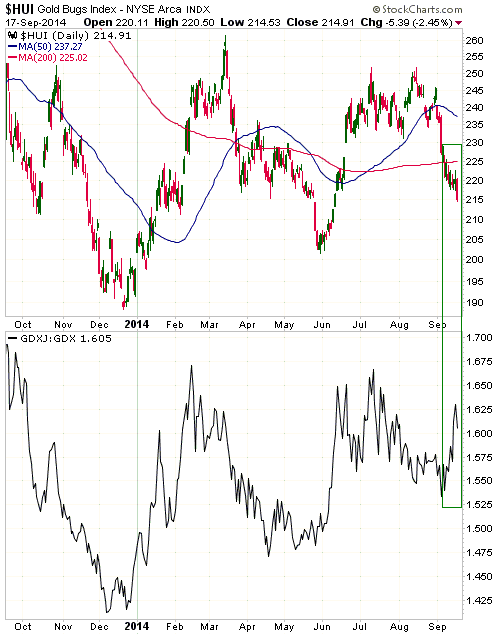
The most plausible two near-term scenarios for the gold-mining sector are:
1) A multi-week HUI rally will begin within the next few days from not far below
the current level. This scenario is consistent with the positive divergence
mentioned above and with a literal interpretation of the late-1970s model. Under
this scenario, the next short-term top would occur during October-November.
2) The HUI's downward drift will continue into early-October, at which time a
tradable rally will begin. This scenario is consistent with the fact that while
there are clear-cut signs of internal weakness in the US stock market, there are
not yet any signs of weakness in the senior US stock indices. It is also
consistent with the likelihood that the T-Bond correction, which has driven an
upward move in real interest rates and put downward pressure on the gold price
since the third week of August, is not yet complete. Under this scenario the
short-term upward trend that begins in early October would probably extend into
the first quarter of 2015.
The Currency Market
Event Risk
Two big events will take place later today (Thursday 18th September). One, of
course, is the Scottish referendum on independence. The surveys show that the
voting could go either way, but the betting at bookmakers is strongly in favour
of a "no" result. Either way, there is going to be a big move in the Pound's
exchange rate within the next 24 hours -- down if Scotland votes "yes" to
independence and up if Scotland votes "no". As previously advised, we think that
a big down move would quickly lead to a good opportunity to buy the Pound.
The other event is the beginning of the ECB's TLTRO (Targeted Longer Term
Refinancing Operation). Under this program banks will be able to borrow money
from the ECB at 0.15%, with the amount that they can borrow determined by the
details of their loan books. The extent to which European banks participate in
the TLTRO program will likely influence the FX market, with greater
participation being viewed as a positive for the euro and lesser participation
being viewed as a negative for the euro.
Current Market Situation
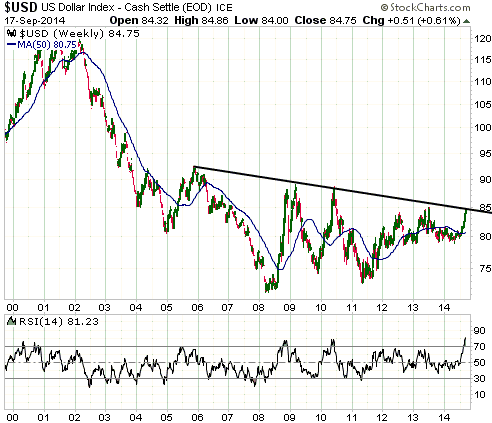
Our intermediate-term outlooks for the Dollar Index and commodities are linked.
We think that an intermediate-term bullish resolution for commodities, as
represented by the CCI, requires an intermediate-term bearish resolution for the
US dollar's exchange rate. Therefore, if the recent rally in the Dollar Index is
just the first leg of a 12-month or longer upward trend, then we shouldn't be
intermediate-term bullish on commodities.
If the Dollar Index has turned higher on an intermediate-term basis then it is
going to move a lot higher over the coming 12 months. As a minimum it would rise
to the mid-90s and could even make it to triple digits. We can't rule out this
possibility, but we don't view it as the most likely outcome. It's still more
likely, we think, that a strong anti-euro sentiment swing has catapulted the
Dollar Index up to the vicinity of major resistance and brought about a final
capitulation in the commodity markets, and that a multi-month swing in the
opposite direction will soon get underway.
Updates
on Stock Selections
Notes: 1) To review the complete list of current TSI stock selections, logon at
http://www.speculative-investor.com/new/market_logon.asp
and then click on "Stock Selections" in the menu. When at the Stock
Selections page, click on a stock's symbol to bring-up an archive of
our comments on the stock in question. 2) The Small Stock Watch List is
located at http://www.speculative-investor.com/new/smallstockwatch.html
Chart Sources
Charts appearing in today's commentary
are courtesy of:
http://stockcharts.com/index.html

|









