![]()
![]()
![]()
![]()
- Interim Update 17th October 2018
Copyright
Reminder
The commentaries that appear at TSI
may not be distributed, in full or in part, without our written permission.
In particular, please note that the posting of extracts from TSI commentaries
at other web sites or providing links to TSI commentaries at other web
sites (for example, at discussion boards) without our written permission
is prohibited.
We reserve the right to immediately
terminate the subscription of any TSI subscriber who distributes the TSI
commentaries without our written permission.
Commodities
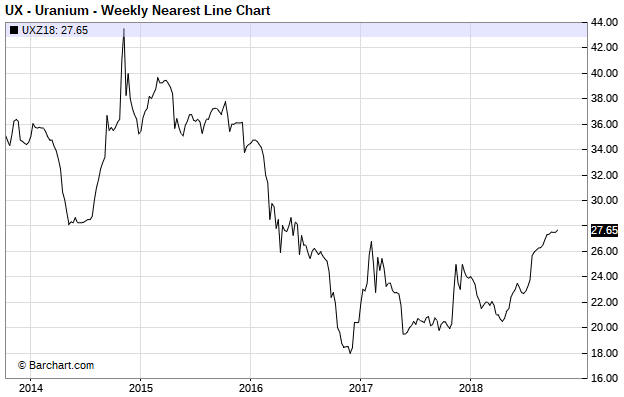
Update on uranium's
recovery
Our most recent comment on uranium was in the
24th September Weekly Update. At that time we wrote: "This year's rebound
in the uranium price has been slower and longer than the rebounds that
began in late-2016 and late-2017. This suggests that it has been propelled
by a steady rise in commercial demand relative to supply as opposed to a
burst of speculation, which could mean that it will have more staying
power."
The uranium price has since edged a little higher, which
suggests that the slow recovery is continuing and that the price rise will
prove to be sustainable.
Traders of uranium-mining equities have viewed the latest rebound in
the uranium price with scepticism. In fact, the $5-$6 increase in the
uranium price from its early-February level has resulted in no increase in
the Global X Uranium ETF (URA). From a contrarian perspective, this is
longer-term bullish.
For URA, a daily close above $13.80 would be
an upside breakout and suggest that a multi-month rally had begun, while a
daily close below $12.00 would paint a short-term bearish picture.
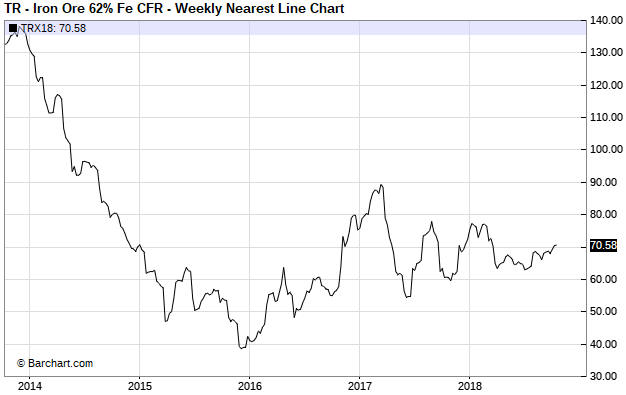
The resilience of the iron-ore price doesn't fit the narrative
Over the past several weeks the per-tonne iron-ore price worked its
way up from the low-$60s to the low-$70s. This up-move doesn't yet look
meaningful on the weekly chart (see below), because it hasn't resulted in
a breakout or changed the price pattern in a significant way. It's
interesting, though, because it is at odds with the popular "China's
economy is tanking" narrative.
It isn't just iron-ore. Signs of strength have appeared recently in
the markets for most industrial metals.
It's still early days, but
it looks to us like the industrial metals complex has completed its
downward correction.
The oil price takes out short-term
support
The oil price tested and held short-term support
at $70.50 during the final two days of last week, potentially setting up a
minor rebound. In the latest Weekly Update we wrote that a rebound to
$72.50-$73.0 would not be surprising and would create a new opportunity to
bet against oil via USO put options expiring in January-2019.
The
oil price traded as high as $72.70 on Monday, but it was downhill from
there. On Wednesday, short-term support at $70.50 was breached.
The
next support of significance is the 200-day MA, which is presently at
$67.20. This support probably will hold (temporarily) if it is tested in
the next few days.

The Stock Market
Warning Signals
There were more than the usual number of warning signals ahead of the
recent sharp stock-market decline, all of which were highlighted in TSI
commentaries prior to the start of the decline. Specifically, there was a
bearish divergence of the NYSE Advance-Decline Line (ADL) beginning in
late-August, a switch to "bearish" by our Equity True Fundamentals Model
(ETFM) on 7th September, a rare sell signal from the TSI put/call
indicator on 26th September, and, most importantly, a downside breakout by
the T-bond price on 3rd October. These were all warnings that a
potentially-steep short-term or intermediate-term stock market decline was
coming. However, up until now there haven't been any warnings that a bear
market is about to begin.
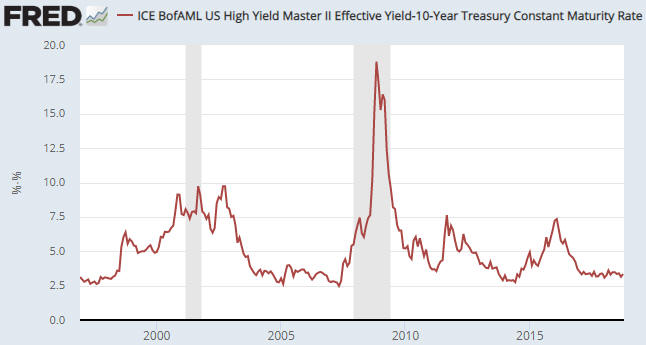
Something that's likely to happen prior
to the start of the next equity bear market is a clear-cut trend reversal
in credit spreads. More specifically, there likely will be a significant
widening of credit spreads. However, the following chart shows that credit
spreads remain near their lows of the past few years.
Arguments
have been made that credit spreads may not lead the next bear market the
way they led previous bear markets. As explained in a
blog post earlier this week, we don't find these arguments persuasive.
Instead, with regard to warning of major trouble in the economy and the
stock market we think that credit spreads are more likely to generate a
false positive signal than a false negative signal. Putting it in more
colourful terms, they are more likely to cry wolf when there is no wolf
than to not cry wolf when there is a wolf.
Something else that's likely to happen at or prior to the start of the
next equity bear market is a significant steepening of the yield curve
driven by falling short-term interest rates. Over the past 6 weeks there
has been a minor steepening of the yield curve, but it was driven by
rising long-term interest rates rather than falling short-term interest
rates. A steepening of the yield curve driven by rising long-term interest
rates is evidence of increased inflation expectations, not evidence that
an economic bust or equity bear market is about to begin.
That
being said, there is a risk that the above-mentioned warning signals and
other historically-reliable leading indicators won't trigger ahead of the
next bear market. Furthermore, with the broad US stock market more
expensive than it has ever been and monetary conditions relatively tight
it is not hard to imagine that the long-term bull market is close to its
end. Fortunately, with or without a suite of reliable leading indicators
there will be clear bear-market warnings in the price action while the
market is still near its high in terms of both price and time. We'll
mention two of these warnings in the coming Weekly Update.
Current Market Situation
Here are the short-term scenarios
that we described in last week's Interim Update and again in the latest
Weekly Update:
"One possibility is a correction low within the
next few days. This will be most likely if the SPX's decline extends well
beyond its 200-day MA -- perhaps to as low as 2650 -- without more than an
intervening 1-day bounce.
A second possibility is an interim low
within the next three days and within 3% of Wednesday's close, followed by
a 1-3 week rebound and then a decline that tests the October low in
November. In this scenario, taking out the October low could lead to a
crash."
Also, in the Weekly Update we wrote:
"...although
there's a high probability that last Thursday's intra-day low will be
taken out before the overall decline comes to an end, we can't rule out
the possibility that the correction low was put in place on Thursday 11th
October."
The second possibility appears to be the most
likely, in that last Thursday's low for the SPX was within 3% of last
Wednesday's close and we are now almost one week into a rebound.
For the SPX, the breakdown level (the support that had to hold to maintain
the short-term upward trend) was 2870-2875. This former support is now
critical resistance and defines the highest level that could be achieved
by a counter-trend rebound, especially since it now coincides with the
50-day MA. To be clearer, if the rebound extends further than 2875 on a
daily closing basis then it is far more likely to be part of a new upward
trend (a rally to new all-time highs) than a reaction within a continuing
downward trend.
For the NASDAQ100 Index (NDX), the breakdown level was 7400. This
former support now defines the maximum level that could be achieved by a
counter-trend rebound.
We think that the market is immersed in a counter-trend rebound that
will end with the SPX between 2850 and 2870. Our plan, therefore, is to
buy some additional SPY December-2018 put options if the SPX trades at
2850-2870 within the next two weeks.
Gold and the Dollar
Gold
At
the moment, the exciting action is in the stock market. The gold market is
making steady upward progress without much fanfare.
During the
first three days of this week the US$ gold price made a marginal new high
for the rally that began in mid-August, but it's more appropriate to
characterise this week's performance as a consolidation than as an
extension of the rally.
With the fundamental backdrop gold-bearish and not close to turning
bullish we continue to view gold's recovery from its August low as a
counter-trend rebound. At the same time, with sentiment still very
constructive and the market not close to being short-term 'overbought', we
expect additional gains prior to the next multi-month top.
As
previously advised, we think that the gold price stands a good chance of
rising to the vicinity of its 200-day MA (near $1280) within the next few
weeks.
Silver
The silver price has
short-term resistance at $14.90. Getting through this short-term
resistance would, we think, be followed by a quick move up to the
longer-term resistance in the $15.60s or the 200-day MA near $16.00.

Gold Stocks
Perhaps not surprisingly, the
gold-mining sector performed similarly to gold over the first three days
of this week. The HUI made a new 2-month high, but the price action was
more of a consolidation than a rally extension.
Support at 150
should hold on a closing basis during any further consolidation over the
days ahead. If it does, then a near-term rise to around 170 will be a good
bet.
Based on the information we have today, a near-term rise to
around 170 would prompt us to do some selling and/or hedging.
It's worth mentioning that for the moment the gold-mining indices are
negatively correlated with the senior US stock indices. In particular, we
note that last week's sharp stock-market decline was accompanied by a
gold-mining rally and that the stock-market rebound of the past four days
was accompanied by a gold-mining consolidation. This suggests that the
gold sector will benefit from an extension of the stock market's
correction, as long as the correction doesn't evolve into a crash.
The Currency Market
The euro broke below important
lateral support in early-October and then rebounded to slightly above the
breakdown level. The rebound appears to have been a successful test of the
breakdown. If so, a return to the August low near 113 probably will happen
within the next few weeks.
Updates on Stock Selections
Notes: 1) To review the complete list of current TSI stock selections, logon at
http://www.speculative-investor.com/new/market_logon.asp
and then click on "Stock Selections" in the menu. When at the Stock
Selections page, click on a stock's symbol to bring-up an archive of
our comments on the stock in question. 2) The Small Stock Watch List is
located at http://www.speculative-investor.com/new/smallstockwatch.html
Chart Sources
Charts appearing in today's commentary
are courtesy of:
https://stockcharts.com/
https://www.barchart.com/
https://research.stlouisfed.org/
![]()