|
- Interim Update 17th November 2004
Copyright
Reminder
The commentaries that appear at TSI
may not be distributed, in full or in part, without our written permission.
In particular, please note that the posting of extracts from TSI commentaries
at other web sites or providing links to TSI commentaries at other web
sites (for example, at discussion boards) without our written permission
is prohibited.
We reserve the right to immediately
terminate the subscription of any TSI subscriber who distributes the TSI
commentaries without our written permission.
Bonds
Theme Trading
...right now an upward reversal in the US$ represents the biggest threat to the US bond market.
On the surface it was quite strange to see US T-Bonds remain stable in
the face of a much higher-than-expected PPI on Tuesday and then bounce
in response to a higher-than-expected CPI on Wednesday, but in one
respect this was just par for the course. The reason is that although
many commentators on the financial markets continue to express surprise
whenever a fall in the US$ is accompanied by a rise in US bonds, there
has been such a strong inverse correlation between bonds and the dollar
over the past two years that a lot of traders are probably now
conditioned to buy bonds whenever the dollar starts to head lower. So
when the US$ continued its decline on Tuesday and Wednesday there was,
quite naturally, a lack of downward pressure in the bond market.
In our opinion the above-mentioned inverse correlation between bonds
and the dollar has its origins in the currency management programs of
Asian central banks. In particular, it arose due to the Bank of Japan's
large-scale purchases of US bonds in response to every significant drop
in the dollar over the past few years. The Asian banks are still a big
factor in the US bond market, but we suspect that it became such a well
understood 'theme' that the relationship could persist for a while even
in the absence of large-scale central bank intervention.
"The dollar's down so let's buy bonds" theme isn't likely to remain in
place for much longer because at some point the connection will be made
between a weakening currency and an increasing risk of an inflation
problem, but right now an upward reversal in the US$ represents the
biggest threat to the US bond market.
The relationship between interest rates and government deficits
...we
are not bearish on US T-Bonds because we are anticipating further
increases in the SUPPLY of US Treasury debt. Rather, we are bearish on
bonds because we are anticipating a large drop in the DEMAND for bonds
as a result of rising inflation expectations.
A point that we've made in the past, although certainly not in the
recent past, is that the expectation of a large increase in the US
budget deficit is NOT a reason to be bearish on US Treasury Bonds.
It isn't difficult to find examples that support the above statement.
For instance, US government bonds rallied in parallel with a massive
expansion in the US budget deficit during the first six years of the
1980s, Japanese government bonds have been very strong in parallel with
massive increases in Japan's budget deficit over the past 10 years, and
the rally in US government bonds during 2001-2003 occurred alongside a
huge increase in the US budget deficit.
The opposite also holds true in that a reduction in the budget deficit
does not necessarily lead to higher prices for government bonds (lower
interest rates). In fact, in developed countries such as the US there
is no consistent relationship between the government's budget deficit
and the price of long-term government debt.
Further to the above, we are not bearish on US T-Bonds because we are
anticipating further increases in the SUPPLY of US Treasury debt.
Rather, we are bearish on bonds because we are anticipating a large
drop in the DEMAND for bonds as a result of rising inflation
expectations.
As an aside, we were reminded of the above-discussed lack of
correlation between budget deficits and bond prices by the following
two paragraphs from John Hussman's latest weekly commentary. Dr Hussman
is one of the smartest analysts in the business and his Weekly Market
Comments at http://www.hussmanfunds.com/weeklyMarketComment.html are always worth reading.
"A personal favorite is
the idea that reducing deficits by raising taxes will lead to lower
interest rates. Think through this. If you increase taxes, yes, you can
reduce the supply of government bonds, which you might think would lead
to higher bond prices. The problem is that you've also reduced the
income of people with high propensities to save, which would have
otherwise been used to buy bonds, so the demand curve for bonds also
shifts back. The clear result is a reduction in the quantity of
government bonds, but the effect on bond prices (and interest rates) is
not clear at all. As an
empirical fact, you'll find no obvious relationship at all between
interest rates and government deficits. It doesn't work that simply.
You have to think through the whole equilibrium, including both the
supply and demand for funds, as well as whether those funds are used
productively or unproductively. [Emphasis added]
Similarly, while you can
certainly get an economic pop with a lump sum tax cut (though they tend
to die off over several quarters, as this one threatens to do), you
certainly don't stimulate gross domestic investment or economic
productivity by doing so. The reason is that if you haven't cut
government spending, the lump sum tax cut must be financed through an
increase in Treasury bond issuance. In equilibrium, the extra money in
the hands of the public must be used to buy the extra bonds issued by
the Treasury. No doubt in the current instance, China and Japan have
delayed our full realization of this harsh fact. But with the current
account deficit now bursting at the seams, it's likely that weak growth
in gross domestic investment will weigh on U.S. growth prospects for
years to come."
The US
Stock Market
Current Market Situation
...the
earliest an important top is likely to occur is January-2005. ...The US
stock market is very speculative in the sense that valuations, in
general, are extremely high.
In last week's Interim Update we said "...the
drop in the equity put/call ratio to around 0.60 is only a problem for
the market if we make the ASSUMPTION that the consolidation that began
during the first quarter of the year is still in progress. However,
since we believe that the consolidation ended during August and that
the market will remain in an upward trend for at least a couple more
months we suspect that the put/call ratio is on its way to lower
levels."
The below chart shows that the 10-day MA of the equity put/call ratio
has since moved decisively below its April-August lows (shown as an
upside breakout on the chart due to the inverted scale), thus providing
further confirmation that an intermediate-term upward trend is in
progress.
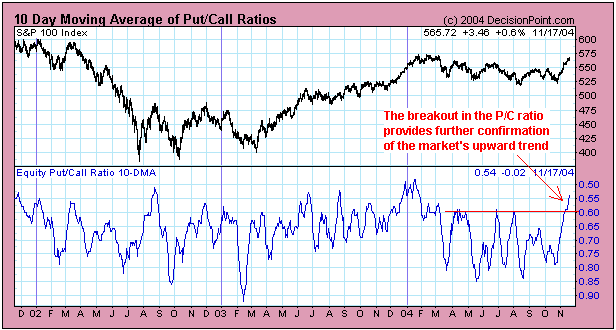
The reduction in the
put/call ratio indicates that sentiment continues to become more
complacent, but although an increase in complacency sets the stage for
the next big decline the earliest an important top is likely to occur
is January-2005. Between now and then, positive seasonality combined
with the strong desire of fund managers to maximise their year-end
bonuses should severely limit the extent of any pullback and push the
stock indices to higher levels.
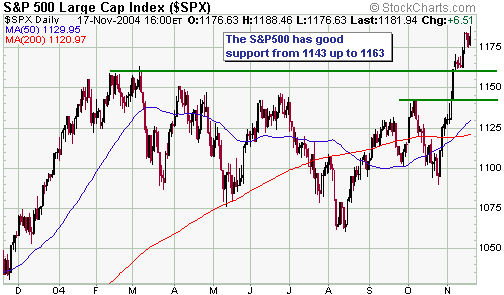
As far as short-term downside risk is concerned, the S&P500 Index
has good support from 1143 up to 1163 (see chart below). Our thinking
is that any pullback over the next few weeks would most likely end near
the top of this support range, although a drop to the mid-1140s is
possible.
The US stock market
is very speculative in the sense that valuations, in general, are
extremely high. What this means is that no one should be making
long-term investments in US index funds. There are, however, stock
markets in the world that offer the prospect of good long-term
investment returns as well as short-term speculative returns. For
example, at TSI we've chosen to participate in the global stock market
rally by taking positions in three Asian markets -- Japan, Thailand and
Malaysia -- that have good growth potential and are fairly valued based
on current earnings.
Gold and
the Dollar
Growth currencies versus safety currencies
...[there
is a] strong tendency for AUD/EUR (the Australian Dollar in terms of
the euro) to trend in the same direction as the US stock market.
When the Dollar Index is trending strongly lower it's likely that all
of the other major currencies (the euro, the Yen, the Swiss Franc, the
British Pound, the Australian Dollar and the Canadian Dollar) will be
trending higher against the US$. By the same token, during those times
when the Dollar Index is in a strong upward trend it is likely that all
the other major currencies will be trending lower against the US$.
Therefore, if we are short-term BEARISH and intermediate-term BULLISH
on the US$, as is the case right now, then unless we specifically state
otherwise it can be taken as read that we are short-term BULLISH and
intermediate-term BEARISH on all the other major fiat currencies.
Amongst the other major currencies there are, however, some interesting
relationships, one being the strong tendency for AUD/EUR (the
Australian Dollar in terms of the euro) to trend in the same direction
as the US stock market.
The relationship between AUD/EUR and the US stock market is illustrated
on the below chart. Note, in particular, that every significant
reversal in AUD/EUR over the past 6 years has occurred at the same time
as or shortly after a similar reversal in the S&P500 Index. What
this means is that regardless of whether the A$ and the euro are rising
or falling relative to the US$, the A$ generally out-performs the euro
when the US stock market is trending higher and under-performs the euro
when the US stock market is trending lower. In this respect, the
Australian Dollar's strength relative to the euro over the past couple
of months is not surprising.
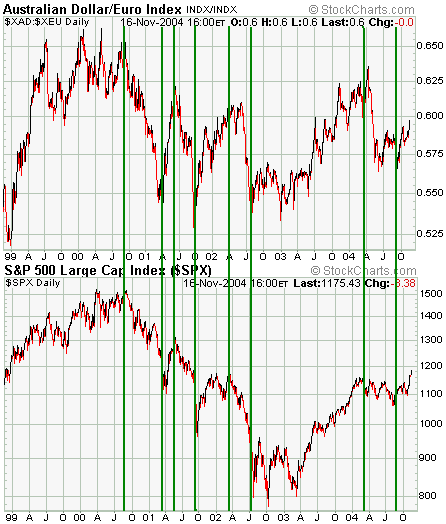
The above-discussed
relationship results from the A$ being a 'growth currency' -- one of
the currencies that becomes attractive to investors when global growth
is strong -- while the euro, like the Swiss Franc, is more of a 'safety
currency'. Furthermore, if the relationship persists in the future
ñ we can't think of a reason why it won't -- then the A$ will
substantially under-perform the euro after the next major decline in
the US stock market gets underway.
In the coming Weekly Update we'll review a couple of other interesting relationships between the non-US$ currencies.
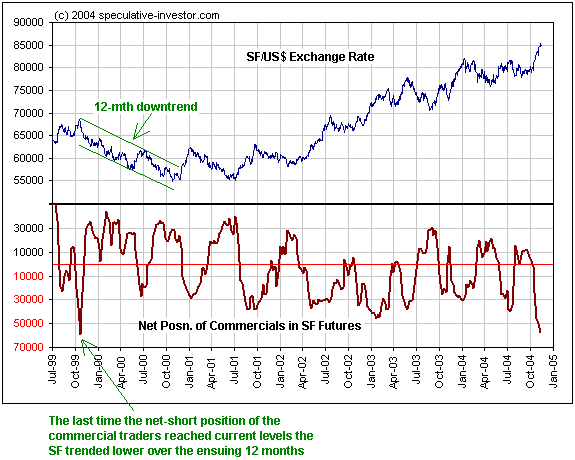
Current Market Situation
...the
only other time the commercial net-short position was near its current
level was just prior to the start of a 12-month downward trend in the
Swiss Franc. ...the lack of acceleration in the gold price and in the
HUI means that there is a lot more to come on the upside OR that our
indicators will warn us of a trend reversal very soon after a top has
been put in place...
The US$ is still hitting new lows on almost a daily basis, but the
below chart indicates that the 'rubber band' continues to be stretched.
The chart shows that the net-short position of commercial traders in
Swiss Franc futures has dropped to near its lowest level of the past
six years and that the only other time the commercial net-short
position was near its current level was just prior to the start of a
12-month downward trend in the Swiss Franc.
This chart, in effect, shows 'potential energy', but at this stage the
market has not begun the process of converting potential energy into
kinetic energy and there is no telling how far the rubber band will be
stretched before a trend change occurs. When the dollar does eventually
reverse higher, though, it is unlikely that we'll simply get a brief
rally to relieve the oversold condition. Instead, a 6-12 month upward
trend would be a more probable outcome.
We've decided not to
act in ANTICIPATION of a trend reversal in the dollar because when a
bona fide reversal does occur it should quickly become apparent in the
performances of gold and gold stocks as well as in the behaviour of the
currency market. And as things currently stand there are no signs of an
impending trend reversal in the performances of gold and gold stocks.
For example, the HUI/gold ratio (chart included below) appears to be
consolidating ABOVE its 40-day moving average while gold's advance, to
date, has been orderly (chart also included below). We suspect that
some gold investors are lamenting the lack of acceleration in the gold
price, but acceleration is typically something that happens near the
END of a move.
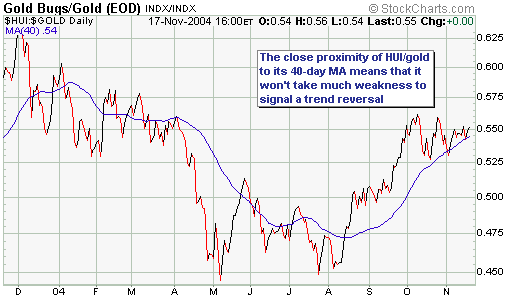

We like the current
situation because the lack of acceleration in the gold price and in the
HUI means that there is a lot more to come on the upside OR that our
indicators will warn us of a trend reversal very soon after a top has
been put in place (because only a small amount of weakness will be
needed to signal a reversal).
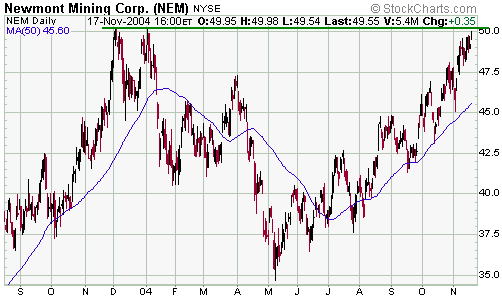
The below chart shows that the Newmont Mining (NYSE: NEM) stock price
has moved up to just below its December-2003 and January-2004 peaks, so
if it reverses course from near the current level it will look like a
'triple top' has been put in place. As we've mentioned many times in
the past, though, triple tops USUALLY don't hold, meaning that any
pullback that begins from around the $50 level will probably turn out
to be a consolidation within a continuing upward trend.
Stockbrokers
We often get asked to
recommend US-based brokers that can be used for the trading of stocks
on the Canadian exchanges. One broker that we've mentioned in the past
that appears to offer a reasonable service in this regard is Pennaluna
and Company (www.penntrade.com). The only problem we know of with
Pennaluna is that it is not registered in all states and is therefore
not available to all of our US-based subscribers.
Another stockbroker previously mentioned at TSI is Barry Murphy and Co.
(www.barrymurphy.com), a company based in Boston and registered in all
50 states. Based on our experience this company will be able to provide
a good solution for non-Canadians (including people in countries other
than the US) wanting to trade the junior gold/silver stocks (or any
other stocks) on the Canadian stock exchanges. Barry Murphy and Co. can
offer a flat rate of US$29.95 for each trade on a Canadian exchange,
regardless of the number of shares traded or the price of the shares.
Please contact Mr Damian Gates at Barry Murphy and Co. on 1800 2212111
or 617 4261770 for further details. Note that to get the
above-mentioned flat rate you MUST identify yourself as a
Speculative-Investor subscriber. Please also note that we receive no
commissions or any other form of payment from any stockbrokers.
In addition, several of the major on-line brokerages in the US provide
their customers with the ability to trade on the Canadian exchanges.
Scotttrade.com and Interactivebrokers.com are two that we know of that
offer this service.
Most of the small Canadian-based gold and silver stocks also trade on
the US over-the-counter markets (the Pink Sheets or the OTC BB).
However, we'd strongly advise against trading on these markets because
they are generally illiquid and inefficient. As a result, buy/sell
spreads are often very high (meaning that you could end up paying a few
percent more when you buy and then end up receiving a few percent less
when you eventually sell) and your order may not be filled even if the
stock trades through your buy or sell price. The bottom line is that if
you are interested in trading these stocks and your current broker
doesn't allow you to trade on the Canadian exchanges then you'd be well
served to spend the 20 minutes it takes to open an account with a
broker that does provide such a service.
Update
on Stock Selections
 In
the e-mail sent to subscribers on Monday we provided brief updates on
Lynx, Zinifex, First Majestic and Metallic Ventures, and advised that
we were going to exit Plum Creek Timber for a gain of 53%. The e-mail
has been archived at http://www.speculative-investor.com/new/stockemail.asp In
the e-mail sent to subscribers on Monday we provided brief updates on
Lynx, Zinifex, First Majestic and Metallic Ventures, and advised that
we were going to exit Plum Creek Timber for a gain of 53%. The e-mail
has been archived at http://www.speculative-investor.com/new/stockemail.asp
On Wednesday Desert Sun Mining (TSX: DSM) reported a 300K-ounce
increase in the measured and indicated resource at its Jacobina project
in Brazil and mentioned that additional resource calculations would be
announced before year-end. Because construction of the Jacobina mine is
almost complete any increase in reserves is potentially important
because in this situation even a modest increase can result in a much
better internal rate of return for the project.
Wednesday's 'news' should not have come as a surprise to anyone who has
been following the DSM story, so in that respect the 21% leap in the
stock price was a little strange. Therefore, rather than simply a
reaction to the predictable news we suspect that Wednesday's surge in
the stock price was the culmination of several months of consolidation
during which stock was transferred from 'weak hands' (people who were
worried by the preceding decline in the stock price and who thought the
gold bull market might be over) to 'strong hands' (people who
recognised that the stock offered exceptional value). This
consolidation most likely resulted in the absorption of a lot of
overhead supply, meaning that once a technical breakout occurred there
was nothing to get in the way of a sharp rise in the stock price.
The following extract from the 22nd September Interim Update was
written when DSM was trading at C$1.31 and it is still applicable, but
note that you DON'T make money in junior gold stocks by buying AFTER a
stock has already broken out and rocketed higher.
"DSM is on track to bring
the 100K oz/yr Jacobina Mine into production during the first quarter
of next year and to increase its mineable reserves to around 2M ounces.
Once Jacobina is in production at the design production rate and
assuming the aforementioned 2M-ounce reserve (the current reserve is
around 1M) a reasonable market value for the company would be US$200M
(100K ounces of production at US$2,000/oz or 2M ounces of reserves at
US$100/oz). This would equate to around C$3.50/share assuming a total
share count of 75M."
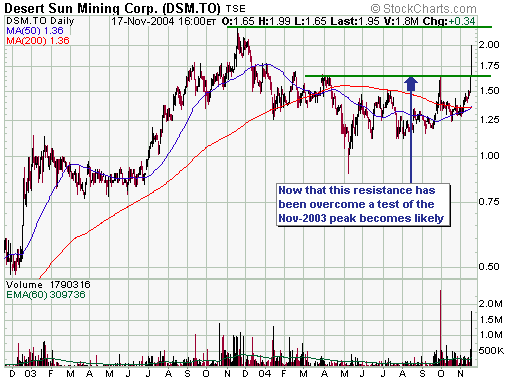
Chart Sources
Charts appearing in today's commentary
are courtesy of:
http://stockcharts.com/index.html
http://www.futuresource.com/
http://www.decisionpoint.com/

|