|
- Interim Update 17th December 2014
Copyright
Reminder
The commentaries that appear at TSI
may not be distributed, in full or in part, without our written permission.
In particular, please note that the posting of extracts from TSI commentaries
at other web sites or providing links to TSI commentaries at other web
sites (for example, at discussion boards) without our written permission
is prohibited.
We reserve the right to immediately
terminate the subscription of any TSI subscriber who distributes the TSI
commentaries without our written permission.
TSI Xmas
and New Year Schedule
We'll be taking a break over the Christmas/New-Year period,
which means that we are going to miss four commentaries. There will
be a Weekly Market Update this weekend (published earlier than usual
due to our travel schedule) and then no regular reports until the
Interim Update on Thursday 8th January. However, between the coming
Weekly Update and the 8th January Interim Update we will issue one
or two brief market updates via email. Also, there will probably be
a least a couple of posts at the TSI Blog.
The Fed
The Fed and Inflation Expectations
The Fed wants the US$ to lose purchasing power at a steady rate. In fact,
according to the Fed it is not only important that the US$ lose purchasing power
over time at the rate of at least 2% per year, but also important that the
public expects the US$ to lose purchasing power. In other words, the Fed wants
the public to anticipate generally higher prices. The reason is that people
supposedly won't buy anything today if they believe that prices will be lower in
the future. This is monumentally stupid, but it is what it is.
Over the long haul the Fed has been incredibly successful when measured against
its goals of having the US$ lose purchasing power and maintaining a general
expectation of further US$ depreciation. However, due to the massive build-up of
debt and the periodic liquidations of the mal-investments fostered by the Fed's
perpetual efforts to depreciate the dollar, inflation expectations sometimes
plunge. Despite the Fed's inflationary push, once in a while there is a
deflation scare.
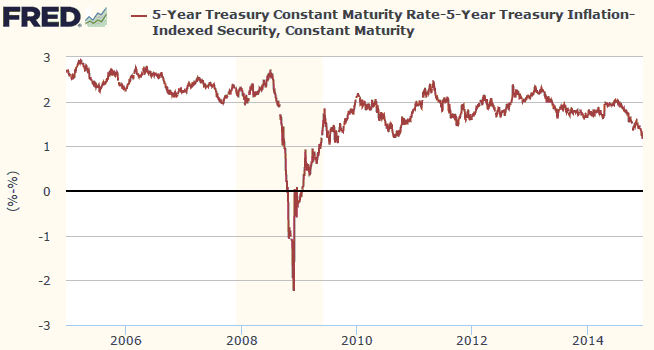
A mini deflation scare is actually happening right now. As illustrated by the
following chart of the 5-year T-Note yield minus the 5-year TIPS yield, a
measure of the amount of dollar depreciation the market expects the US
government to admit to over the next 5 years, inflation expectations have
dropped quite sharply over the past few months and are now at their lowest level
since 2009.
We will be surprised if the Fed allows the recent decline in inflation
expectations to evolve into a fully-fledged deflation scare.
"Considerable Time"
The financial markets have become so removed from their proper task of
efficiently allocating investment that the biggest determinant of asset prices
this week was whether or not the Fed would leave the words "considerable time"
in its post-FOMC statement. How silly is that!
As it turned out the words remained, but in a slightly different context. The
Fed reiterated that the extent to which it interferes with market prices would
continue to be data dependent, and that it "can be patient in beginning to
normalize the stance of monetary policy." It went on to state that it viewed
"this guidance as consistent with its previous statement that it likely will
be appropriate to maintain the 0 to 1/4 percent target range for the federal
funds rate for a considerable time".
There was plenty of volatility in the financial markets over the first three
days of this week as traders first placed bets on how the Fed's post-FOMC
statement would be worded and then reacted to the actual wording. However, one
place where there was minimal change in price was the Federal Funds Futures (FFF)
market. According to this market there will be two or three 0.25% Fed rate hikes
between May and December of next year, with two being the more likely.
The Fed, the US shale-oil industry and policy normalisation
The Fed's money-pumping and suppression of interest rates drastically changed
the economics of shale-oil production. It did this by helping to keep the oil
price at an unrealistically high level and providing the companies involved in
the production of oil from shale deposits with ready access to an abundance of
low-cost credit. The relatively high oil price combined with the glut of cheap
credit led to a great deal of mal-investment in the oil industry, the extent of
which is just starting to become apparent.
The extent of mal-investment stemming from central-bank manipulation of money
and credit will usually not be known until the monetary tide goes out. In the US
the monetary tide is beginning to go out and the first casualty is shaping up to
be the shale-oil industry. If the monetary tide continues to go out then there
will be many other casualties over the coming year or two. However, if the Fed
does an about-face and resumes its money-pumping, it could create a new burst of
activity at the same time as it prompts the wasting of more resources in
ill-advised business ventures and other investments.
The problem now faced by the Fed and the economy it constantly meddles with is
that the damage has been done. There is no way out. Attempting to withdraw the
so-called monetary stimulus will reveal the mal-investments of the past and
bring on a crisis, while providing more monetary stimulus will add new
mal-investments to the pile and make the eventual crisis even worse.
In other words, the Fed is kidding itself when it talks about a plan to
normalise monetary policy. A significant shift in the direction of a more
'normal' monetary policy will bring on a crisis and cause any such plan to be
abandoned.
Starting to get bullish on oil
Analysts are competing with each other to see who can come up
with the lowest price forecast for oil. This is the opposite of what they were
doing during the first half of 2008, when they were competing to see who could
come up with the highest price forecast. At the same time, Market Vane's bullish
percentage has dropped to 11, which means that about 90% of the traders surveyed
by Market Vane are now bearish on oil. Near the major oil price top during the
second quarter of 2008, about 90% of traders surveyed by Market Vane were
bullish. From a contrarian perspective it therefore makes as much sense to be
bullish on oil now as it made to be bearish on oil in Q2-2008.
Based on the path followed by the oil price around previous major lows and the
absence of speculative capitulation in the oil futures market, we expect that a
significant rebound in the oil market over the weeks ahead will be followed by a
decline to a new, and final, low during the first half of 2015. However, we also
expect that the oil price will be moderately above its current level by the end
of next year and a lot higher than its current level by the end of 2016. This is
because the Fed will be quick to shift back into money-pumping mode should there
be significant deteriorations in the economic data or the stock market over the
months ahead, and because the combination of sentiment and valuation suggests
that commodities will be the main beneficiaries of the next round of money
pumping.
For the first time in a long time, our intermediate-term oil outlook is bullish.
The Stock Market
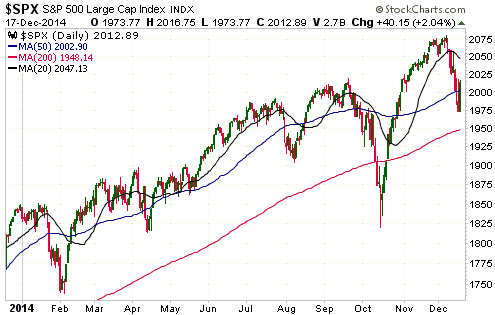
The S&P500 Index (SPX) broke below its 50-day MA on Monday,
dropped further on Tuesday, and then reversed course on Wednesday. The
non-sustained decline below the 50-day MA and a seasonal tailwind suggest that a
2-4 week bottom is in place.
The potential exists for a much larger/longer decline to get underway in
January.
Gold and the Dollar
Gold
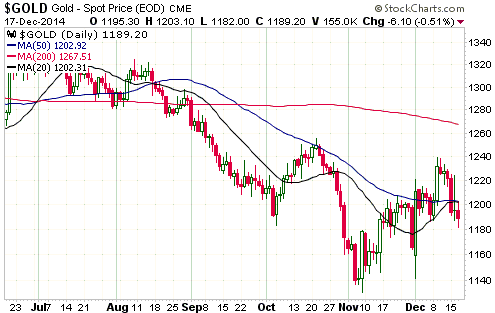
On Monday of this week the US$ gold price dropped back below $1200 and below its
50-day and 20-day moving averages. This wasn't ideal, but there was no
follow-through to the downside and the gold market took the US dollar's strong
Wednesday rebound in stride. The price action is neutral.
We plan to take another look at gold's fundamentals in the coming Weekly Update.
They remain mixed (neither bullish nor bearish), but will likely turn bullish at
around the same time as or just after the US stock market makes a peak of at
least intermediate-term importance.
Gold is a beneficiary of the mal-investment wrought by the central bank's
money-pumping and interest-rate suppression, but only after the mal-investment
starts becoming apparent. There are preliminary signs that this is happening,
with the sharp decline in the oil price having shone a light on potential
problems in the US shale-oil industry. That explains why gold has separated from
oil and the industrial metals over the past 6 weeks.
Gold Stocks
In a short
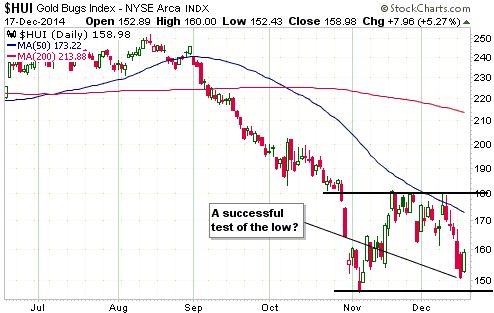
post at the Blog after the close of trading on Tuesday, we wrote that a) the
HUI and the XAU had just closed lower for five days in a row and were testing
their early-November lows, and b) the next up-day for the HUI, whether it be
Wednesday or Thursday or Friday, would probably mark the completion of a
successful test of the early-November low and the start of a larger/longer rally
than the initial post-crash rebound.
The next up-day turned out to be Wednesday. It's therefore likely that the
gold-stock indices have just competed successful tests of their early-November
lows. However, this won't be proven until the HUI closes above 180.
The most likely alternative is a decline to slightly below Tuesday's low (within
the next three trading days) prior to the start of a rally.
In the latest Weekly Update we said that the gold-mining sector temporarily
appeared to be getting influenced in equal amounts by gold bullion and mining
equities in general. Prior to this week that involved getting pulled upward by
the strength in the gold market and pulled downward by the weakness in
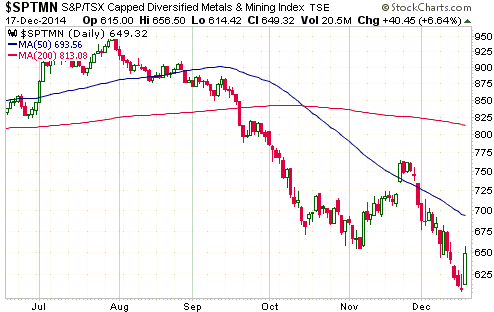
diversified mining stocks (as represented by SPTMN), but on Wednesday 17th
December a modicum of weakness in the gold market was more than offset by a 7%
bounce in SPTMN.
The effects of tax-loss selling were painfully obvious at the junior end of the
gold-mining sector during the first two days of this week, with some stocks that
were already extremely 'oversold' suffering additional large losses. AKG, PG.TO
and PVG are three TSI stocks that were noticeable victims of tax-related selling
on Monday and Tuesday. Non-TSI stocks to get hit included Argonaut Gold (AR.TO),
which fell 10.3% on Monday and an additional 8.6% on Tuesday, Gabriel Resources
(GBU.TO), which fell an incredible 43.8% on Tuesday on no news, and Tanzanian
Royalty (TRX), which fell 4% on Monday and an additional 15.5% on Tuesday.
The reckless selling and the associated price action is paving the way for large
percentage gains from December lows to January highs.
The Currency Market
The following chart is a different way of displaying a relationship that we've
shown many times over the course of this year. It compares the VGK/SPX ratio, a
measure of how European equities are performing relative to US equities, with
the reciprocal of the Dollar Index, and suggests that almost all of the
significant fluctuations in the Dollar Index over the past two years can be
explained by the relative performance of the US stock market. When the US stock
market is relatively strong, the Dollar Index rises. When the US stock market is
relatively weak, the Dollar Index falls. It's as simple as that.
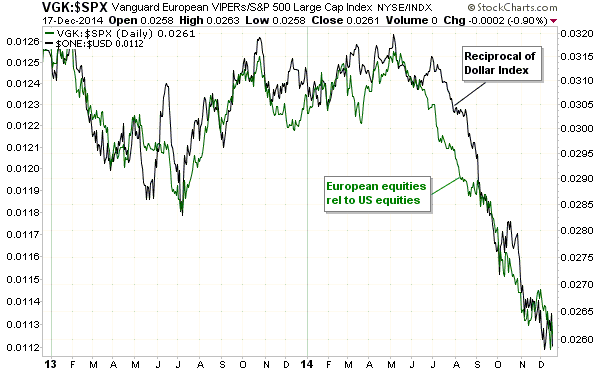
Wednesday's relative strength in the US stock market pushed the Dollar Index up
to near its early-December high. It will be interesting to see if it manages to
build on Wednesday's gains over the balance of the week and make a new high for
the year, or tests the early-December high and then reverses lower. The
resilience of the gold market and last week's lower close in the Dollar Index
point to the latter outcome.
Updates
on Stock Selections
Notes: 1) To review the complete list of current TSI stock selections, logon at
http://www.speculative-investor.com/new/market_logon.asp
and then click on "Stock Selections" in the menu. When at the Stock
Selections page, click on a stock's symbol to bring-up an archive of
our comments on the stock in question. 2) The Small Stock Watch List is
located at http://www.speculative-investor.com/new/smallstockwatch.html
Chart Sources
Charts appearing in today's commentary
are courtesy of:
http://stockcharts.com/index.html
http://research.stlouisfed.org/

|

